生态环境学报 ›› 2022, Vol. 31 ›› Issue (7): 1425-1433.DOI: 10.16258/j.cnki.1674-5906.2022.07.015
王晨茜( ), 张琼锐, 张若琪, 孙学超, 徐颂军*()
收稿日期:2022-02-19
出版日期:2022-07-18
发布日期:2022-08-31
通讯作者:
*徐颂军(1962年生),男,教授,博士,研究方向为环境生态学。E-mail: xusj@scnu.edu.cn作者简介:王晨茜(1997年生),女,硕士研究生,研究方向为景观生态学。E-mail: wangcx@m.scnu.edu.cn
基金资助:
WANG Chenxi(), ZHANG Qiongrui, ZHANG Ruoqi, SUN Xuechao, XU Songjun*()
Received:2022-02-19
Online:2022-07-18
Published:2022-08-31
摘要:
景观格局的动态变化通过改变进入河流的污染物种类和数量对水质净化服务产生重要影响。以广东省珠江流域为例,应用InVEST模型评估142个子流域的水质净化服务,基于Fragstats平台分析景观格局特征,在此基础上应用空间误差模型(SEM)和基于赤池信息准则(AIC)的模型选择与多模型推断探讨景观格局与水质净化服务的关系。结果发现,(1)景观组成方面,农田比例(CUL)和水域比例(WAT)对水质净化服务的削弱作用最强(β=0.47,0.15),是引起流域TP含量增加的主要原因。(2)景观配置方面,流域从上游到下游人类活动干扰加剧,景观异质性与复杂度增强,水质净化服务逐渐减弱。SHDI、ED与水质净化服务呈显著负相关(β=0.31,0.15)。(3)平均后的空间误差模型有效地消除了空间自相关性,具有较好的拟合效果(r2=90.12%)。其中,景观组成对水质净化服务的影响更大,解释了大部分的变化(r2=88.12%),景观配置指标只解释了另外的2%。该研究可为其他流域景观格局优化及水质净化服务管理提供参考。
中图分类号:
王晨茜, 张琼锐, 张若琪, 孙学超, 徐颂军. 广东省珠江流域景观格局对水质净化服务的影响[J]. 生态环境学报, 2022, 31(7): 1425-1433.
WANG Chenxi, ZHANG Qiongrui, ZHANG Ruoqi, SUN Xuechao, XU Songjun. Effects of Landscape Pattern on Water Quality Purification Service in the Pearl River Basin in Guangdong Province[J]. Ecology and Environment, 2022, 31(7): 1425-1433.
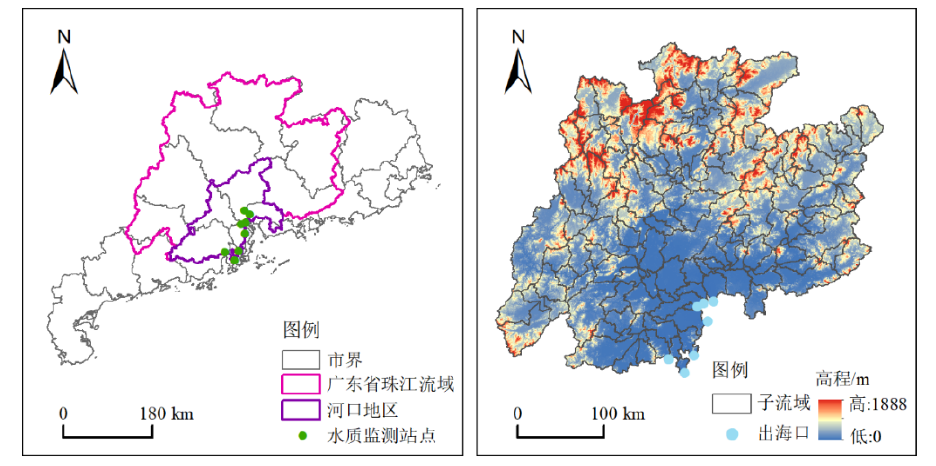
图1 研究区位置及子流域划分
Figure 1 Map of the study area location and subwatershed
| 土地利用类型 Land use types | 输出系数 Output coefficients | 截留效率 Retention efficiency/% |
|---|---|---|
| 耕地 Cultivated land | 4.680 | 25.00 |
| 林地 Forestland | 0.150 | 70.00 |
| 草地 Grassland | 0.800 | 48.00 |
| 水域 Openwater | 0.001 | 5.00 |
| 城镇 Urban land | 3.000 | 5.00 |
| 湿地 Wetland | 0.150 | 60.00 |
| 未利用地 Bareland | 0.510 | 5.00 |
表1 TP输出系数和植被截留效率
Table 1 TP output coefficients and vegetation retention efficiency
| 土地利用类型 Land use types | 输出系数 Output coefficients | 截留效率 Retention efficiency/% |
|---|---|---|
| 耕地 Cultivated land | 4.680 | 25.00 |
| 林地 Forestland | 0.150 | 70.00 |
| 草地 Grassland | 0.800 | 48.00 |
| 水域 Openwater | 0.001 | 5.00 |
| 城镇 Urban land | 3.000 | 5.00 |
| 湿地 Wetland | 0.150 | 60.00 |
| 未利用地 Bareland | 0.510 | 5.00 |
| 景观指数 Landscape pattern index | 计算公式 The formula | 指标描述 Index description | 生态学意义 Ecological meaning |
|---|---|---|---|
| 景观组成占比 PLAND | | 某一地类面积占整个景观面积(A)的百分比,aij为斑块ij的面积 | 景观组成面积比 |
| 最大斑块指数 LPI | | 最大斑块面积占整个景观面积的百分比,ai为斑块i的面积 | 景观优势度 |
| 边缘密度 ED | | 单位面积上异质景观要素斑块间的边缘长度(m·hm-2),Pij为斑块ij的周长 | 景观复杂度 |
| 景观形状指数 LSI | | 斑块形状与相同面积的正方形的偏离程度,lTE为斑块边界总长度 | 景观破碎度 |
| 斑块结合度 COHE | | 某一种斑块类型和周围相邻斑块类型的空间连接程度 (%) | 景观连通性 |
| 香农多样性指数 SHDI | | 斑块类型在景观中出现的概率及其多样性,Pi为斑块类型i所占景观总面积的比例 | 景观异质性 |
表2 景观指数
Table 2 Landscape pattern index
| 景观指数 Landscape pattern index | 计算公式 The formula | 指标描述 Index description | 生态学意义 Ecological meaning |
|---|---|---|---|
| 景观组成占比 PLAND | | 某一地类面积占整个景观面积(A)的百分比,aij为斑块ij的面积 | 景观组成面积比 |
| 最大斑块指数 LPI | | 最大斑块面积占整个景观面积的百分比,ai为斑块i的面积 | 景观优势度 |
| 边缘密度 ED | | 单位面积上异质景观要素斑块间的边缘长度(m·hm-2),Pij为斑块ij的周长 | 景观复杂度 |
| 景观形状指数 LSI | | 斑块形状与相同面积的正方形的偏离程度,lTE为斑块边界总长度 | 景观破碎度 |
| 斑块结合度 COHE | | 某一种斑块类型和周围相邻斑块类型的空间连接程度 (%) | 景观连通性 |
| 香农多样性指数 SHDI | | 斑块类型在景观中出现的概率及其多样性,Pi为斑块类型i所占景观总面积的比例 | 景观异质性 |

图2 广东省珠江流域单位面积、子流域TP输出强度
Figure 2 TP outputs per unit area and subwatershed in the study area
| 区域 Districts | 总磷 TP/(kg∙hm-2) | 耕地比例 CUL/% | 草地比例 GRA/% | 水域比例 WAT/% | 景观形状指数 LSI | 最大斑块指数 LPI/% | 边缘密度 ED/(m∙hm-2) | 斑块结合度 COHE/% | 香农多样性指数 SHDI |
|---|---|---|---|---|---|---|---|---|---|
| 河口地区 The Estuary Area | 0.60 | 27.47 | 1.56 | 10.77 | 17.80 | 32.26 | 25.85 | 99.45 | 1.15 |
| 非河口地区 Non Estuary Area | 0.30 | 18.67 | 4.48 | 3.46 | 16.21 | 53.94 | 20.35 | 99.66 | 0.85 |
| 总研究区域 The entire area | 0.37 | 21.60 | 3.45 | 5.99 | 16.83 | 46.74 | 22.21 | 99.59 | 0.95 |
| 莫兰指数 Moran’s I | 0.69 | 0.39 | 0.40 | 0.57 | 0.06 | 0.35 | 0.36 | 0.08 | 0.57 |
| P值 P value | <0.001 | <0.001 | <0.001 | <0.001 | 0.1041 | <0.001 | <0.001 | <0.005 | <0.001 |
表3 流域内主要辖区TP及景观指标
Table 3 TP outputs and landscape indices of the main districts in the study area
| 区域 Districts | 总磷 TP/(kg∙hm-2) | 耕地比例 CUL/% | 草地比例 GRA/% | 水域比例 WAT/% | 景观形状指数 LSI | 最大斑块指数 LPI/% | 边缘密度 ED/(m∙hm-2) | 斑块结合度 COHE/% | 香农多样性指数 SHDI |
|---|---|---|---|---|---|---|---|---|---|
| 河口地区 The Estuary Area | 0.60 | 27.47 | 1.56 | 10.77 | 17.80 | 32.26 | 25.85 | 99.45 | 1.15 |
| 非河口地区 Non Estuary Area | 0.30 | 18.67 | 4.48 | 3.46 | 16.21 | 53.94 | 20.35 | 99.66 | 0.85 |
| 总研究区域 The entire area | 0.37 | 21.60 | 3.45 | 5.99 | 16.83 | 46.74 | 22.21 | 99.59 | 0.95 |
| 莫兰指数 Moran’s I | 0.69 | 0.39 | 0.40 | 0.57 | 0.06 | 0.35 | 0.36 | 0.08 | 0.57 |
| P值 P value | <0.001 | <0.001 | <0.001 | <0.001 | 0.1041 | <0.001 | <0.001 | <0.005 | <0.001 |
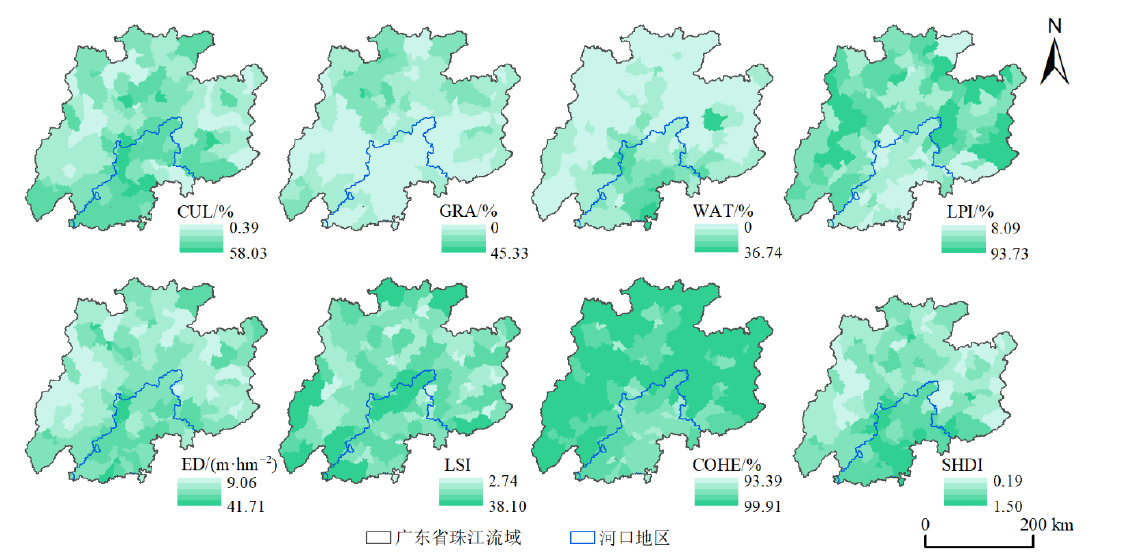
图3 广东省珠江流域景观格局
Figure 3 Landscape pattern of the study area
| 模型排序 Model ranks | 景观组成 Landscape composition | 景观配置 Landscape configuration | vAICc | ΔvAICc | wi |
|---|---|---|---|---|---|
| 1 | CUL+WAT | ED+SHDI | -299.88 | 0.00 | 0.18 |
| 2 | CUL+WAT | ED+LSI+SHDI | -299.73 | 0.15 | 0.16 |
| 3 | CUL+WAT | LPI+ED+LSI+SHDI | -299.22 | 0.66 | 0.13 |
| 4 | CUL+WAT+GRA | ED+SHDI | -299.11 | 0.77 | 0.12 |
| 5 | CUL+WAT | LPI+ED+SHDI | -298.90 | 0.98 | 0.11 |
| 6 | CUL+WAT+GRA | ED+LSI+SHDI | -298.37 | 1.51 | 0.08 |
| 7 | CUL+WAT+GRA | LPI+ED+SHDI | -298.33 | 1.55 | 0.08 |
| 8 | CUL+WAT | ED+COHE+SHDI | -298.06 | 1.82 | 0.07 |
| 9 | CUL+WAT+GRA | LPI+ED+LSI+SHDI | -297.97 | 1.92 | 0.07 |
表4 模型子集
Table 4 Model selection statistics
| 模型排序 Model ranks | 景观组成 Landscape composition | 景观配置 Landscape configuration | vAICc | ΔvAICc | wi |
|---|---|---|---|---|---|
| 1 | CUL+WAT | ED+SHDI | -299.88 | 0.00 | 0.18 |
| 2 | CUL+WAT | ED+LSI+SHDI | -299.73 | 0.15 | 0.16 |
| 3 | CUL+WAT | LPI+ED+LSI+SHDI | -299.22 | 0.66 | 0.13 |
| 4 | CUL+WAT+GRA | ED+SHDI | -299.11 | 0.77 | 0.12 |
| 5 | CUL+WAT | LPI+ED+SHDI | -298.90 | 0.98 | 0.11 |
| 6 | CUL+WAT+GRA | ED+LSI+SHDI | -298.37 | 1.51 | 0.08 |
| 7 | CUL+WAT+GRA | LPI+ED+SHDI | -298.33 | 1.55 | 0.08 |
| 8 | CUL+WAT | ED+COHE+SHDI | -298.06 | 1.82 | 0.07 |
| 9 | CUL+WAT+GRA | LPI+ED+LSI+SHDI | -297.97 | 1.92 | 0.07 |
| 景观指数 Landscape index | 平均系数±标准差 β±SD | 重要性 Importance | Pearson相关系数 Pearson coefficients |
|---|---|---|---|
| 耕地比例 CUL | 0.47±0.05*** | 1 | 0.689*** |
| 水域比例 WAT | 0.15±0.05** | 1 | 0.464*** |
| 边缘密度 ED | 0.15±0.05** | 1 | 0.456*** |
| 香农多样性指数 SHDI | 0.31±0.07*** | 1 | 0.735*** |
| 景观形状指数 LSI | -0.02±0.04 | 0.44 | 0.194* |
| 最大斑块指数 LPI | -0.02±0.03 | 0.39 | -0.641*** |
| 草地比例 GRA | 0.03±0.07 | 0.35 | -0.198* |
| 斑块结合度 COHE | -0.003±0.03 | 0.07 | -0.186* |
表5 模型平均结果
Table 5 Model averaging
| 景观指数 Landscape index | 平均系数±标准差 β±SD | 重要性 Importance | Pearson相关系数 Pearson coefficients |
|---|---|---|---|
| 耕地比例 CUL | 0.47±0.05*** | 1 | 0.689*** |
| 水域比例 WAT | 0.15±0.05** | 1 | 0.464*** |
| 边缘密度 ED | 0.15±0.05** | 1 | 0.456*** |
| 香农多样性指数 SHDI | 0.31±0.07*** | 1 | 0.735*** |
| 景观形状指数 LSI | -0.02±0.04 | 0.44 | 0.194* |
| 最大斑块指数 LPI | -0.02±0.03 | 0.39 | -0.641*** |
| 草地比例 GRA | 0.03±0.07 | 0.35 | -0.198* |
| 斑块结合度 COHE | -0.003±0.03 | 0.07 | -0.186* |
| [1] | BURNHAM K, ANDERSON D, 2002. Model Selection and Multimodel Inference: A Practical Information-Theoretic Approach[M]. 2nd ed. New York: Springer-Verlag. |
| [2] |
CLéMENT F, RUIZ J, RODRíGUEZ M A, et al., 2017. Landscape diversity and forest edge density regulate stream water quality in agricultural catchments[J]. Ecological Indicators, 72: 627-639.
DOI URL |
| [3] |
DING J, JIANG Y, LIU Q, et al., 2016. Influences of the land use pattern on water quality in low-order streams of the Dongjiang River basin, China: A multi-scale analysis[J]. Science of The Total Environment, 551-552: 205-216.
DOI URL |
| [4] |
GERGEL S E, 2005. Spatial and non-spatial factors: When do they affect landscape indicators of watershed loading?[J]. Landscape Ecology, 20(2): 177-189.
DOI URL |
| [5] |
HAO F H, ZHANG X, WANG X, et al., 2012. Assessing the Relationship Between Landscape Patterns and Nonpoint-Source Pollution in the Danjiangkou Reservoir Basin in China[J]. Journal of the American Water Resources Association, 48(6): 1162-1177.
DOI URL |
| [6] | LIU J Y, NING J, KUANG W H, et al., 2018. Spatio-temporal patterns and characteristics of land-use change in China during 2010-2015 [J]. Acta Geographica Sinica, 73(5): 789-802. |
| [7] |
MEI Y, KONG X H, KE X L, et al., 2017. The Impact of Cropland Balance Policy on Ecosystem Service of Water Purification: A Case Study of Wuhan, China[J]. Water, 9(8): 620.
DOI URL |
| [8] | QIU J X, TURNER M G, 2015. Importance of landscape heterogeneity in sustaining hydrologic ecosystem services in an agricultural watershed[J]. Ecosphere, 6(11): 229. |
| [9] |
SHI P, ZHANG Y, LI Z B, et al., 2017. Influence of land use and land cover patterns on seasonal water quality at multi-spatial scales[J]. CATENA, 151: 182-190.
DOI URL |
| [10] |
SI X F, PIMM S L, RUSSELL G J, et al., 2014. Turnover of breeding bird communities on islands in an inundated lake[J]. Journal of Biogeography, 41(12): 2283-2292.
DOI URL |
| [11] |
WHITTINGHAM M J, STEPHENS P A, BRADBURY R B, et al., 2006. Why do we still use stepwise modelling in ecology and behaviour?[J]. Journal of Animal Ecology, 75(5): 1182-1189.
DOI URL |
| [12] |
WU J H, LU J, 2019. Landscape patterns regulate non-point source nutrient pollution in an agricultural watershed[J]. Science of The Total Environment, 669: 377-388.
DOI URL |
| [13] |
XIE Y J, YU X J, NG N C, et al., 2018. Exploring the dynamic correlation of landscape composition and habitat fragmentation with surface water quality in the Shenzhen river and deep bay cross-border watershed, China[J]. Ecological Indicators, 90: 231-246.
DOI URL |
| [14] |
XU G C, LI P, LU K X, et al., 2019. Seasonal changes in water quality and its main influencing factors in the Dan River basin[J]. CATENA, 173: 131-140.
DOI URL |
| [15] |
ZHANG J, LI S Y, DONG R Z, et al., 2019. Influences of land use metrics at multi-spatial scales on seasonal water quality: A case study of river systems in the Three Gorges Reservoir Area, China[J]. Journal of Cleaner Production, 206: 76-85.
DOI URL |
| [16] |
ZHANG S, YANG D, YANG Y, et al., 2018. Excessive afforestation and soil drying on China's Loess Plateau[J]. Journal of Geophysical Research: Biogeosciences, 123(3): 923-935.
DOI URL |
| [17] |
ZHOU Y Q, MA J R, ZHANG Y L, et al., 2017. Improving water quality in China: Environmental investment pays dividends[J]. Water Research, 118: 152-159.
DOI URL |
| [18] | 韩会庆, 罗绪强, 游仁龙, 等, 2016. 基于InVEST模型的贵州省珠江流域水质净化功能分析[J]. 南京林业大学学报(自然科学版), 40(5): 87-92. |
| HAN H Q, LUO X Q, YOU R L, et al., 2016. Analysis of water purification function in the Pearl River basin in Guizhou Province using InVEST model[J]. Journal of Nanjing Forestry University ( Natural Sciences Edition), 40(5): 87-92. | |
| [19] | 胡蕾, 吴健, 李海萍, 2018. 生态系统服务与居民收入的耦合关系及影响因素--以丽江拉市海流域为例[J]. 生态学报, 38(18): 6402-6411. |
| HU L, WU J, LI H P, 2018. The coupling relationship between ecosystem services and residents' income and its impact factors: A case study of the Lashihai basin in Lijiang, Yunan[J]. Acta Ecologica Sinica, 38(18): 6402-6411. | |
| [20] | 黄斌斌, 李若男, 李睿达, 等, 2020. 雄安新区上游白洋淀流域水质净化提升目标下的生态恢复格局优化[J]. 生态学报, 40(20): 7143-7152. |
| HUANG B B, LI R N, LI R D, et al., 2020. Optimization of ecological restoration pattern targeted for water purification improvement in the Baiyangdian watershed, Xiong’an New Area[J]. Acta Ecologica Sinica, 40(20): 7143-7152. | |
| [21] |
李洪庆, 刘黎明, 郑菲, 等, 2018. 基于水环境质量控制的高集约化农业景观格局优化研究[J]. 资源科学, 40(1): 44-52.
DOI |
| LI H Q, LIU L M, ZHENG F, et al., 2018. Agricultural landscape pattern optimization of high intensive agricultural area based on water quality control[J]. Resources Science, 40(1): 44-52. | |
| [22] | 李昆, 王玲, 孙伟, 等, 2020. 城市化下景观格局对河流水质变化的空间尺度效应分析[J]. 环境科学学报, 40(1): 343-352. |
| LI K, WANG L, SUN W, et al., 2020. Spatial effect of landscape pattern on river water quality under urbanization[J]. Acta Scientiae Circumstantiae, 40(1): 343-352. | |
| [23] | 林兰稳, 朱立安, 曾清苹, 2020. 广东省农业面源污染时空变化及其防控对策[J]. 生态环境学报, 29(6): 1245-1250. |
| LIN L W, ZHU L A, ZENG Q P, 2020. Spatial and temporal changes of agricultural non-point source pollution in Guangdong province and its prevention and control measures[J]. Ecology and Environmental Sciences, 29(6): 1245-1250. | |
| [24] |
刘纪远, 宁佳, 匡文慧, 等, 2018. 2010-2015年中国土地利用变化的时空格局与新特征[J]. 地理学报, 73(5): 789-802.
DOI |
| LIU J Y, NING J, KUANG W H, et al., 2018. Spatio-temporal patterns and characteristics of land-use change in China during 2010-2015 [J]. Acta Geographica Sinica, 73(5): 789-802. | |
| [25] | 刘庆, 2016. 流溪河流域景观特征对河流水质的影响及河岸带对氮的削减效应[D]. 广州: 中国科学院研究生院 (广州地球化学研究所). |
| LIU Q, 2016. Influence of watershed landscape characteristics on river water quality and research on reduction of nitrogen in riparian in Liu Xi River[D]. Guangzhou: Chinese Academy of Sciences (Guangzhou Institute of Geochemistry). | |
| [26] |
刘旭拢, 邓孺孺, 秦雁, 等, 2016. 东江流域地表水功能区水质对土地利用的响应[J]. 热带地理, 36(2): 296-302.
DOI |
| LIU X L, DENG R R, QIN Y, et al., 2016. Water quality response on land use pattern in the water function area of the Dongjiang River Basin[J]. Tropical Geography, 36(2): 296-302. | |
| [27] |
刘洋, 吕建树, 毕军, 2019. 流域陆地生态系统水体净化服务表征及驱动力分析[J]. 地理科学进展, 38(4): 588-599.
DOI |
| LIU Y, LÜ J S, BI J, 2019. Characterizing water purification services and quantifying their driving factors in watershed terrestrial ecosystems[J]. Progress in Geography, 38(4): 588-599. | |
| [28] | 刘怡娜, 孔令桥, 肖燚, 等, 2019. 长江流域景观格局与生态系统水质净化服务的关系[J]. 生态学报, 39(3): 844-852. |
| LIU Y N, KONG L Q, XIAO Y, et al., 2019. Relationships between landscape pattern and ecosystem water purification service in the Yangtze River Basin[J]. Acta Ecologica Sinica, 39(3): 844-852. | |
| [29] | 刘宥延, 刘兴元, 张博, 等, 2020. 基于InVEST模型的黄土高原丘陵区水源涵养功能空间特征分析[J]. 生态学报, 40(17): 6161-6170. |
| LIU Y Y, LIU X Y, ZHANG B, et al., 2020. Spatial features analysis of water conservation function in the hilly areas of the Loess Plateau based on InVEST model[J]. Acta Ecologica Sinica, 40(17): 6161-6170. | |
| [30] | 吕乐婷, 高晓琴, 刘琦, 等, 2021. 东江流域景观格局对氮、磷输出的影响[J]. 生态学报, 41(5): 1758-1765. |
| LÜ L T, GAO X Q, LIU Q, et al., 2021. Influence of landscape pattern on nitrogen and phosphorus output in the Dongjiang River Basin[J]. Acta Ecologica Sinica, 41(5): 1758-1765. | |
| [31] | 石金昊, 朱卫红, 田乐, 等, 2021. 基于SWAT模型的布尔哈通河流域面源污染的变化研究[J]. 灌溉排水学报, 40(4): 130-136. |
| SHI J H, ZHU W H, TIAN L, 2021. Using SWAP to study the changes in nonpoint source pollution in Burhatong River Basin[J]. Journal of Irrigation and Drainage, 40(4): 130-136. | |
| [32] |
王飞, 陶宇, 欧维新, 2021. 景观格局变化的水质净化服务响应关系研究进展[J]. 地球科学进展, 36(1): 17-28.
DOI |
|
WANG F, TAO Y, OU W X, 2021. Research progress on response relationship of water quality purification service with landscape pattern change[J]. Advances in Earth Science, 36(1): 17-28.
DOI |
|
| [33] | 王杰, 李鹏, 高海东, 等, 2018. 丹江上游土地利用/景观指数与水质关系初探[J]. 水土保持研究, 25(6): 383-389. |
| WANG J, LI P, GAO H D, et al., 2018. Preliminary study on the relationship between land use/landscape index and water quality in the upper reaches of Danjiang River[J]. Research of Soil and Water Conservation, 25(6): 383-389. | |
| [34] | 徐鹏, 林永红, 杨顺顺, 等, 2017. 珠江流域氮、磷营养盐入河量估算及预测[J]. 湖泊科学, 29(6): 1359-1371. |
|
XU P, LIN Y H, YANG S S, et al., 2017. Input load to river and future projection fornnitrogen and phosphorous nutrient controlling of Pearl River Basin[J]. Journal of Lake Sciences, 29(6): 1359-1371.
DOI URL |
|
| [35] | 赵鹏, 夏北成, 秦建桥, 等, 2012. 流域景观格局与河流水质的多变量相关分析[J]. 生态学报, 32(8): 2331-2341. |
|
ZHAO P, XIA B C, QIN J Q, et al., 2012. Multivariate correlation analysis between landscape pattern and water quality[J]. Acta Ecologica Sinica, 32(8): 2331-2341.
DOI URL |
| [1] | 张钧韦, 夏圣洁, 陈慧儒, 刘艳红. 山西中部城市群景观格局演变对其热环境的影响研究[J]. 生态环境学报, 2023, 32(5): 943-955. |
| [2] | 玄锦, 李祖婵, 邹诚, 秦子博, 吴雅华, 黄柳菁. 江心洲景观类型和格局对植物多样性的多尺度影响——以闽江流域福州段为例[J]. 生态环境学报, 2022, 31(12): 2320-2330. |
| [3] | 边振兴, 张宇飞, 果晓玉, 林琳, 于淼. 低山丘陵区农业景观格局对害虫-捕食性天敌食物网的影响[J]. 生态环境学报, 2022, 31(1): 79-88. |
| [4] | 董鑫, 郎嘉钰, 楚原梦冉, 赵姗姗, 张晋东, 白文科. 川金丝猴家域的季节性差异[J]. 生态环境学报, 2021, 30(7): 1342-1352. |
| [5] | 胡琳, 李思悦. 不同空间尺度土地利用结构与景观格局对龙川江流域水质的影响[J]. 生态环境学报, 2021, 30(7): 1470-1481. |
| [6] | 雷金睿, 陈宗铸, 陈毅青, 陈小花, 李苑菱, 吴庭天. 1990—2018年海南岛湿地景观格局演变及其驱动力分析[J]. 生态环境学报, 2020, 29(1): 59-70. |
| 阅读次数 | ||||||
|
全文 |
|
|||||
|
摘要 |
|
|||||