生态环境学报 ›› 2025, Vol. 34 ›› Issue (5): 796-806.DOI: 10.16258/j.cnki.1674-5906.2025.05.013
蒋瑞霞1,2( ), 王正鑫2, 孙芳芳3, 董程程3, 赵龙龙2, 李晓丽2, 陈劲松2, 李洪忠2,*(), 王莉1,*()
收稿日期:2024-10-14
出版日期:2025-05-18
发布日期:2025-05-16
通讯作者:
*李洪忠。E-mail: 作者简介:蒋瑞霞(1998年生),女,硕士研究生,主要从事生态环境遥感监测、生态系统调查与评估等方面的研究。E-mail: rx.jiang1@siat.ac.cn
基金资助:
JIANG Ruixia1,2(), WANG Zhengxin2, SUN Fangfang3, DONG Chengcheng3, ZHAO Longlong2, LI Xiaoli2, CHEN Jinsong2, LI Hongzhong2,*(), WANG Li1,*()
Received:2024-10-14
Online:2025-05-18
Published:2025-05-16
摘要: 深圳市地处多云多雨地区,且生态状况变化剧烈,基于传统的遥感生态指数(Remote Sensing Ecological Index,RSEI)难以确保长时序生态质量评估的一致性。对此,基于RSEI,通过优化数据选取、建立指标合成、不变区域指标归一化,以及多时相融合主成分分析等步骤,构建统一遥感生态指数(Unified RSEI,URSEI)。在此基础上,应用1990-2020年Landsat系列影像数据,开展了深圳市30年间生态质量时空演变格局分析研究。结果表明,1)1990-2020年间,深圳市生态质量总体呈先下降后上升的趋势,30年间URSEI总体上升了2.94%。2)对1 km网格生态质量时空演变分析表明,1990-2000年,深圳市生态质量总体略有下降。其中,2000-2010年,深圳市东北部和西北部的生态质量有所下降,其他地区呈现改善趋势;2010-2020年,深圳市生态质量进一步提升,仅在部分在建区域表现出生态质量的下降。3)该研究所提出的URSEI能够有效减弱多云多雨天气对长时序生态质量评估一致性的影响。反演的深圳市生态质量在长时序制图过程中没有出现明显的拼接痕迹,且其时空分布特征与深圳市的实际状况高度吻合,能够准确反映深圳市生态质量的时空演变过程。研究结果可为深圳市生态保护和可持续发展提供科学依据。
中图分类号:
蒋瑞霞, 王正鑫, 孙芳芳, 董程程, 赵龙龙, 李晓丽, 陈劲松, 李洪忠, 王莉. 基于统一遥感生态指数的深圳市生态质量时空演变格局分析[J]. 生态环境学报, 2025, 34(5): 796-806.
JIANG Ruixia, WANG Zhengxin, SUN Fangfang, DONG Chengcheng, ZHAO Longlong, LI Xiaoli, CHEN Jinsong, LI Hongzhong, WANG Li. Analysis of the Spatiotemporal Evolution Pattern of Shenzhen’s Ecological Quality Based on the Unified Remote Sensing Ecological Index[J]. Ecology and Environmental Sciences, 2025, 34(5): 796-806.

图1 研究区地理位置示意图
Figure 1 Geographical location of the studied area
| 年份 | 第一主成分PC1 | 各指标对应的特征向量 | |||||
|---|---|---|---|---|---|---|---|
| 特征值 | 贡献率/% | VNDVI | VWET | VNDBSI | VLST | ||
| 1990 | 0.134 | 75.3 | 0.277 | 0.592 | 0.593 | 0.471 | |
| 2000 | 0.141 | 75.8 | 0.342 | 0.569 | 0.531 | 0.526 | |
| 2010 | 0.186 | 81.0 | 0.347 | 0.510 | 0.530 | 0.583 | |
| 2020 | 0.194 | 85.3 | 0.396 | 0.534 | 0.549 | 0.507 | |
| 融合统一 | 0.146 | 81.6 | 0.362 | 0.524 | 0.529 | 0.562 | |
表1 深圳市1990-2020年主成分分析结果
Table 1 The result of principal component analysis for Shenzhen from 1990 to 2020
| 年份 | 第一主成分PC1 | 各指标对应的特征向量 | |||||
|---|---|---|---|---|---|---|---|
| 特征值 | 贡献率/% | VNDVI | VWET | VNDBSI | VLST | ||
| 1990 | 0.134 | 75.3 | 0.277 | 0.592 | 0.593 | 0.471 | |
| 2000 | 0.141 | 75.8 | 0.342 | 0.569 | 0.531 | 0.526 | |
| 2010 | 0.186 | 81.0 | 0.347 | 0.510 | 0.530 | 0.583 | |
| 2020 | 0.194 | 85.3 | 0.396 | 0.534 | 0.549 | 0.507 | |
| 融合统一 | 0.146 | 81.6 | 0.362 | 0.524 | 0.529 | 0.562 | |
| 年份 | 指标 | VNDVI | VWET | VNDBSI | VLST | VURSEI |
|---|---|---|---|---|---|---|
| 1990 | VNDVI | 1 | 0.419 | 0.576 | 0.479 | 0.853 |
| VWET | 0.419 | 1 | 0.691 | 0.612 | 0.735 | |
| VNDBSI | 0.576 | 0.691 | 1 | 0.652 | 0.769 | |
| VLST | 0.479 | 0.612 | 0.652 | 1 | 0.693 | |
| 0.491 | 0.574 | 0.640 | 0.581 | 0.763 | ||
| 2000 | VNDVI | 1 | 0.492 | 0.608 | 0.591 | 0.720 |
| VWET | 0.492 | 1 | 0.647 | 0.654 | 0.648 | |
| VNDBSI | 0.608 | 0.647 | 1 | 0.665 | 0.831 | |
| VLST | 0.591 | 0.654 | 0.665 | 1 | 0.732 | |
| 0.564 | 0.598 | 0.640 | 0.637 | 0.733 | ||
| 2010 | VNDVI | 1 | 0.536 | 0.676 | 0.635 | 0.785 |
| VWET | 0.536 | 1 | 0.793 | 0.706 | 0.736 | |
| VNDBSI | 0.676 | 0.793 | 1 | 0.729 | 0.858 | |
| VLST | 0.635 | 0.706 | 0.729 | 1 | 0.783 | |
| 0.616 | 0.678 | 0.733 | 0.690 | 0.791 | ||
| 2020 | VNDVI | 1 | 0.587 | 0.831 | 0.605 | 0.822 |
| VWET | 0.587 | 1 | 0.788 | 0.753 | 0.787 | |
| VNDBSI | 0.831 | 0.7788 | 1 | 0.765 | 0.864 | |
| VLST | 0.605 | 0.753 | 0.765 | 1 | 0.774 | |
| 0.674 | 0.706 | 0.795 | 0.708 | 0.812 |
表2 URSEI与各生态指标的相关系数矩阵
Table 2 Correlation matrix among URSEI and four factors
| 年份 | 指标 | VNDVI | VWET | VNDBSI | VLST | VURSEI |
|---|---|---|---|---|---|---|
| 1990 | VNDVI | 1 | 0.419 | 0.576 | 0.479 | 0.853 |
| VWET | 0.419 | 1 | 0.691 | 0.612 | 0.735 | |
| VNDBSI | 0.576 | 0.691 | 1 | 0.652 | 0.769 | |
| VLST | 0.479 | 0.612 | 0.652 | 1 | 0.693 | |
| 0.491 | 0.574 | 0.640 | 0.581 | 0.763 | ||
| 2000 | VNDVI | 1 | 0.492 | 0.608 | 0.591 | 0.720 |
| VWET | 0.492 | 1 | 0.647 | 0.654 | 0.648 | |
| VNDBSI | 0.608 | 0.647 | 1 | 0.665 | 0.831 | |
| VLST | 0.591 | 0.654 | 0.665 | 1 | 0.732 | |
| 0.564 | 0.598 | 0.640 | 0.637 | 0.733 | ||
| 2010 | VNDVI | 1 | 0.536 | 0.676 | 0.635 | 0.785 |
| VWET | 0.536 | 1 | 0.793 | 0.706 | 0.736 | |
| VNDBSI | 0.676 | 0.793 | 1 | 0.729 | 0.858 | |
| VLST | 0.635 | 0.706 | 0.729 | 1 | 0.783 | |
| 0.616 | 0.678 | 0.733 | 0.690 | 0.791 | ||
| 2020 | VNDVI | 1 | 0.587 | 0.831 | 0.605 | 0.822 |
| VWET | 0.587 | 1 | 0.788 | 0.753 | 0.787 | |
| VNDBSI | 0.831 | 0.7788 | 1 | 0.765 | 0.864 | |
| VLST | 0.605 | 0.753 | 0.765 | 1 | 0.774 | |
| 0.674 | 0.706 | 0.795 | 0.708 | 0.812 |
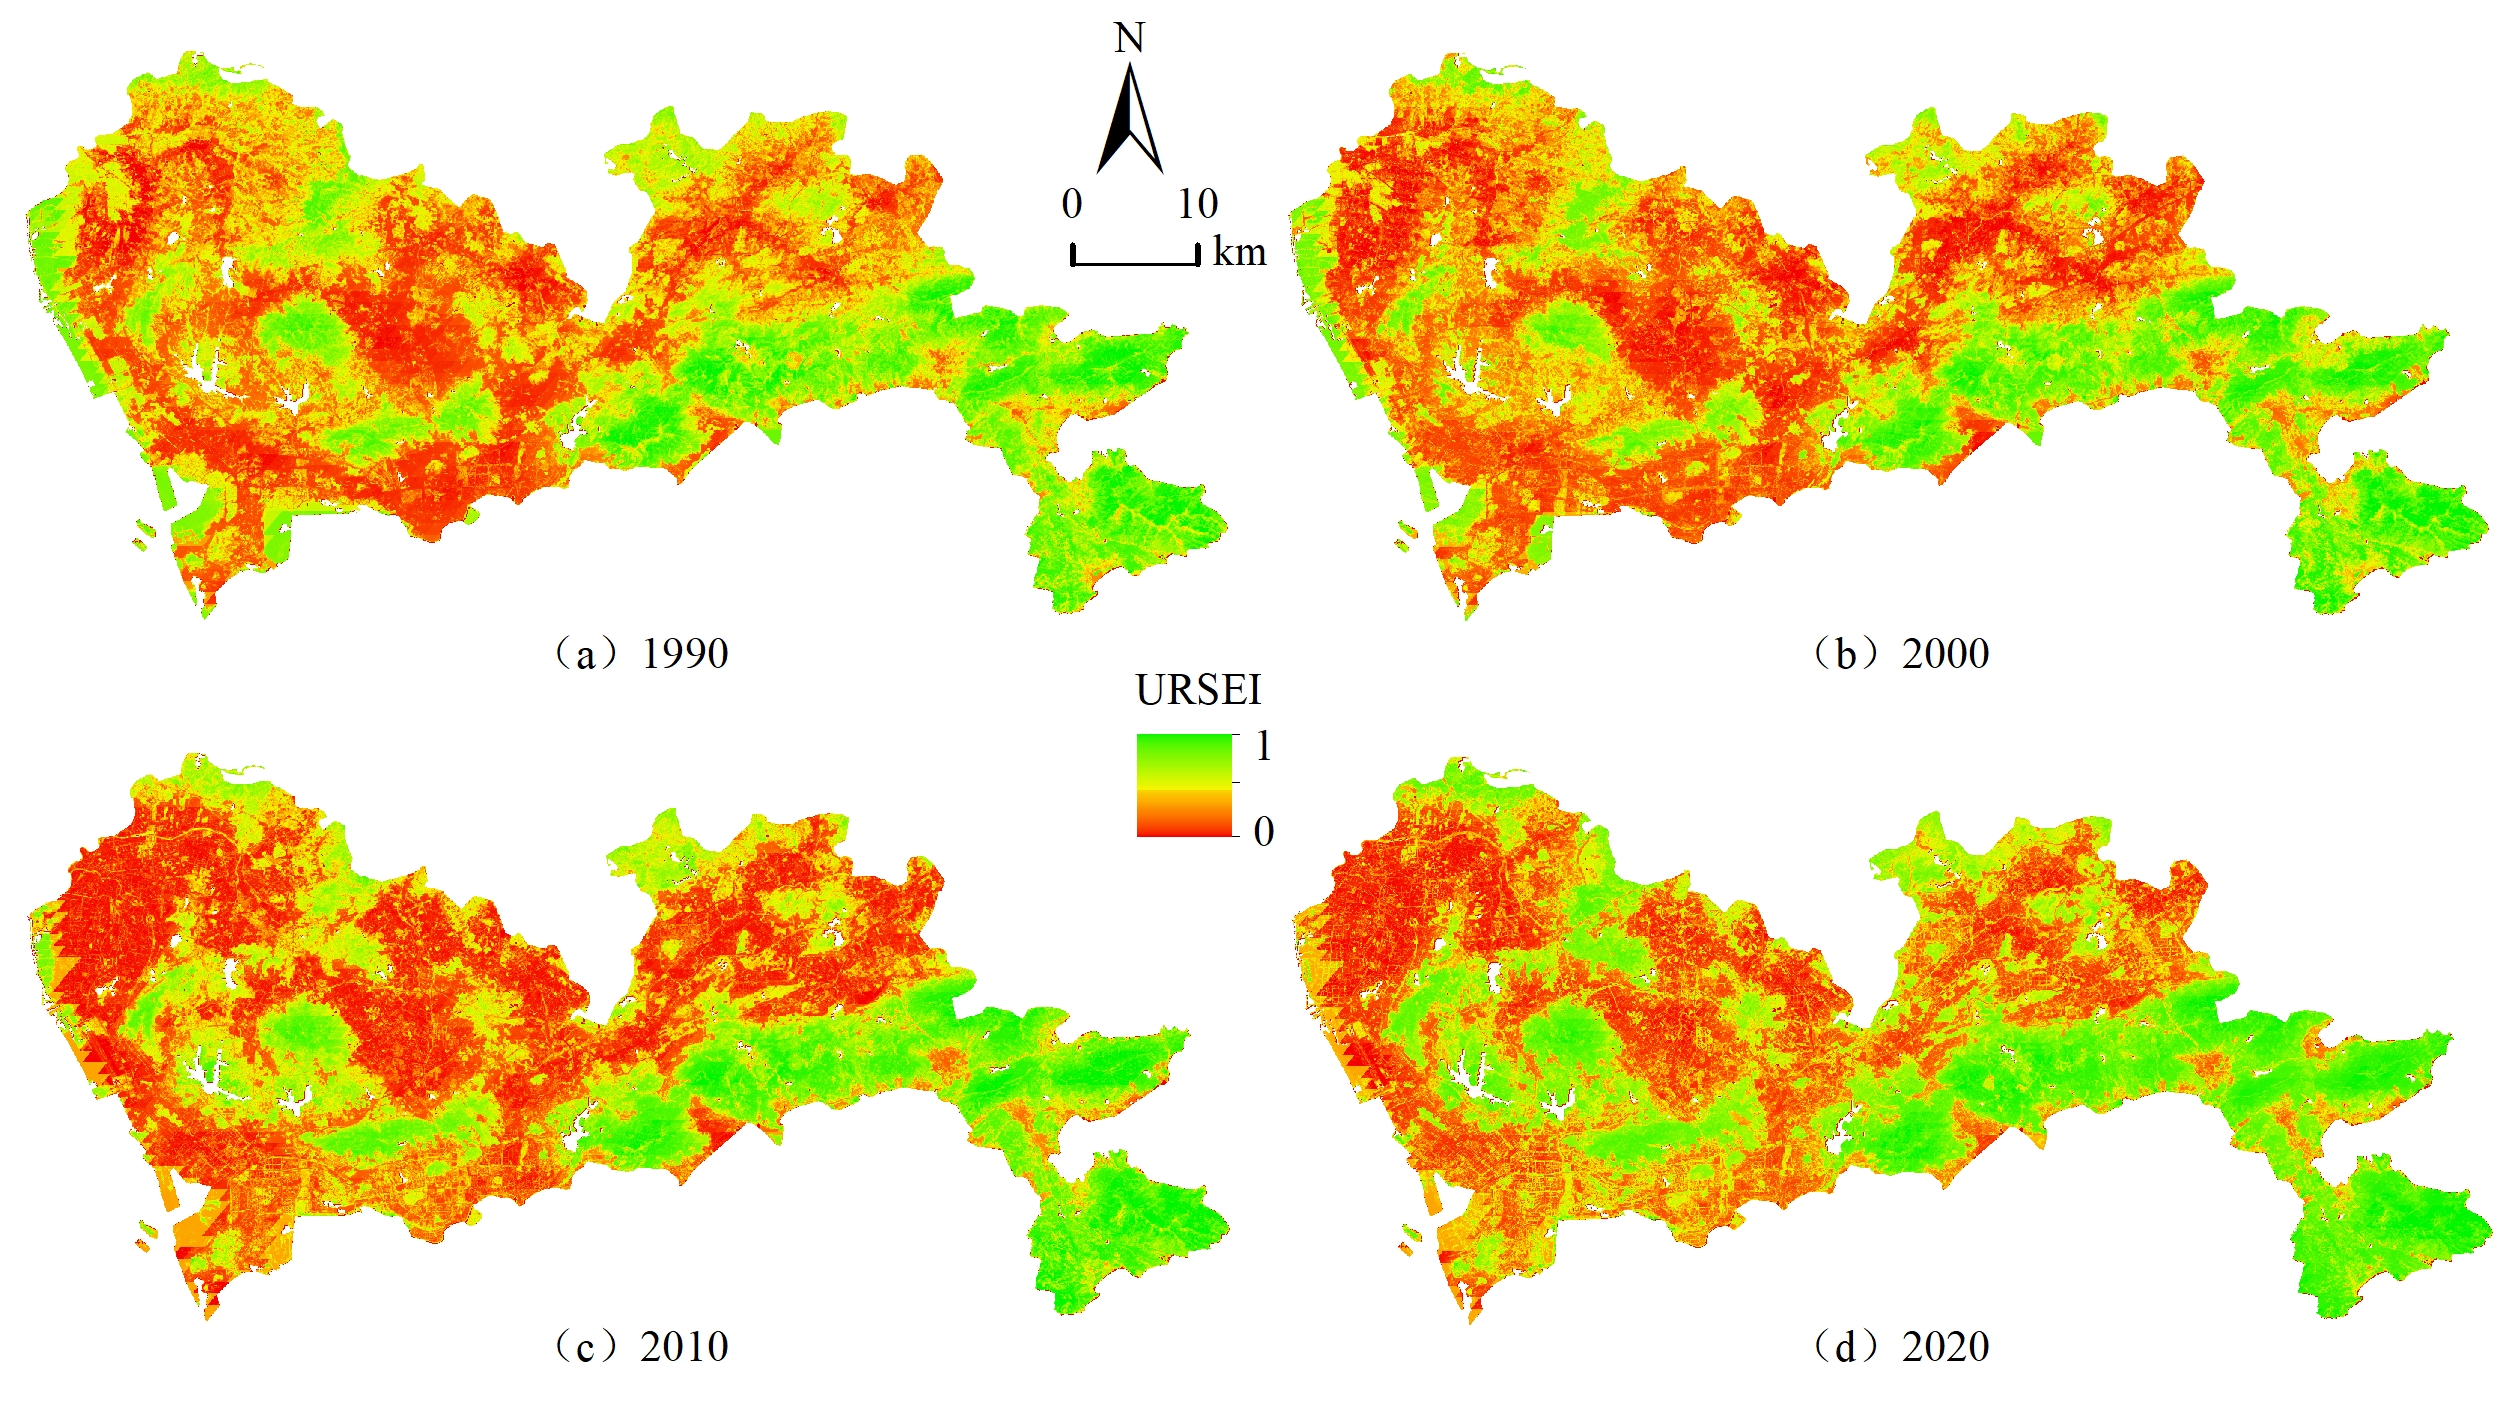
图2 深圳市1990-2020年统一遥感生态指数(URSEI)分布图
Figure 2 Distribution map of Unified RSEI in Shenzhen from 1990 to 2020
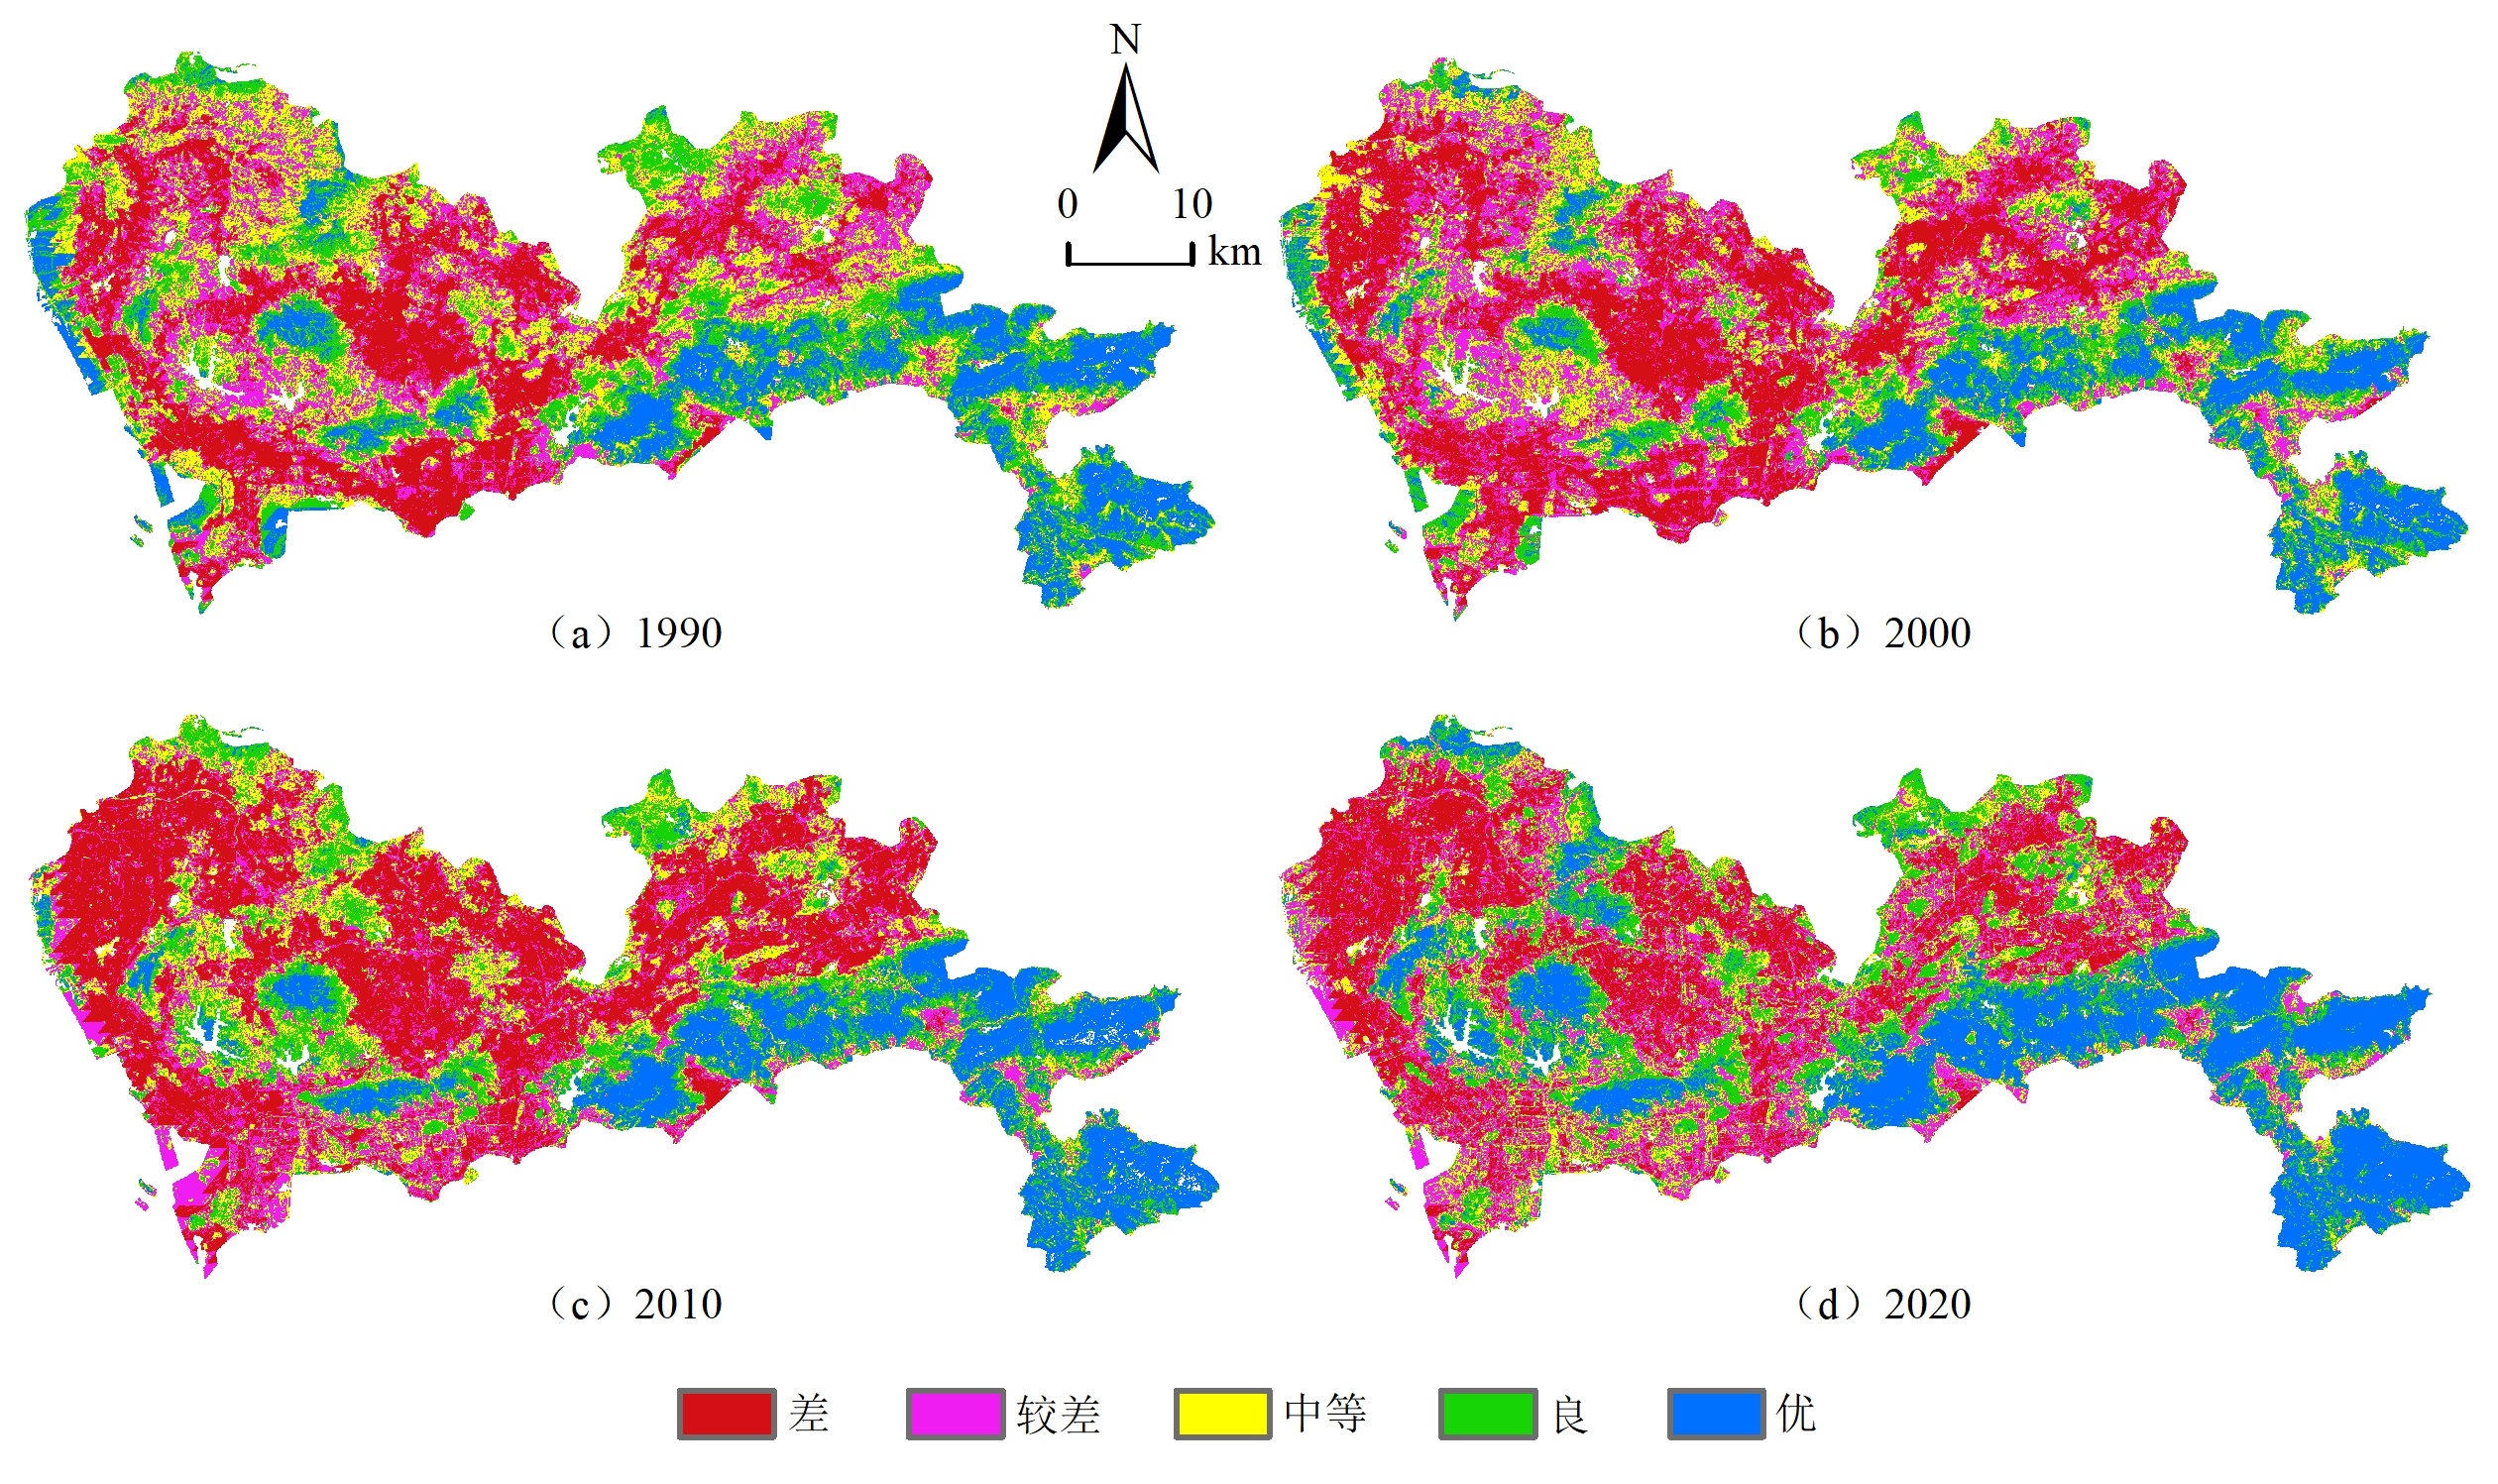
图3 深圳市1990-2020年统一遥感生态指数(URSEI)等级分级
Figure 3 Shenzhen’s Unified RSEI grade maps from 1990 to 2020
| 生态质量 等级 | 1990 | 2000 | 2010 | 2020 | |||||||
|---|---|---|---|---|---|---|---|---|---|---|---|
| 面积/km2 | 比例/% | 面积/km2 | 比例/% | 面积/km2 | 比例/% | 面积/km2 | 比例/% | ||||
| [0, 0.2)差 | 398.43 | 20.9 | 509.69 | 26.8 | 614.72 | 32.3 | 437.96 | 23.0 | |||
| [0.2, 0.4)较差 | 417.68 | 21.9 | 482.12 | 25.3 | 364.88 | 19.2 | 418.28 | 22.0 | |||
| [0.4, 0.6)中等 | 422.30 | 22.2 | 361.82 | 19.0 | 310.01 | 16.3 | 281.81 | 14.8 | |||
| [0.6, 0.8)良 | 382.56 | 20.1 | 302.41 | 15.9 | 309.43 | 16.3 | 356.37 | 18.7 | |||
| [0.8, 1)优 | 282.71 | 14.9 | 248.61 | 13.1 | 301.99 | 15.9 | 410.64 | 21.6 | |||
表3 深圳市1990-2020年URSEI各等级面积与占比
Table 3 Area and percentage of Shenzhen’s URSEI grades from 1990 to 2020
| 生态质量 等级 | 1990 | 2000 | 2010 | 2020 | |||||||
|---|---|---|---|---|---|---|---|---|---|---|---|
| 面积/km2 | 比例/% | 面积/km2 | 比例/% | 面积/km2 | 比例/% | 面积/km2 | 比例/% | ||||
| [0, 0.2)差 | 398.43 | 20.9 | 509.69 | 26.8 | 614.72 | 32.3 | 437.96 | 23.0 | |||
| [0.2, 0.4)较差 | 417.68 | 21.9 | 482.12 | 25.3 | 364.88 | 19.2 | 418.28 | 22.0 | |||
| [0.4, 0.6)中等 | 422.30 | 22.2 | 361.82 | 19.0 | 310.01 | 16.3 | 281.81 | 14.8 | |||
| [0.6, 0.8)良 | 382.56 | 20.1 | 302.41 | 15.9 | 309.43 | 16.3 | 356.37 | 18.7 | |||
| [0.8, 1)优 | 282.71 | 14.9 | 248.61 | 13.1 | 301.99 | 15.9 | 410.64 | 21.6 | |||
| 行政区 | 生态环境质量指数(RSEI) | |||||||
|---|---|---|---|---|---|---|---|---|
| 1990 | 排序 | 2000 | 排序 | 2010 | 排序 | 2020 | 排序 | |
| 罗湖区 | 0.51 | 4 | 0.49 | 3 | 0.54 | 3 | 0.59 | 3 |
| 福田区 | 0.29 | 10 | 0.29 | 10 | 0.40 | 6 | 0.46 | 6 |
| 南山区 | 0.43 | 6 | 0.38 | 6 | 0.41 | 5 | 0.49 | 5 |
| 宝安区 | 0.42 | 7 | 0.37 | 7 | 0.31 | 9 | 0.37 | 9 |
| 盐田区 | 0.69 | 2 | 0.65 | 2 | 0.67 | 2 | 0.72 | 2 |
| 龙华区 | 0.34 | 9 | 0.30 | 9 | 0.28 | 10 | 0.36 | 10 |
| 坪山区 | 0.52 | 3 | 0.46 | 4 | 0.46 | 4 | 0.52 | 4 |
| 光明区 | 0.44 | 5 | 0.39 | 5 | 0.34 | 7 | 0.39 | 8 |
| 龙岗区 | 0.39 | 8 | 0.33 | 8 | 0.32 | 8 | 0.41 | 7 |
| 大鹏区 | 0.76 | 1 | 0.72 | 1 | 0.79 | 1 | 0.80 | 1 |
表4 URSEI分区统计
Table 4 Zonal Statistic of URSEI
| 行政区 | 生态环境质量指数(RSEI) | |||||||
|---|---|---|---|---|---|---|---|---|
| 1990 | 排序 | 2000 | 排序 | 2010 | 排序 | 2020 | 排序 | |
| 罗湖区 | 0.51 | 4 | 0.49 | 3 | 0.54 | 3 | 0.59 | 3 |
| 福田区 | 0.29 | 10 | 0.29 | 10 | 0.40 | 6 | 0.46 | 6 |
| 南山区 | 0.43 | 6 | 0.38 | 6 | 0.41 | 5 | 0.49 | 5 |
| 宝安区 | 0.42 | 7 | 0.37 | 7 | 0.31 | 9 | 0.37 | 9 |
| 盐田区 | 0.69 | 2 | 0.65 | 2 | 0.67 | 2 | 0.72 | 2 |
| 龙华区 | 0.34 | 9 | 0.30 | 9 | 0.28 | 10 | 0.36 | 10 |
| 坪山区 | 0.52 | 3 | 0.46 | 4 | 0.46 | 4 | 0.52 | 4 |
| 光明区 | 0.44 | 5 | 0.39 | 5 | 0.34 | 7 | 0.39 | 8 |
| 龙岗区 | 0.39 | 8 | 0.33 | 8 | 0.32 | 8 | 0.41 | 7 |
| 大鹏区 | 0.76 | 1 | 0.72 | 1 | 0.79 | 1 | 0.80 | 1 |
| 结束时间的 等级 | 开始时间的等级 | ||||
|---|---|---|---|---|---|
| 差 | 较差 | 中 | 良 | 优 | |
| 差 | 未变化 | 退化 | 退化 | 退化 | 退化 |
| 较差 | 改善 | 未变化 | 退化 | 退化 | 退化 |
| 中 | 改善 | 改善 | 未变化 | 退化 | 退化 |
| 良 | 改善 | 改善 | 改善 | 未变化 | 退化 |
| 优 | 改善 | 改善 | 改善 | 改善 | 未变化 |
表5 生态质量等级转移矩阵
Table5 Transfer matrix of ecological quality levels
| 结束时间的 等级 | 开始时间的等级 | ||||
|---|---|---|---|---|---|
| 差 | 较差 | 中 | 良 | 优 | |
| 差 | 未变化 | 退化 | 退化 | 退化 | 退化 |
| 较差 | 改善 | 未变化 | 退化 | 退化 | 退化 |
| 中 | 改善 | 改善 | 未变化 | 退化 | 退化 |
| 良 | 改善 | 改善 | 改善 | 未变化 | 退化 |
| 优 | 改善 | 改善 | 改善 | 改善 | 未变化 |
| 起止 年份 | 改善 | 未变化 | 退化 | |||||
|---|---|---|---|---|---|---|---|---|
| 面积/km2 | 比例/% | 面积/km2 | 比例/% | 面积/km2 | 比例/% | |||
| 1990-2000 | 236.41 | 12.4 | 1110.46 | 58.4 | 556.31 | 29.2 | ||
| 2000-2010 | 477.82 | 25.1 | 1017.09 | 53.5 | 405.72 | 21.4 | ||
| 2010-2020 | 643.23 | 33.8 | 1101.33 | 57.9 | 156.35 | 8.3 | ||
| 1990-2020 | 627.73 | 33.0 | 820.80 | 43.1 | 454.94 | 23.9 | ||
表6 深圳市1990-2020年生态质量等级转移矩阵
Table 6 Ecological quality level transfer matrix of Shenzhen from 1990 to 2020
| 起止 年份 | 改善 | 未变化 | 退化 | |||||
|---|---|---|---|---|---|---|---|---|
| 面积/km2 | 比例/% | 面积/km2 | 比例/% | 面积/km2 | 比例/% | |||
| 1990-2000 | 236.41 | 12.4 | 1110.46 | 58.4 | 556.31 | 29.2 | ||
| 2000-2010 | 477.82 | 25.1 | 1017.09 | 53.5 | 405.72 | 21.4 | ||
| 2010-2020 | 643.23 | 33.8 | 1101.33 | 57.9 | 156.35 | 8.3 | ||
| 1990-2020 | 627.73 | 33.0 | 820.80 | 43.1 | 454.94 | 23.9 | ||
| 等级 | 变化值 |
|---|---|
| 显著变差 | Δ<−0.1 |
| 略微变差 | −0.1≤Δ<−0.02 |
| 无明显变化 | −0.02≤Δ≤0.02 |
| 略微变好 | 0.02<Δ≤0.1 |
| 显著变好 | Δ>0.1 |
表7 生态质量变化分级表
Table 7 Ecological quality change classification table
| 等级 | 变化值 |
|---|---|
| 显著变差 | Δ<−0.1 |
| 略微变差 | −0.1≤Δ<−0.02 |
| 无明显变化 | −0.02≤Δ≤0.02 |
| 略微变好 | 0.02<Δ≤0.1 |
| 显著变好 | Δ>0.1 |

图4 1 km网格生态质量变化分级
Figure 4 Classification of ecological quality changes in 1 km grid
| [1] | AN M, XIE P, HE W J, et al., 2022. Spatiotemporal change of ecologic environment quality and human interaction factors in three gorges ecologic economic corridor, based on RSEI[J]. Ecological Indicators, 141: 109090. |
| [2] | HU X S, XU H Q, 2018. A new remote sensing index for assessing the spatial heterogeneity in urban ecological quality: A case from Fuzhou City, China[J]. Ecological indicators, 89: 11-21. |
| [3] | HU X S, XU H Q, 2019. A new remote sensing index based on the pressure-state-response framework to assess regional ecological change[J]. Environmental Science and Pollution Research, 26(6): 5381-5393. |
| [4] | LIU P, REN C Y, YU W S, et al., 2023. Exploring the ecological quality and its drivers based on annual remote sensing ecological index and multisource data in Northeast China[J]. Ecological indicators, 154: 110589. |
| [5] |
MCDONNELL M J, MACGREGOR-FORS I, 2016. The ecological future of cities[J]. Science, 352(6288): 936-938.
DOI PMID |
| [6] | XU D, YANG F, YU L, et al., 2021. Quantization of the coupling mechanism between eco-environmental quality and urbanization from multisource remote sensing data[J]. Journal of cleaner production, 321: 128948. |
| [7] | XU H Q, WANG Y F, GUAN H D, et al., 2019. Detecting ecological changes with a remote sensing based ecological index (RSEI) produced time series and change vector analysis[J]. Remote sensing, 11(20): 2345. |
| [8] | YUE H, LIU Y, LI Y, et al., 2019. Eco-environmental quality assessment in China’s 35 major cities based on remote sensing ecological index[J]. IEEE Access, 7: 51295-51311. |
| [9] | YANG C, ZHANG C C, LI Q Q, et al., 2020. Rapid urbanization and policy variation greatly drive ecological quality evolution in Guangdong-Hong Kong-Macau Greater Bay Area of China: A remote sensing perspective[J]. Ecological Indicators, 115: 106373. |
| [10] | YUAN B D, FU L N, ZOU Y A, et al., 2021. Spatiotemporal change detection of ecological quality and the associated affecting factors in Dongting Lake Basin, Based on RSEI[J]. Journal of Cleaner Production, 302: 126995. |
| [11] | ZHU D Y, CHEN T, WANG Z W, et al., 2021. Detecting ecological spatial-temporal changes by remote sensing ecological index with local adaptability[J]. Journal of Environmental Management, 299: 113655. |
| [12] | ZHANG M M, ABDULLAAL K, REN B, et al., 2022. Application of the optimal parameter geographic detector model in the identification of influencing factors of ecological quality in Guangzhou, China[J]. Land, 11(8): 1303. |
| [13] | 陈丽萍, 曾镘蓉, 2022. 基于遥感生态指数的深圳市生态环境质量变化动态分析[J]. 惠州学院学报, 42(6): 50-59. |
| CHEN L P, ZENG M R, 2022. Dynamic analysis of environment quality change in Shenzhen based on remote sensing ecological index[J]. Journal of Huizhou University, 42(6): 50-59. | |
| [14] | 程琳琳, 王振威, 田素锋, 等, 2021. 基于改进的遥感生态指数的北京市门头沟区生态环境质量评价[J]. 生态学杂志, 40(4): 1177-1185. |
|
CHENG L L, WANG Z W, TIAN S F, et al., 2021. Evaluation of eco-environmental quality in Mentougou district of Beijing based on improved remote sensing ecological index[J]. Chinese Journal of Ecology, 40(4): 1177-1185.
DOI |
|
| [15] | 陈智勇, 吴耀炜, 林港特, 等, 2024. 基于遥感生态指数的粤港澳生态环境质量与土地利用变化空间关系[J]. 环境科学, 45(11): 6433-6447. |
| CHEN Z Y, WU Y W, LIN G T, et al., 2024. Spatial relationship between eco-environment quality and land use change in Guangdong province-Hong Kong-Macao, China based on remote sensing-based ecological index[J]. Environmental Science, 45(11): 6433-6447. | |
| [16] |
方创琳, 王振波, 刘海猛, 2019. 美丽中国建设的理论基础与评估方案探索[J]. 地理学报, 74(4): 619-632.
DOI |
|
FANG C L, WANG Z B, LIU H M, 2019. Exploration on the theoretical basis and evaluation plan of beautiful China construction[J]. Acta Geographica Sinica, 74(4): 619-632.
DOI |
|
| [17] |
冯自贤, 佘璐, 王秀慧, 等, 2024. 基于改进遥感生态指数的宁夏生态环境质量时空变化[J]. 生态环境学报, 33(1): 131-143.
DOI |
| FENG Z X, SHE L, WANG X H, et al., 2024. Spatial and temporal variations of ecological environment quality in Ningxia based on improved remote sensing ecological index[J]. Ecology and Environmental Sciences, 33(1): 131-143. | |
| [18] | 付杰, 王萍, 张清, 等, 2021. 基于改进遥感生态指数的海南岛生态环境质量动态变化[J]. 农业资源与环境学报, 38(6): 1102-1111. |
| FU J, WANG P, ZHANG Q, et al., 2021. Dynamic monitoring of ecological environment quality of Hainan Island based on improved remote sensing ecological index[J]. Journal of Agricultural Resources and Environment, 38(6): 1102-1111. | |
| [19] | 郭城, 陈颖彪, 郑子豪, 等, 2021. 顾及时空背景的遥感生态指数适用性分析——以粤港澳大湾区为例[J]. 地理与地理信息科学, 37(5): 23-30. |
| GUO C, CHEN Y B, ZHENG Z H, et al., 2021. Applicability analysis of RSEI considering spatio-temporal background: A case study of Guangdong-Hong Kong-Macao Greater Bay Area[J]. Geography and Geo-Information Science, 37(5): 23-30. | |
| [20] | 蒋明明, 刘佳, 侯伟, 等, 2022. 一种改进的遥感生态指数构建及湿地监测应用[J]. 测绘科学, 47(7): 85-92. |
| JIANG M M, LIU J, HOU W, et al., 2022. An improved remote sensing-based ecological index and its application in wetland environment monitoring[J]. Science of Surveying and Mapping, 47(7): 85-92. | |
| [21] |
柯丽娜, 徐佳慧, 王楠, 等, 2022. 基于遥感生态指数的滨海湿地生态质量变化评价——以辽东湾北部区为例[J]. 生态环境学报, 31(7): 1417-1424.
DOI |
| KE L N, XU J H, WANG N, et al., 2022. Evaluation of ecological quality of coastal wetland based on remote sensing ecological index: A case study of northern Liaodong Bay[J]. Ecology and Environmental Sciences, 31(7): 1417-1424. | |
| [22] | 李婷, 董玉祥, 2022. 基于RSEI和景观功能的珠三角地区1986-2019年生态安全格局演变过程及其影响因子[J]. 陕西师范大学学报(自然科学版), 50(4): 69-80. |
| LI T, DONG Y X, 2022. Evolution of ecological security pattern and its influencing factors in the Pearl River Delta from 1986 to 2019 based on RSEI and landscape function[J]. Journal of Shanxi Normal University (Natural Science Edition), 50(4): 69-80. | |
| [23] |
施智勇, 胡晓婷, 谢慧黎, 等, 2023. 基于RSEI的生态环境质量评价及驱动力分析——以闽江流域(福州段)为例[J]. 测绘通报 (2): 28-33.
DOI |
|
SHI Z Y, HU X T, XIE H L, et al., 2023. Eco-environmental quality assessment and driving force analysis based on RSEI: A case study of the Minjiang River Basin (Fuzhou section)[J]. Bulletin of Surveying and Mapping (2): 28-33.
DOI |
|
| [24] | 田智慧, 尹传鑫, 王晓蕾, 2023. 鄱阳湖流域生态环境动态评估及驱动因子分析[J]. 环境科学, 44(2): 816-827. |
| TIAN Z H, YIN C X, WANG X L, 2023. Dynamic monitoring and driving factors analysis of ecological environment quality in Poyang Lake Basin[J]. Environmental Science, 44(2): 816-827. | |
| [25] | 王渊, 赵宇豪, 吴健生, 2020. 基于Google Earth Engine云计算的城市群生态质量长时序动态监测——以粤港澳大湾区为例[J]. 生态学报, 40(23): 8461-8473. |
| WANG Y, ZHAO Y H, WU J S, 2020. Dynamic monitoring of long time series of ecological quality in urban agglomerations using Google Earth Engine cloud computing: A case study of the Guangdong-Hong Kong-Macao Greater Bay Area, China[J]. Acta Ecologica Sinica, 40(23): 8461-8473. | |
| [26] | 魏玺, 阳大智, 蔡湘文, 等, 2024. 基于Google Earth Engine的漓江流域生态环境质量评价及驱动因子分析[J]. 中国生态农业学报, 32(9): 1592-1608. |
| WEI X, YANG D Z, CAI X W, et al., 2024. Ecological environmental quality evaluation and driving factor analysis of the Lijiang River Basin, Based on Google Earth Engine[J]. Chinese Journal of Eco-Agriculture, 32(9): 1592-1608. | |
| [27] | 徐涵秋, 2013a. 区域生态环境变化的遥感评价指数[J]. 中国环境科学, 33(5): 889-897. |
| XU H Q, 2013a. A remote sensing index for assessment of regional ecological changes[J]. China Environmental Science, 33(5): 889-897. | |
| [28] | 徐涵秋, 2013b. 城市遥感生态指数的创建及其应用[J]. 生态学报, 33(24): 7853-7862. |
| XU H Q, 2013b. A remote sensing urban ecological index and its application[J]. Acta Ecologica Sinica, 33(24): 7853-7862. | |
| [29] | 杨超, 2020. 遥感视角下的粤港澳大湾区城市化进程及其生态质量演变[D]. 深圳: 深圳大学. |
| YANG C, 2020. Urbanization process and eco-environmental quality evolution in Guangdong-Hong Kong-Macao Greater Bay Area: A remote sensing perspective[D]. Shenzhen: Shenzhen University. | |
| [30] | 杨雪锋, 周懿, 2018. 生态城市评价研究进展[J]. 标准科学 (11): 32-38. |
| YANG X F, ZHOU Y, 2018. Review on the progress of eco-cities evaluation research[J]. Standard Science (11): 32-38. | |
| [31] |
于贵瑞, 王永生, 杨萌, 2022. 生态系统质量及其状态演变的生态学理论和评估方法之探索[J]. 应用生态学报, 33(4): 865-877.
DOI |
| YU G R, WANG Y S, YANG M, 2022. Discussion on the ecological theory and assessment methods of ecosystem quality and its evolution[J]. Chinese Journal of Applied Ecology, 33(4): 865-877. | |
| [32] | 张永彬, 张阔, 满卫东, 等, 2021. 基于遥感指标的深圳市生态环境质量动态研究[J]. 环境污染与防治, 43(7): 909-914, 929. |
| ZHANG Y B, ZHANG K, MAN W D, et al., 2021. Dynamic research on the ecological environment quality of Shenzhen based on remote sensing indicator[J]. Environmental Pollution & Control, 43(7): 909-914, 929. | |
| [33] | 张洁, 2022. 珠三角城市群生态环境状况遥感评价研究[D]. 广州: 华南农业大学. |
| ZHANG J, 2022. Remote sensing evaluation on ecological environment in Pearl River Delta City Cluster[D]. Guangzhou: South China Agricultural University. | |
| [34] | 郑华健, 2019. 基于多时相遥感生态指数的粤港澳大湾区生态环境变化研究[J]. 地理科学研究, 8(3): 243-250. |
| ZHENG H J, 2019. Ecological environment changing research based on multi-temporal remote sensing ecological index of Guangdong-Hong Kong-Macao Greater Bay Area[J]. Geographical Science Research, 8(3): 243-250. | |
| [35] | 中国地图出版社, 2017. 中华人民共和国土地覆被地图集[M]. 北京: 中国地图出版社:70. |
| China Cartographic Publishing House, 2017. Land cover atlas of the People’s Republic of China[M]. Beijing: China Cartographic Publishing House:70. | |
| [36] | 钟舒怡, 2020. 粤港澳大湾区城市扩张特征分析及生态环境质量评价[D]. 昆明理工大学. |
| ZHONG S Y, 2020. Analysis of urban expansion characteristics and ecological environment quality assessment in the Guangdong-Hong Kong-Macao Greater Bay Area[D]. Kunming University of Science and Technology. |
| [1] | 陈洁茹, 叶长盛, 魏嶶, 蔡鑫, 汪礼丽. 环鄱阳湖城市群县域“三生空间”耦合协调性及影响因素分析[J]. 生态环境学报, 2025, 34(5): 807-818. |
| [2] | 张维琛, 王惺琪, 王博杰. 塔布河流域生态系统服务时空格局及影响因素分析[J]. 生态环境学报, 2024, 33(7): 1142-1152. |
| [3] | 徐佳乐, 杨兴川, 赵文吉, 杨志强, 钟一雪, 师乐颜, 马鹏飞. 气候变化背景下内蒙古中西部植被覆盖度演变特征研究[J]. 生态环境学报, 2024, 33(7): 1008-1018. |
| [4] | 陈晓辉, 胡喜生. 耦合ER和GWR的福州市生态环境质量的驱动力分析[J]. 生态环境学报, 2024, 33(5): 812-823. |
| [5] | 胡盈盈, 罗红霞, 戴声佩, 禹萱, 邓春梅, 李海亮, 梁伟红, 郑倩. 基于遥感生态指数的海南五指山市生态环境质量评价及成因分析[J]. 生态环境学报, 2024, 33(10): 1624-1633. |
| [6] | 胡韵菲, 陶亮, 罗旖文. 广东省农业绿色发展潜力影响因素及空间格局演变[J]. 生态环境学报, 2024, 33(10): 1600-1611. |
| [7] | 冯自贤, 佘璐, 王秀慧, 杨璐, 杨晨. 基于改进遥感生态指数的宁夏生态环境质量时空变化[J]. 生态环境学报, 2024, 33(1): 131-143. |
| [8] | 肖博, 王邵军, 解玲玲, 王郑钧, 郭志鹏, 张昆凤, 张路路, 樊宇翔, 郭晓飞, 罗双, 夏佳慧, 李瑞, 兰梦杰, 杨胜秋. 蚂蚁筑巢定居活动对热带森林土壤氮库及组分分配的影响[J]. 生态环境学报, 2023, 32(6): 1026-1036. |
| [9] | 夏美君, 李健, 闫永蚕. 京津冀城市群生态福利绩效时空格局及演进特征[J]. 生态环境学报, 2023, 32(4): 814-824. |
| 阅读次数 | ||||||
|
全文 |
|
|||||
|
摘要 |
|
|||||