生态环境学报 ›› 2025, Vol. 34 ›› Issue (8): 1293-1304.DOI: 10.16258/j.cnki.1674-5906.2025.08.014
冯珊珊1( ), 陶亮2, 梁俊芬1,*()
收稿日期:2025-02-18
出版日期:2025-08-18
发布日期:2025-08-01
通讯作者:
*E-mail: 作者简介:冯珊珊(1994年生),女,助理研究员,博士,主要从事农业地理与遥感应用研究。E-mail: fengshanshan@gdaas.cn
基金资助:
FENG Shanshan1(), TAO Liang2, LIANG Junfen1,*()
Received:2025-02-18
Online:2025-08-18
Published:2025-08-01
摘要:
基于1992-2023年广东省县域面板数据,综合运用基尼系数、空间自相关分析及GIS技术,系统揭示蔬菜生产集聚的时空演化规律及其驱动机制。结果发现:1)时间维度上,蔬菜生产经历了从小规模、分散生产逐渐转向规模化、区域化和专业化生产的发展历程,蔬菜生产集聚程度总体呈上升趋势并具有“分散-稳定-集中”的阶段性特征;2)空间格局上,2005年后蔬菜生产形成三大核心集聚区:珠三角“增城-博罗-惠城”设施蔬菜高值集聚区、粤西以高州为中心的冬种北运连片集聚区、粤北“连州-阳山”高山夏秋蔬菜集聚区;3)驱动机制分析显示,资源禀赋构成空间集聚的自然基底,产业政策发挥重要驱动作用,地理标志促成品牌溢价,市场需求提供核心驱动力。研究构建了“时空演化-驱动机制-政策响应”的理论分析框架,提出“三区协同”发展战略:在珠三角侧重高附加值设施蔬菜与智慧农业融合、粤西重点打造“冬种北运”规模化生产基地、粤北培育高山夏秋蔬菜供应基地,通过要素整合、政策赋能、品牌增值和市场拓展四维联动推动蔬菜产业集群规模能级跃升。研究成果为粤港澳大湾区“菜篮子”工程提供空间优化方案,对同类地区农业产业集群发展具有重要借鉴价值。
中图分类号:
冯珊珊, 陶亮, 梁俊芬. 高质量发展视角下县域农业产业集聚的时空演化与驱动机制——以广东省蔬菜生产为例[J]. 生态环境学报, 2025, 34(8): 1293-1304.
FENG Shanshan, TAO Liang, LIANG Junfen. Spatiotemporal Evolution and Driving Mechanisms of County-Level Agricultural Industry Agglomeration under High-Quality Development: A Case Study of Vegetable Production in Guangdong Province[J]. Ecology and Environmental Sciences, 2025, 34(8): 1293-1304.
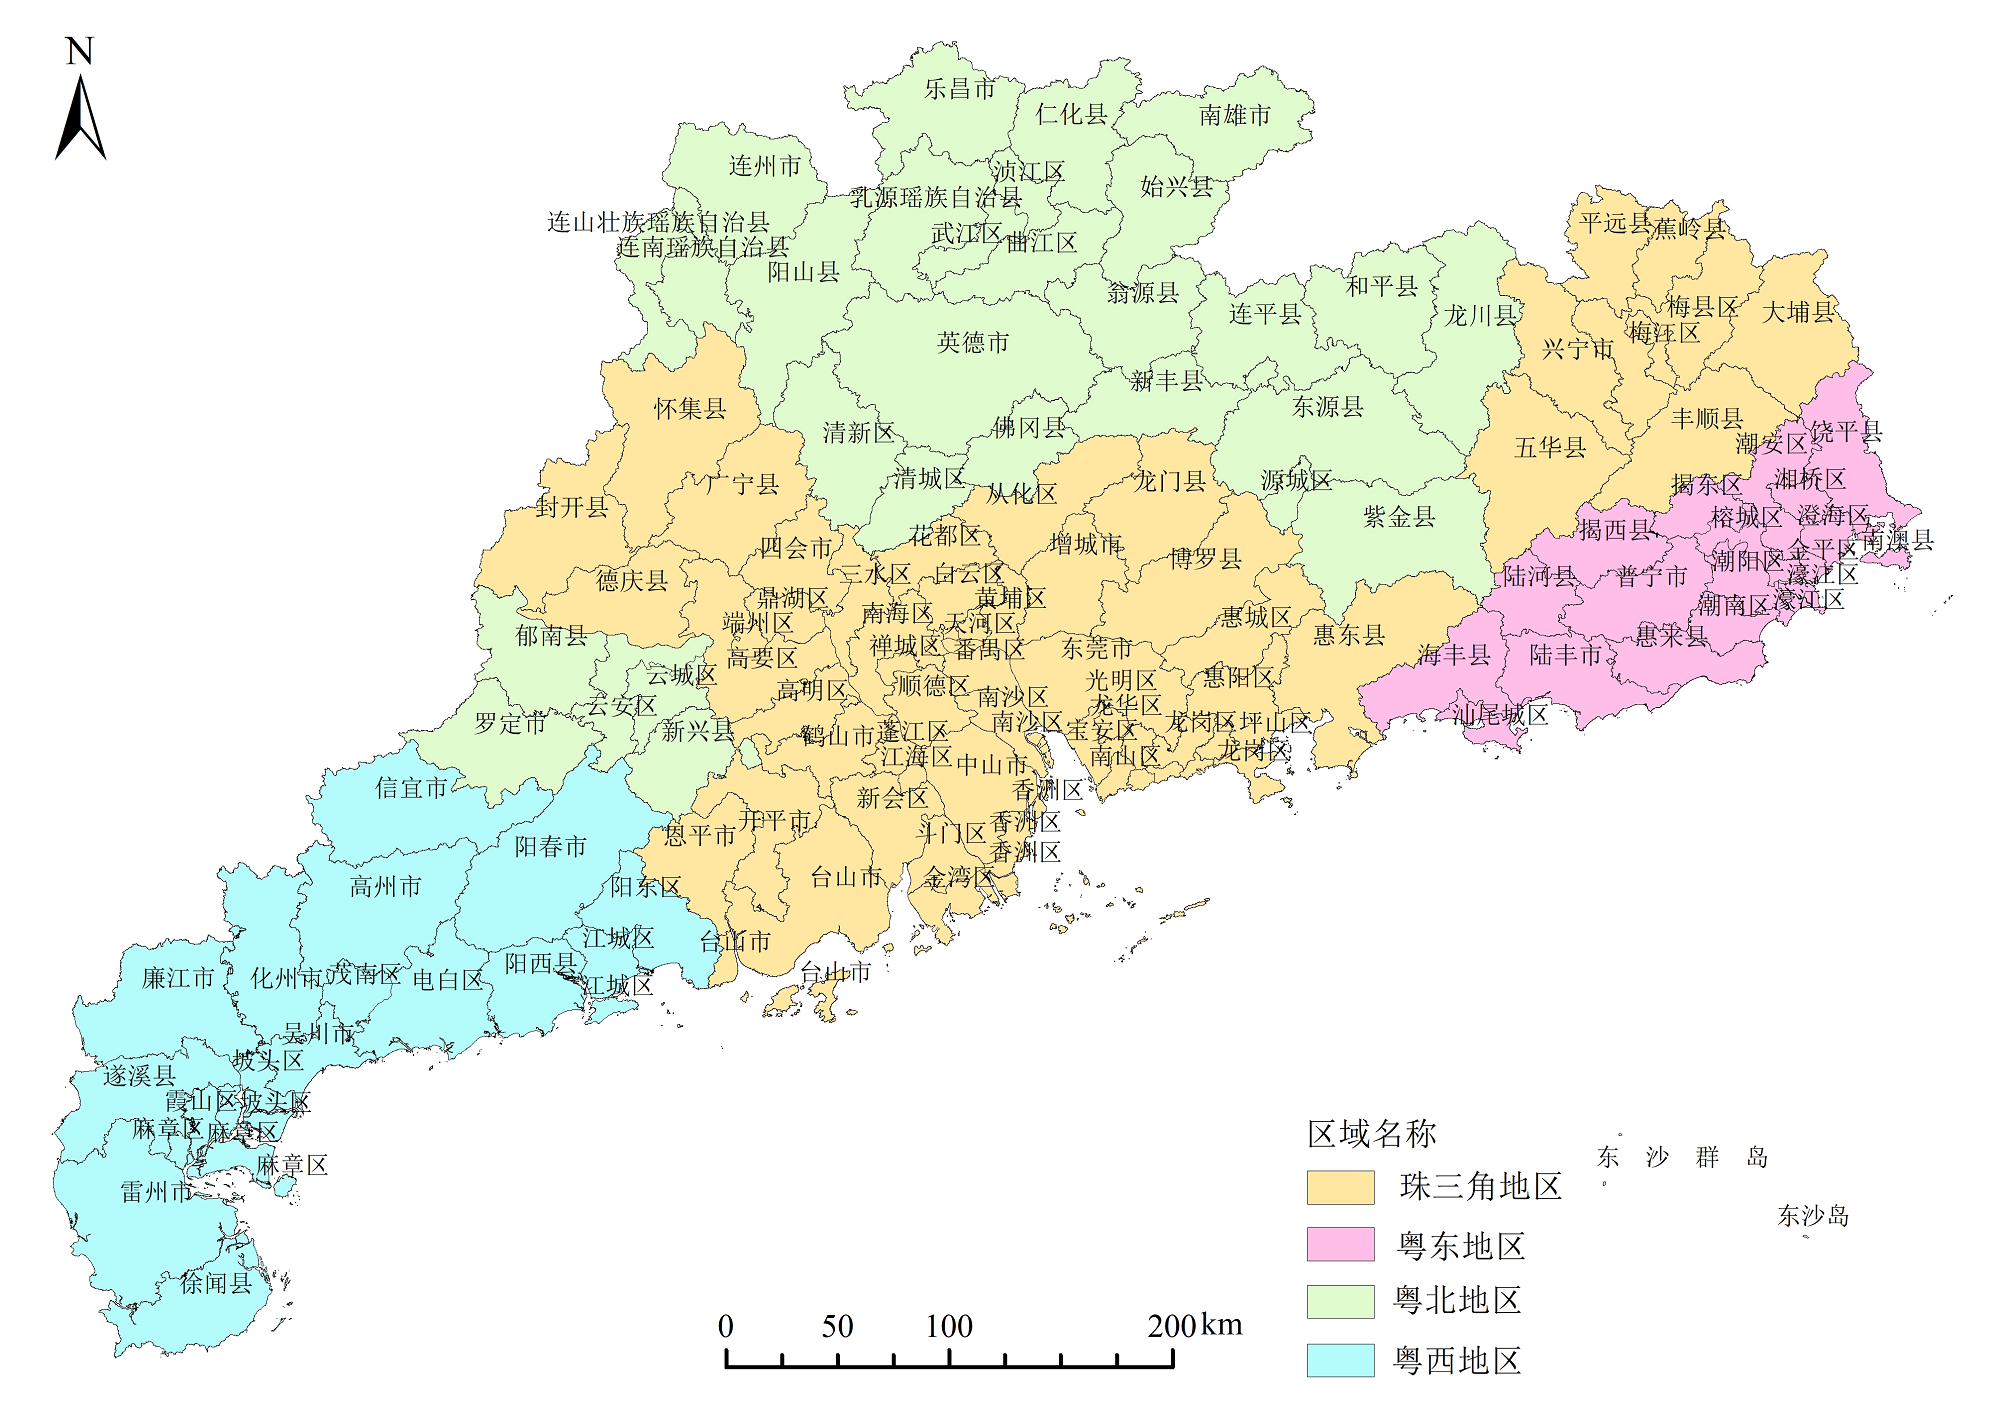
图1 广东省行政区划图 本图边界基于广东省标准地图服务网站获取审图号:粤S(2020)102号的标准地图制作,底图未作任何修改。本图界线不作为权属争议的依据
Figure 1 Administrative map of Guangdong Province
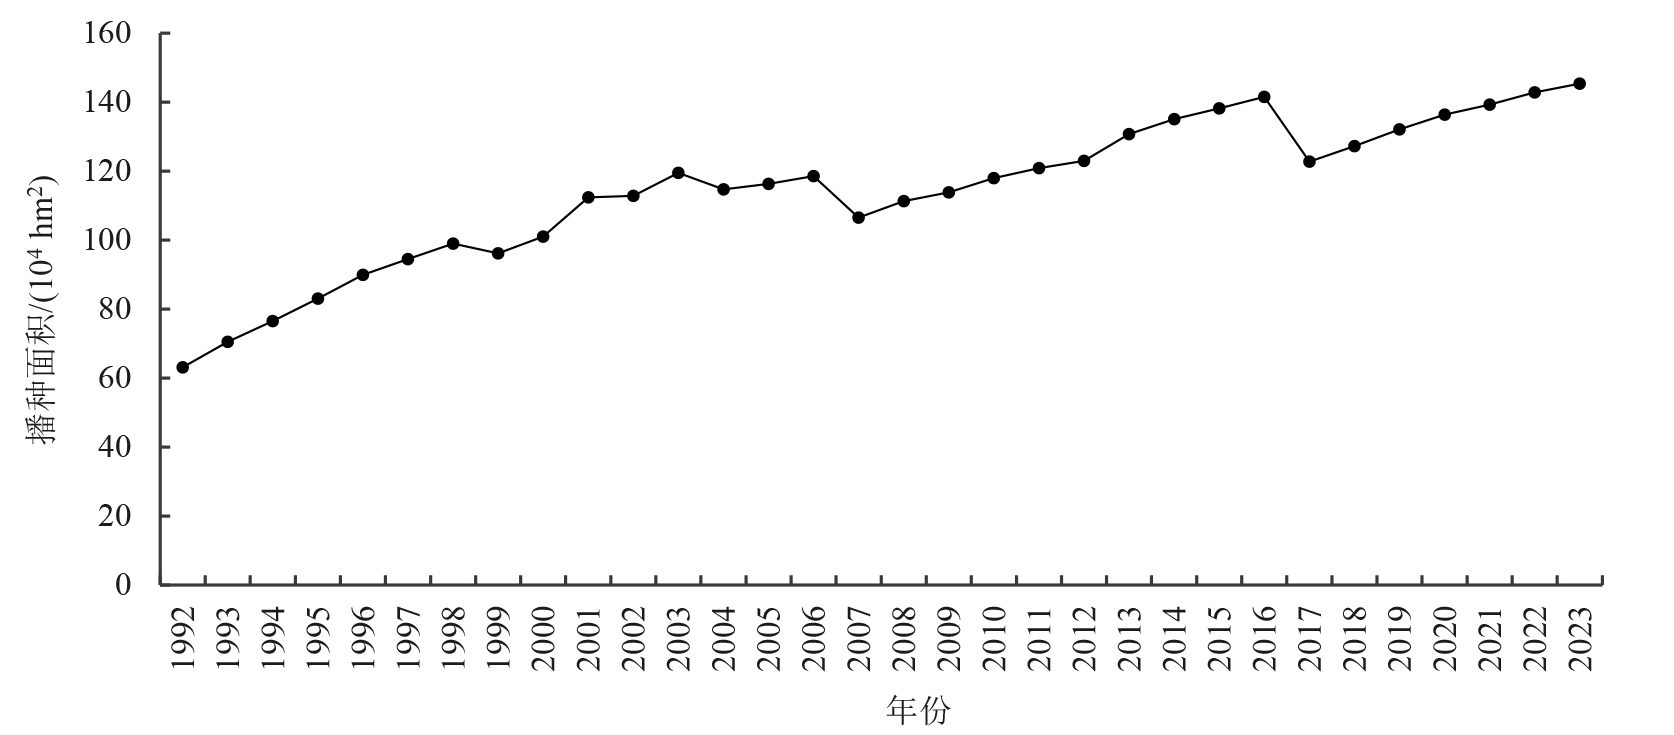
图2 1992-2023年广东省蔬菜生产变化情况
Figure 2 Changes in vegetable production in Guangdong Province from 1992 to 2023
| 播种面积/ (104 hm2) | 1992年 | 1998年 | 2006年 | 2016年 | 2023年 | |||||||||
|---|---|---|---|---|---|---|---|---|---|---|---|---|---|---|
| 个数 | 比例/% | 个数 | 比例/% | 个数 | 比例/% | 个数 | 比例/% | 个数 | 比例/% | |||||
| ≥2.0 | 2 | 1.61 | 10 | 8.06 | 19 | 15.32 | 21 | 16.94 | 24 | 19.35 | ||||
| 1.5-2.0 | 4 | 3.23 | 7 | 5.65 | 16 | 12.90 | 15 | 12.10 | 8 | 6.45 | ||||
| 1.0-1.5 | 9 | 7.26 | 25 | 20.16 | 15 | 12.10 | 14 | 11.29 | 21 | 16.94 | ||||
| 0.5-1.0 | 39 | 31.45 | 28 | 22.58 | 32 | 25.81 | 33 | 26.61 | 30 | 24.19 | ||||
| 0.3-0.5 | 14 | 11.29 | 16 | 12.90 | 13 | 10.48 | 13 | 10.48 | 12 | 9.68 | ||||
| <0.3 | 56 | 45.16 | 38 | 30.65 | 29 | 23.39 | 28 | 22.58 | 29 | 23.39 | ||||
表1 1992、1998、2006、2016、2023年广东省县域蔬菜播种面积统计
Table 1 Statistics of vegetable sowing area in counties of Guangdong Province in 1992, 1998, 2006, 2016, and 2023
| 播种面积/ (104 hm2) | 1992年 | 1998年 | 2006年 | 2016年 | 2023年 | |||||||||
|---|---|---|---|---|---|---|---|---|---|---|---|---|---|---|
| 个数 | 比例/% | 个数 | 比例/% | 个数 | 比例/% | 个数 | 比例/% | 个数 | 比例/% | |||||
| ≥2.0 | 2 | 1.61 | 10 | 8.06 | 19 | 15.32 | 21 | 16.94 | 24 | 19.35 | ||||
| 1.5-2.0 | 4 | 3.23 | 7 | 5.65 | 16 | 12.90 | 15 | 12.10 | 8 | 6.45 | ||||
| 1.0-1.5 | 9 | 7.26 | 25 | 20.16 | 15 | 12.10 | 14 | 11.29 | 21 | 16.94 | ||||
| 0.5-1.0 | 39 | 31.45 | 28 | 22.58 | 32 | 25.81 | 33 | 26.61 | 30 | 24.19 | ||||
| 0.3-0.5 | 14 | 11.29 | 16 | 12.90 | 13 | 10.48 | 13 | 10.48 | 12 | 9.68 | ||||
| <0.3 | 56 | 45.16 | 38 | 30.65 | 29 | 23.39 | 28 | 22.58 | 29 | 23.39 | ||||

图3 1992-2023年广东省县域蔬菜播种面积时空变化 本图边界基于广东省标准地图服务网站获取审图号:粤S(2020)102号的标准地图制作,底图未作任何修改。本图界线不作为权属争议的依据
Figure 3 Spatial-temporal Changes of vegetable sowing area in Guangdong Province in 1992?2023
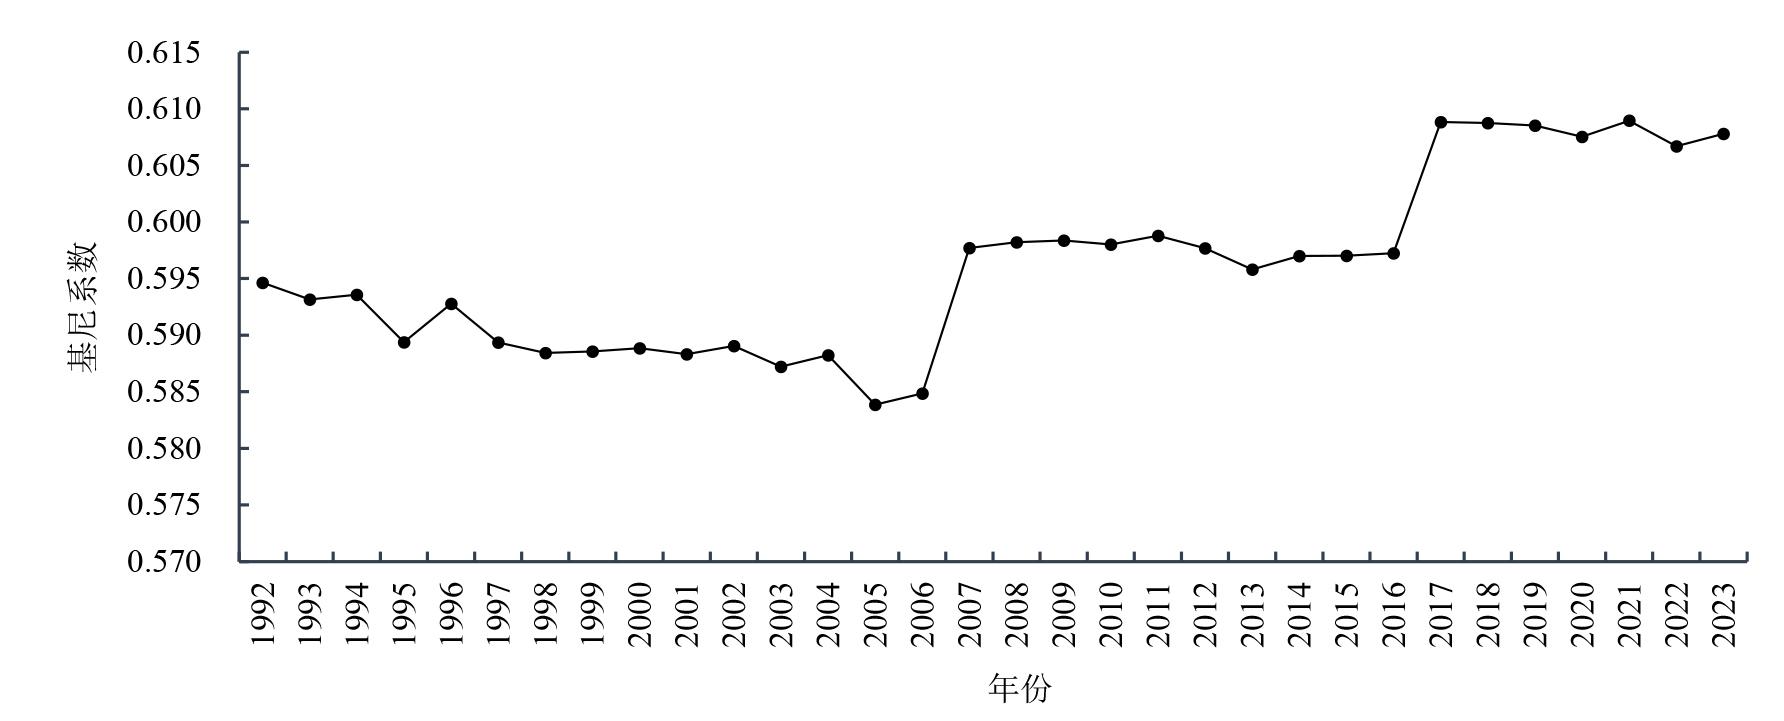
图4 1992-2023年广东省蔬菜生产基尼系数变化趋势
Figure 4 Trend of Gini coefficient changes in vegetable production in Guangdong Province from 1992 to 2023
| 年份 | 莫兰指数 | 期望值 | 方差 | Z得分 | p值 | 显著性水平 |
|---|---|---|---|---|---|---|
| 1992 | 0.0658 | −0.0081 | 0.0035 | 1.2400 | 0.2151 | - |
| 1993 | 0.0371 | −0.0081 | 0.0036 | 0.7501 | 0.4532 | - |
| 1994 | 0.0421 | −0.0081 | 0.0036 | 0.8376 | 0.4022 | - |
| 1995 | 0.0358 | −0.0081 | 0.0036 | 0.7293 | 0.4658 | - |
| 1996 | 0.0405 | −0.0081 | 0.0036 | 0.8052 | 0.4207 | - |
| 1997 | 0.0368 | −0.0081 | 0.0036 | 0.7444 | 0.4566 | - |
| 1998 | 0.0367 | −0.0081 | 0.0037 | 0.7401 | 0.4593 | - |
| 1999 | 0.0235 | −0.0081 | 0.0037 | 0.5216 | 0.6020 | - |
| 2000 | 0.0320 | −0.0081 | 0.0037 | 0.6633 | 0.5071 | - |
| 2001 | 0.0123 | −0.0081 | 0.0036 | 0.3374 | 0.7358 | - |
| 2002 | 0.0121 | −0.0081 | 0.0036 | 0.3333 | 0.7389 | - |
| 2003 | 0.0673 | −0.0081 | 0.0036 | 1.2499 | 0.2114 | - |
| 2004 | 0.0799 | −0.0081 | 0.0036 | 1.4592 | 0.1445 | - |
| 2005 | 0.1057 | −0.0081 | 0.0036 | 1.8833 | 0.0597 | 10% |
| 2006 | 0.1129 | −0.0081 | 0.0036 | 2.0044 | 0.0450 | 5% |
| 2007 | 0.1101 | −0.0081 | 0.0036 | 1.9562 | 0.0504 | 10% |
| 2008 | 0.1110 | −0.0081 | 0.0037 | 1.9707 | 0.0488 | 5% |
| 2009 | 0.1156 | −0.0081 | 0.0037 | 2.0468 | 0.0407 | 5% |
| 2010 | 0.1293 | −0.0081 | 0.0037 | 2.2713 | 0.0231 | 5% |
| 2011 | 0.1328 | −0.0081 | 0.0037 | 2.3283 | 0.0199 | 5% |
| 2012 | 0.1408 | −0.0081 | 0.0037 | 2.4605 | 0.0139 | 5% |
| 2013 | 0.1672 | −0.0081 | 0.0037 | 2.8968 | 0.0038 | 1% |
| 2014 | 0.1843 | −0.0081 | 0.0037 | 3.1819 | 0.0015 | 1% |
| 2015 | 0.1977 | −0.0081 | 0.0037 | 3.4044 | 0.0007 | 1% |
| 2016 | 0.2005 | −0.0081 | 0.0037 | 3.4504 | 0.0006 | 1% |
| 2017 | 0.2418 | −0.0081 | 0.0037 | 4.1363 | 0.0000 | 1% |
| 2018 | 0.2454 | −0.0081 | 0.0037 | 4.1935 | 0.0000 | 1% |
| 2019 | 0.2507 | −0.0081 | 0.0037 | 4.2804 | 0.0000 | 1% |
| 2020 | 0.2533 | −0.0081 | 0.0037 | 4.3213 | 0.0000 | 1% |
| 2021 | 0.2589 | −0.0081 | 0.0037 | 4.4144 | 0.0000 | 1% |
| 2022 | 0.2667 | −0.0081 | 0.0037 | 4.5399 | 0.0000 | 1% |
| 2023 | 0.2679 | −0.0081 | 0.0037 | 4.5401 | 0.0000 | 1% |
表2 1992-2023年广东省县域蔬菜生产莫兰指数
Table 2 Moran’s I of vegetable production in Guangdong Province from 1992 to 2023
| 年份 | 莫兰指数 | 期望值 | 方差 | Z得分 | p值 | 显著性水平 |
|---|---|---|---|---|---|---|
| 1992 | 0.0658 | −0.0081 | 0.0035 | 1.2400 | 0.2151 | - |
| 1993 | 0.0371 | −0.0081 | 0.0036 | 0.7501 | 0.4532 | - |
| 1994 | 0.0421 | −0.0081 | 0.0036 | 0.8376 | 0.4022 | - |
| 1995 | 0.0358 | −0.0081 | 0.0036 | 0.7293 | 0.4658 | - |
| 1996 | 0.0405 | −0.0081 | 0.0036 | 0.8052 | 0.4207 | - |
| 1997 | 0.0368 | −0.0081 | 0.0036 | 0.7444 | 0.4566 | - |
| 1998 | 0.0367 | −0.0081 | 0.0037 | 0.7401 | 0.4593 | - |
| 1999 | 0.0235 | −0.0081 | 0.0037 | 0.5216 | 0.6020 | - |
| 2000 | 0.0320 | −0.0081 | 0.0037 | 0.6633 | 0.5071 | - |
| 2001 | 0.0123 | −0.0081 | 0.0036 | 0.3374 | 0.7358 | - |
| 2002 | 0.0121 | −0.0081 | 0.0036 | 0.3333 | 0.7389 | - |
| 2003 | 0.0673 | −0.0081 | 0.0036 | 1.2499 | 0.2114 | - |
| 2004 | 0.0799 | −0.0081 | 0.0036 | 1.4592 | 0.1445 | - |
| 2005 | 0.1057 | −0.0081 | 0.0036 | 1.8833 | 0.0597 | 10% |
| 2006 | 0.1129 | −0.0081 | 0.0036 | 2.0044 | 0.0450 | 5% |
| 2007 | 0.1101 | −0.0081 | 0.0036 | 1.9562 | 0.0504 | 10% |
| 2008 | 0.1110 | −0.0081 | 0.0037 | 1.9707 | 0.0488 | 5% |
| 2009 | 0.1156 | −0.0081 | 0.0037 | 2.0468 | 0.0407 | 5% |
| 2010 | 0.1293 | −0.0081 | 0.0037 | 2.2713 | 0.0231 | 5% |
| 2011 | 0.1328 | −0.0081 | 0.0037 | 2.3283 | 0.0199 | 5% |
| 2012 | 0.1408 | −0.0081 | 0.0037 | 2.4605 | 0.0139 | 5% |
| 2013 | 0.1672 | −0.0081 | 0.0037 | 2.8968 | 0.0038 | 1% |
| 2014 | 0.1843 | −0.0081 | 0.0037 | 3.1819 | 0.0015 | 1% |
| 2015 | 0.1977 | −0.0081 | 0.0037 | 3.4044 | 0.0007 | 1% |
| 2016 | 0.2005 | −0.0081 | 0.0037 | 3.4504 | 0.0006 | 1% |
| 2017 | 0.2418 | −0.0081 | 0.0037 | 4.1363 | 0.0000 | 1% |
| 2018 | 0.2454 | −0.0081 | 0.0037 | 4.1935 | 0.0000 | 1% |
| 2019 | 0.2507 | −0.0081 | 0.0037 | 4.2804 | 0.0000 | 1% |
| 2020 | 0.2533 | −0.0081 | 0.0037 | 4.3213 | 0.0000 | 1% |
| 2021 | 0.2589 | −0.0081 | 0.0037 | 4.4144 | 0.0000 | 1% |
| 2022 | 0.2667 | −0.0081 | 0.0037 | 4.5399 | 0.0000 | 1% |
| 2023 | 0.2679 | −0.0081 | 0.0037 | 4.5401 | 0.0000 | 1% |

图5 2005-2023年广东省县域蔬菜生产地理集聚的空间变化 本图边界基于广东省标准地图服务网站下载审图号:粤S(2020)102号的标准地图制作,底图未作任何修改。本图界线不作为权属争议的依据
Figure 5 Spatial Changes in geographical agglomeration of vegetable production in Guangdong Province from 2005 to 2023
| 序号 | 地区 | 产业园蔬菜 类型 | 序号 | 地区 | 产业园蔬菜类型 |
|---|---|---|---|---|---|
| 1 | 广州市增城区 | 迟菜心 | 16 | 汕尾市海丰县 | 蔬菜 |
| 2 | 广州市增城区 | 菜稻轮作 | 17 | 韶关市乳源县 | 蔬菜 |
| 3 | 广州市白云区 | 设施蔬菜 | 18 | 韶关市武江区 | 蔬菜 |
| 4 | 惠州市博罗县 | 蔬菜 | 19 | 韶关市新丰县 | 蔬菜 |
| 5 | 惠州市惠东县 | 蔬菜 | 20 | 韶关市乐昌市 | 香芋 |
| 6 | 惠州市惠阳区 | 蔬菜 | 21 | 韶关市始兴县 | 蔬菜 |
| 7 | 肇庆市怀集县 | 蔬菜 | 22 | 韶关市曲江区 | 食用菌 |
| 8 | 湛江市坡头区 | 莲藕 | 23 | 韶关市武江区 | 食用菌 |
| 9 | 湛江市徐闻县 | 玉米 | 24 | 梅州市梅江区 | 蔬菜 |
| 10 | 清远市连州市 | 菜心 | 25 | 梅州市丰顺县 | 特色蔬菜 |
| 11 | 清远市阳山县 | 蔬菜 | 26 | 梅州市五华县 | 蔬菜 |
| 12 | 清远市英德市 | 连樟村果菜茶 | 27 | 汕头市澄海区 | 蔬菜 |
| 13 | 清远市英德市 | 西牛麻竹笋 | 28 | 揭阳市揭东区 | 竹笋 |
| 14 | 河源市源城区 | 蔬菜 | 29 | 揭阳市揭西县 | 苦笋 |
| 15 | 汕尾市陆丰市 | 萝卜 | 30 | 揭阳市普宁市 | 稻蔬 |
表3 2018-2023年创建的蔬菜类省级现代农业产业园
Table 3 Provincial-level modern agricultural industrial park for vegetables created from 2018 to 2023
| 序号 | 地区 | 产业园蔬菜 类型 | 序号 | 地区 | 产业园蔬菜类型 |
|---|---|---|---|---|---|
| 1 | 广州市增城区 | 迟菜心 | 16 | 汕尾市海丰县 | 蔬菜 |
| 2 | 广州市增城区 | 菜稻轮作 | 17 | 韶关市乳源县 | 蔬菜 |
| 3 | 广州市白云区 | 设施蔬菜 | 18 | 韶关市武江区 | 蔬菜 |
| 4 | 惠州市博罗县 | 蔬菜 | 19 | 韶关市新丰县 | 蔬菜 |
| 5 | 惠州市惠东县 | 蔬菜 | 20 | 韶关市乐昌市 | 香芋 |
| 6 | 惠州市惠阳区 | 蔬菜 | 21 | 韶关市始兴县 | 蔬菜 |
| 7 | 肇庆市怀集县 | 蔬菜 | 22 | 韶关市曲江区 | 食用菌 |
| 8 | 湛江市坡头区 | 莲藕 | 23 | 韶关市武江区 | 食用菌 |
| 9 | 湛江市徐闻县 | 玉米 | 24 | 梅州市梅江区 | 蔬菜 |
| 10 | 清远市连州市 | 菜心 | 25 | 梅州市丰顺县 | 特色蔬菜 |
| 11 | 清远市阳山县 | 蔬菜 | 26 | 梅州市五华县 | 蔬菜 |
| 12 | 清远市英德市 | 连樟村果菜茶 | 27 | 汕头市澄海区 | 蔬菜 |
| 13 | 清远市英德市 | 西牛麻竹笋 | 28 | 揭阳市揭东区 | 竹笋 |
| 14 | 河源市源城区 | 蔬菜 | 29 | 揭阳市揭西县 | 苦笋 |
| 15 | 汕尾市陆丰市 | 萝卜 | 30 | 揭阳市普宁市 | 稻蔬 |
| 序号 | 产品名称 | 地区 | 序号 | 产品名称 | 地区 |
|---|---|---|---|---|---|
| 1 | 增城迟菜心 | 广州市增城区 | 17 | 西牛麻竹笋 | 清远市英德市 |
| 2 | 派潭凉粉草 | 广州市增城区 | 18 | 阳山淮山 | 清远市阳山县 |
| 3 | 庙南粉葛 | 广州市南沙区 | 19 | 阳山西洋菜 | 清远市阳山县 |
| 4 | 新垦莲藕 | 广州市南沙区 | 20 | 连州菜心 | 清远市连州市 |
| 5 | 炭步槟榔香芋 | 广州市花都区 | 21 | 星子红葱 | 清远市连州市 |
| 6 | 合水粉葛 | 佛山市高明区 | 22 | 连山大肉姜 | 清远市连山县 |
| 7 | 三水黑皮冬瓜 | 佛山市三水区 | 23 | 竹山粉葛 | 清远市佛冈县 |
| 8 | 矮陂梅菜 | 惠州市惠城区 | 24 | 北乡马蹄 | 韶关市乐昌市 |
| 9 | 福田菜心 | 惠州市博罗县 | 25 | 张溪香芋 | 韶关市乐昌市 |
| 10 | 杜阮凉瓜 | 江门市蓬江区 | 26 | 火山粉葛 | 韶关市曲江区 |
| 11 | 鹤山粉葛 | 江门市鹤山市 | 27 | 新丰佛手瓜 | 韶关市新丰县 |
| 12 | 恩平簕菜 | 江门市恩平市 | 28 | 三圳淮山 | 梅州市蕉岭县 |
| 13 | 甜水萝卜 | 江门市新会区 | 29 | 蕉岭冬笋 | 梅州市蕉岭县 |
| 14 | 活道粉葛 | 肇庆市高要区 | 30 | 高堂菜脯 | 潮州市饶平县 |
| 15 | 水东芥菜 | 茂名市电白区 | 31 | 埔田竹笋 | 揭阳市揭东区 |
| 16 | 徐闻良姜 | 湛江市徐闻县 | 32 | 吴厝淮山 | 揭阳市揭东区 |
| 33 | 虎噉金针菜 | 汕尾市海丰县 |
表4 广东省蔬菜类国家地理标志保护产品和农产品地理标志产品
Table 4 National geographical indication protection products for vegetables and geographical indication products for agricultural products in Guangdong Province
| 序号 | 产品名称 | 地区 | 序号 | 产品名称 | 地区 |
|---|---|---|---|---|---|
| 1 | 增城迟菜心 | 广州市增城区 | 17 | 西牛麻竹笋 | 清远市英德市 |
| 2 | 派潭凉粉草 | 广州市增城区 | 18 | 阳山淮山 | 清远市阳山县 |
| 3 | 庙南粉葛 | 广州市南沙区 | 19 | 阳山西洋菜 | 清远市阳山县 |
| 4 | 新垦莲藕 | 广州市南沙区 | 20 | 连州菜心 | 清远市连州市 |
| 5 | 炭步槟榔香芋 | 广州市花都区 | 21 | 星子红葱 | 清远市连州市 |
| 6 | 合水粉葛 | 佛山市高明区 | 22 | 连山大肉姜 | 清远市连山县 |
| 7 | 三水黑皮冬瓜 | 佛山市三水区 | 23 | 竹山粉葛 | 清远市佛冈县 |
| 8 | 矮陂梅菜 | 惠州市惠城区 | 24 | 北乡马蹄 | 韶关市乐昌市 |
| 9 | 福田菜心 | 惠州市博罗县 | 25 | 张溪香芋 | 韶关市乐昌市 |
| 10 | 杜阮凉瓜 | 江门市蓬江区 | 26 | 火山粉葛 | 韶关市曲江区 |
| 11 | 鹤山粉葛 | 江门市鹤山市 | 27 | 新丰佛手瓜 | 韶关市新丰县 |
| 12 | 恩平簕菜 | 江门市恩平市 | 28 | 三圳淮山 | 梅州市蕉岭县 |
| 13 | 甜水萝卜 | 江门市新会区 | 29 | 蕉岭冬笋 | 梅州市蕉岭县 |
| 14 | 活道粉葛 | 肇庆市高要区 | 30 | 高堂菜脯 | 潮州市饶平县 |
| 15 | 水东芥菜 | 茂名市电白区 | 31 | 埔田竹笋 | 揭阳市揭东区 |
| 16 | 徐闻良姜 | 湛江市徐闻县 | 32 | 吴厝淮山 | 揭阳市揭东区 |
| 33 | 虎噉金针菜 | 汕尾市海丰县 |
| [1] | ANSELIN L, 1995. Local indicators of spatial association-LISA[J]. Geographical Analysis, 27(2): 93-115. |
| [2] | ANSELIN L, GETIS A, 1992. Spatial statistical analysis and geographic information systems[J]. Annals of Regional Science, 26(1): 19-33. |
| [3] | CEI L, STEFANI G, DEFRANCESCO E, et al., 2018. Geographical indications: A first assessment of the impact on rural development in Italian NUTS3 regions[J]. Land Use Policy, 75: 620-630. |
| [4] | MORAN P, 1948. The interpretation of statistical maps[J]. Journal of the Royal Statistical Society (B), 10: 243-251. |
| [5] | 杜姗姗, 蔡建明, 郭华, 等, 2012. 食品安全导向下的都市农业发展模式——以北京蔬菜生产为例[J]. 地理科学进展, 31(6): 783-791. |
|
DU S S, CAI J M, GUO H, et al., 2012. Food security-oriented urban agriculture development typologies: A case study of vegetable production in peri-urban Beijing[J]. Progress in Geography, 31(6): 783-791.
DOI |
|
| [6] | 冯珊珊, 刘序, 梁俊芬, 等, 2023. 广东1992-2020年蔬菜生产时空变化特征分析[J]. 广东农业科学, 50(1): 50-59. |
| FENG S S, LIU X, LIANG J F, et al., 2023. Analysis on temporal and spatial characteristics of vegetable production in Guangdong Province from 1992 to 2020[J]. Guangdong Agricultural Sciences, 50(1): 50-59. | |
| [7] | 宫殿清, 王兆锋, 张镱锂, 2020. 2008-2018年拉萨市温室蔬菜地时空变化特征[J]. 农业工程学报, 36(13): 233-241. |
| GONG D Q, WANG Z F, ZHANG Y L, 2020. Spatial-temporal variation characteristics of greenhouse-vegetable land in Lhasa of Tibet from 2008 to 2018[J]. Transactions of the Chinese Society of Agricultural Engineering (Transactions of the CSAE), 36(13): 233-241. | |
| [8] | 黄坤明, 2025. 在广东省高质量发展大会上的讲话[EB/OL]. 广东省人民政府, [2025-03-09]. http://www.gd.gov.cn/gdywdt/gdyw/content/post_4663413.html. |
| HUANG K M, 2025. Speech at the Guangdong Province High - Quality Development Conference[EB/OL]. People’s Government of Guangdong Province, [2025-03-09]. http://www.gd.gov.cn/gdywdt/gdyw/content/post_4663413.html. | |
| [9] | 纪龙, 吴文劼, 2015. 我国蔬菜生产地理集聚的时空特征及影响因素[J]. 经济地理, 35(9): 141-148. |
| JI L, WU W J, 2015. Spatial-temporal characteristics and affecting factors of vegetable produce geographic agglomeration in China[J]. Economic Geography, 35(9): 141-148. | |
| [10] | 李艳梅, 孙焱鑫, 刘玉, 等, 2015. 京津冀地区蔬菜生产的时空分异及分区研究[J]. 经济地理, 35(1): 89-95. |
| LI Y M, SUN Y X, LIU Y, et al., 2015. Zoning of vegetable production in Beijing-Tianjin-Hebei Region at county level[J]. Economic Geography, 35(1): 89-95. | |
| [11] |
李裕瑞, 卜长利, 王鹏艳, 2021. 中国农产品地理标志的地域分异特征[J]. 自然资源学报, 36(4): 827-840.
DOI |
| LI Y R, BU C L, WANG P Y, 2021. Spatial pattern of agro-product geographical indications in China[J]. Journal of Natural Resources, 36(4): 827-840. | |
| [12] | 李岳云, 卢中华, 凌振春, 2007. 中国蔬菜生产区域化的演化与优化——基于31个省区的实证分析[J]. 经济地理, 27(2): 191-195. |
| LI Y Y, LU Z H, LING Z C, 2007. The evolution and optimization of vegetable productive regionalization in China: Positive analysis based on 31 provinces of China[J]. Economic Geography, 27(2): 191-195. | |
| [13] | 刘序, 冯珊珊, 胡韵菲, 等, 2023. 粤港澳大湾区蔬菜生产时空格局演变及其影响因素分析[J]. 广东农业科学, 50(1): 40-49. |
| LIU X, FENG S S, HU Y F, et al., 2023. Analysis of spatial-temporal pattern evolution and influencing factors of vegetable production in Guangdong-Hong Kong-Macao Greater Bay Area[J]. Guangdong Agricultural Sciences, 50(1): 40-49. | |
| [14] | 刘小燕, 金龙新, 皮向红, 等, 2018. 湖南省蔬菜产业时空分布特征及发展建议[J]. 湖南农业科学 (8): 100-104. |
| LIU X Y, JIN L X, PI X H, et al., 2018. Temporal and spatial distribution characteristics and development suggestions of vegetable industry in Hunan[J]. Hunan Agricultural Sciences (8): 100-104. | |
| [15] | 毛昭庆, 董晓波, 陈良正, 等, 2022. 云南省蔬菜产业发展的时空演变特征分析[J]. 湖北农业科学, 61(22): 99-104. |
| MAO Z Q, DONG X B, CHEN L Z, et al., 2022. Analysis on temporal and spatial evolution characteristics of vegetable industry development in Yunnan Province[J]. Hubei Agricultural Sciences, 61(22): 99-104. | |
| [16] | 苗晓颖, 胡继连, 王秀鹃, 2021. 山东蔬菜生产格局演变及空间集聚效应分析[J]. 山东农业科学, 53(9): 148-156. |
| MIAO X Y, HU J L, WANG X J, 2021. Evolution of vegetable production pattern and spatial agglomeration effects in Shandong Province[J]. Shandong Agricultural Sciences, 53(9): 148-156. | |
| [17] | 彭晖, 张嘉望, 李博阳, 2017. 我国农产品生产集聚的时空格局及影响因素——以蔬菜生产为例[J]. 西北农林科技大学学报(社会科学版), 17(6): 81-90. |
| PENG H, ZHANG J W, LI B Y, 2017. Spatial-temporal characteristics and affecting factors of agricultural production agglomeration in China[J]. Journal of Northwest A & F University (Social Science Edition), 17(6): 81-90. | |
| [18] |
商世民, 2016. 地理标志集群品牌对农产品产业集聚的影响——以湖北省为例[J]. 科技进步与对策, 33(23): 40-43.
DOI |
| SHANG S M, 2016. The effect of geographic indications cluster brand on agricultural products industrial agglomeration[J]. Science & Technology Progress and Policy, 33(23): 40-43. | |
| [19] | 田亚军, 朱孟帅, 周向阳, 等, 2022. 我国蔬菜生产布局演化及其影响因素分析[J]. 中国食物与营养, 28(11): 5-10. |
| TIAN Y J, ZHU M S, ZHOU X Y, et al., 2022. Evolution of Chinese vegetable production distribution and its influencing factors[J]. Food and Nutrition in China, 28(11): 5-10. | |
| [20] |
王弘儒, 秦文晋, 2023. 中国地理标志产品的空间分布与集聚特征研究[J]. 世界地理研究, 32(6): 157-166.
DOI |
|
WANG H R, QIN W J, 2023. Research on the spatial distribution and agglomeration characteristics of geographical indication products in China[J]. World Regional Studies, 32(6): 157-166.
DOI |
|
| [21] | 王静, 曾玉珍, 2017. 天津设施蔬菜种植户的生产决策行为及其影响因素分析[J]. 中国农业资源与区划, 38(8): 183-187. |
| WANG J, ZENG Y Z, 2017. Analysis on vegetable farmers’ decision-making and influencing factors[J]. Chinese Journal of Agricultural Resources and Regional Planning, 38(8): 183-187. | |
| [22] |
吴建寨, 沈辰, 王盛威, 等, 2015. 中国蔬菜生产空间集聚演变、机制、效应及政策应对[J]. 中国农业科学, 48(8): 1641-1649.
DOI |
| WU J Z, SHEN C, WANG S W, et al., 2015. Spatial evolution, mechanism, effect and policies of vegetable production agglomeration in China[J]. Scientia Agricultura Sinica, 48(8): 1641-1649. | |
| [23] |
谢永顺, 王成金, 吴爱玲, 2022. 地理标志农产品和农业经济的时空演变及交互响应[J]. 地理科学, 42(9): 1577-1587.
DOI |
| XIE Y S, WANG C J, WU A L, 2022. Spatiotemporal evolution and interactive effects of geographical indication agricultural products and agricultural economy[J]. Scientia Geographica Sinica, 42(9): 1577-587. | |
| [24] |
徐广才, 李春媛, 张蕊, 等, 2019. 北京市蔬菜专业村发展时空动态研究[J]. 中国农学通报, 35(20): 158-164.
DOI |
| XU G C, LI C Y, ZHANG R, et al., 2019. Spatial-temporal analysis of vegetable specialty village development in Beijing[J]. Chinese Agriculture Science Bulletin, 35(20): 158-164. | |
| [25] | 余超然, 李嘉炜, 宋钊, 等, 2021. 基于县域尺度的茂名蔬菜产地专业化及集聚化程度分析[J]. 广东农业科学, 48(9): 157-164. |
| YU C R, LI J W, SONG Z, et al., 2021. Analysis on the degree of specialization and aggregation of vegetable production areas in Maoming based on county scale[J]. Guangdong Agricultural Sciences, 48(9): 157-164. | |
| [26] | 于丽艳, 穆月英, 2019. 蔬菜生产区域变迁、差异分解及其成因[J]. 华南理工大学学报(社会科学版), 21(3): 39-49. |
| YU L Y, MU Y Y, 2019. Regional changes, differences and influencing factors of vegetable production[J]. Journal of South China University of Technology (Social Science Edition), 21(3): 39-49. | |
| [27] | 于丽艳, 穆月英, 侯玲玲, 等, 2022. 县域农业生产集聚形成的影响因素——以环渤海区域蔬菜生产为例[J]. 中国农业大学学报, 27(8): 303-312. |
| YU L Y, MU Y Y, HOU L L, et al., 2022. Influencing factors of the formation of agricultural production agglomeration in counties: Taking vegetable production in the Bohai Rim Region as an example[J]. Journal of China Agricultural University, 27(8): 303-312. | |
| [28] | 张建华, 2007. 一种简便易用的基尼系数计算方法[J]. 山西农业大学学报社会科学版, 6(3): 275-283. |
| ZHANG J H, 2007. An convenient method to calculate gini coefficient[J]. Journal of Shanxi Agricultural University (Social Science Edition), 6(3): 275-283. | |
| [29] | 张倩, 平阳, 于峰, 等, 2020. 京津冀地区蔬菜生产空间集聚演变分析[J]. 中国农业资源与区划, 41(7): 94-101. |
| ZHANG Q, PING Y, YU F, et al., 2020. Spatial agglomeration evolution analysis of vegetable production in Beijing-Tianjing-Hebei Region[J]. Chinese Journal of Agricultural Resources and Regional Planning, 41(7): 94-101. | |
| [30] | 张哲晰, 穆月英, 潘彪, 2023. 产业集聚推动农业高质量生产的机制研究: 来自专业村的证据[J]. 宏观质量研究, 11(4): 119-128. |
| ZHANG Z X, MU Y Y, PAN B, 2023. Research on the mechanism of industrial agglomeration promoting high quality agricultural production: Evidence from specialized villages[J]. Journal of Macro-quality Research, 11(4): 119-128. | |
| [31] | 周应恒, 吕超, 周德, 2012. 我国蔬菜主产地形成的影响因素——以山东寿光为例[J]. 地理研究, 31(4): 687-700. |
| ZHOU Y H, LÜ C, ZHOU D, 2012. Analysis of the influencing factors of the formation of main vegetable production areas in China: A case study of Shouguang in Shandong Province[J]. Geographical Research, 31(4): 687-700. | |
| [32] | 朱大威, 朱方林, 2019. 基于GIS的江苏省蔬菜种植土地适宜性评价及其空间异质性分析[J]. 南方农业学报, 50(8): 1878-1884. |
| ZHU D W, ZHU F L, 2019. Suitability evaluation and spatial heterogeneity analysis of vegetable planting land in Jiangsu Province based on GIS[J]. Journal of Southern Agriculture, 50(8): 1878-1884. |
| [1] | 陈鹏, 马育军, 张梦雅, 陈婉婷, 江晓鹏. 基于kNDVI的广东省植被动态变化分析[J]. 生态环境学报, 2025, 34(4): 499-510. |
| [2] | 向男, 王明旭, 张宏锋, 廖宝淦. 生态保护重要性分区及其长时间序列生境状况时空分异研究——以广东省为例[J]. 生态环境学报, 2024, 33(6): 958-968. |
| [3] | 何沐全, 石艳军, 王晨茜, 罗祖红, 张少通. 广东省植被生态质量演变与气象条件贡献分析[J]. 生态环境学报, 2024, 33(5): 679-688. |
| [4] | 宁健, 程晓波, 苏超丽, 汤泽平, 余泽峰. 广东省伴生放射性矿周围土壤放射性水平分析[J]. 生态环境学报, 2023, 32(9): 1692-1699. |
| [5] | 鲁言波, 陈湛峰, 李彤. 基于改进TOPSIS模型的广东省主要湖库水质特征分析[J]. 生态环境学报, 2023, 32(12): 2194-2206. |
| [6] | 樊艳翔, 雷社平, 解建仓. 广东省河流水体富营养化综合评价及分异特征——基于博弈论组合赋权法与VIKOR模型[J]. 生态环境学报, 2023, 32(10): 1811-1821. |
| [7] | 王晨茜, 张琼锐, 张若琪, 孙学超, 徐颂军. 广东省珠江流域景观格局对水质净化服务的影响[J]. 生态环境学报, 2022, 31(7): 1425-1433. |
| [8] | 刘香华, 王秀明, 刘谞承, 张音波, 刘飘. 基于外溢生态系统服务价值的广东省生态补偿机制研究[J]. 生态环境学报, 2022, 31(5): 1024-1031. |
| [9] | 黄巧义, 于俊红, 黄建凤, 黄旭, 李苹, 付弘婷, 唐拴虎, 刘一锋, 徐培智. 广东省主要农作物秸秆养分资源量及替代化肥潜力[J]. 生态环境学报, 2022, 31(2): 297-306. |
| [10] | 陈瑶瑶, 廖彤, 汪宇, 沈劲, 翟宇虹, 叶斯琪, 陈多宏, 陈靖扬. 2016—2020年广东省臭氧污染特征[J]. 生态环境学报, 2022, 31(12): 2374-2381. |
| [11] | 王金杰, 赵安周, 胡小枫. 京津冀植被净初级生产力时空分布及自然驱动因子分析[J]. 生态环境学报, 2021, 30(6): 1158-1167. |
| 阅读次数 | ||||||
|
全文 |
|
|||||
|
摘要 |
|
|||||