生态环境学报 ›› 2023, Vol. 32 ›› Issue (10): 1750-1759.DOI: 10.16258/j.cnki.1674-5906.2023.10.004
肖瑶1( ), 刘渺渺1, 梁冠敏1, 胡喜生1, 林森1, 巫志龙1,2,*()
收稿日期:2023-07-30
出版日期:2023-10-18
发布日期:2024-01-16
通讯作者:
*巫志龙。E-mail: 81698187@qq.com作者简介:肖瑶(2000年生),女,硕士研究生,主要从事森林大数据与信息技术研究。E-mail: 723131934@qq.com
基金资助:
XIAO Yao1(), LIU Miaomiao1, LIANG Guanmin1, HU Xisheng1, LIN Sen1, WU Zhilong1,2,*()
Received:2023-07-30
Online:2023-10-18
Published:2024-01-16
摘要:
探索不同尺度情景下的区域生态网络构建,揭示其空间分布和特征差异,为区域生态规划和生物多样性保护提供理论依据。以闽三角地区为例,借助形态学空间格局分析(MSPA)探讨2000、2010和2020年森林景观结构动态变化;根据动物迁徙特点设置多尺度情景[小 (栖息地面积60 hm2,扩散距离10 km)、中 (300 hm2,30 km)、大 (500 hm2,60 km)、超大 (1000 hm2,100 km)],利用Linkage Mapper提取不同尺度情景下的生态廊道和生态节点,分析生态网络的适用性和特征。结果表明,1)近20年来,闽三角地区林地核心区面积比重下降0.63%,破碎化程度增加;核心区主要分布在北部、西北部和西南部山地丘陵地带,而东部沿海地区核心区斑块较少。2)近20年来,修正中介中心性指数和斑块重要性指数均增大,说明闽三角地区生态源地连通性有所增强,且两个指数均随尺度的增大而增大,说明尺度越大,生态源地连通性越高。3)以2020年土地利用数据构建生态网络,小、中、大和超大尺度情景下提取生态源地分别为1.044×10⁴、1.005×10⁴、0.989×10⁴和0.964×10⁴ km2;生态廊道1006、305、208和118条;不同尺度情景下生态源地、生态廊道有明显的空间差异,尺度越大,建成区密集的中心区源地和廊道越少;不同尺度情景下生态网络连通性有明显差异,大尺度情景生态网络的网络封闭度、连通性和复杂程度均优于其他尺度。4)在小、中、大和超大尺度情景下识别生态节点分别有233、79、70和35处;生态节点随着尺度的增加,数量减少,越容易修复,表明小尺度物种更容易受人类活动的影响。
中图分类号:
肖瑶, 刘渺渺, 梁冠敏, 胡喜生, 林森, 巫志龙. 基于多尺度情景的闽三角地区林地生态网络构建[J]. 生态环境学报, 2023, 32(10): 1750-1759.
XIAO Yao, LIU Miaomiao, LIANG Guanmin, HU Xisheng, LIN Sen, WU Zhilong. Construction of Forest Ecological Network in the Min River Delta Based on Multi-scale Scenarios[J]. Ecology and Environment, 2023, 32(10): 1750-1759.
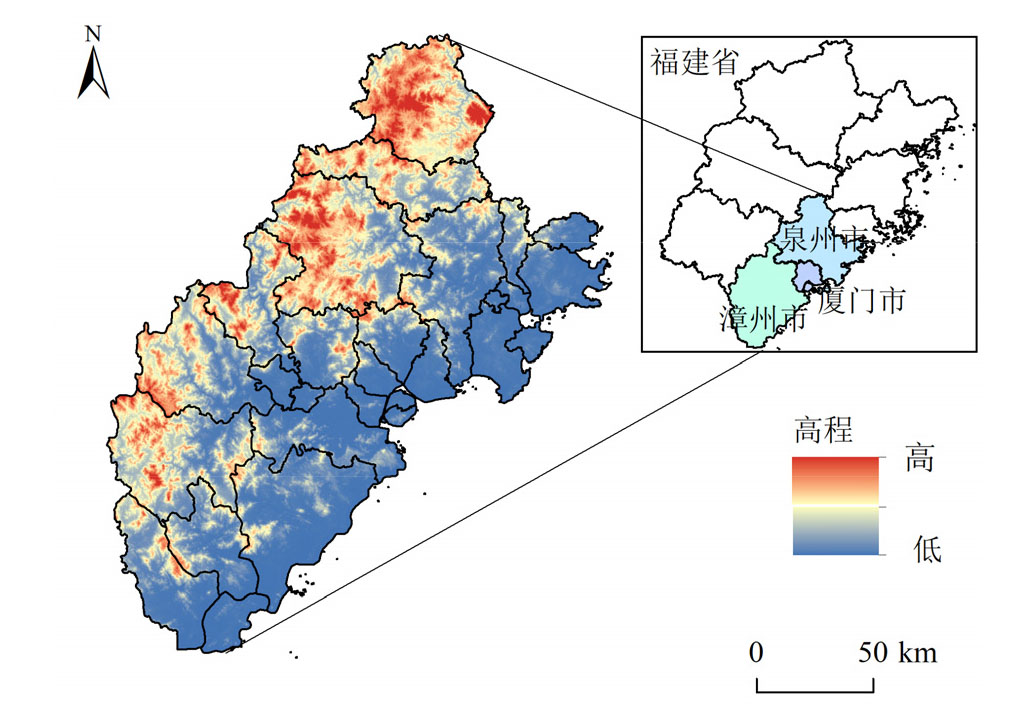
图1 研究区位置示意图 底图自然资源部审图号为GS(2019)1822号,下同
Figure 1 Location map of the study area
| 不同尺度情景 | 栖息地面积/hm2 | 物种扩散距离/km |
|---|---|---|
| 小尺度 | 60 | 10 |
| 中尺度 | 300 | 30 |
| 大尺度 | 500 | 60 |
| 超大尺度 | 1000 | 100 |
表1 物种扩散尺度
Table 1 Species diffusion scale
| 不同尺度情景 | 栖息地面积/hm2 | 物种扩散距离/km |
|---|---|---|
| 小尺度 | 60 | 10 |
| 中尺度 | 300 | 30 |
| 大尺度 | 500 | 60 |
| 超大尺度 | 1000 | 100 |
| 景观类型 | 生态学含义 |
|---|---|
| 核心区 | 前景像元中较大的生境斑块, 可为物种提供较大的栖息地,对生物多样性保护具有重要意义, 是生态网络中的潜在源地 |
| 孤岛 | 彼此不相连的孤立、破碎的小斑块、板块内外沟通交流的可能性较小 |
| 孔隙 | 核心区与内部非潜在源地之间的过渡区域, 即核心区内部边缘 |
| 边缘 | 核心区与外界非潜在源地之间的过渡区域, 即核心区外部边缘 |
| 环道 | 连接同一核心区, 是核心区内物种迁移的通道 |
| 桥接区 | 连接不同核心区, 可代表生态网络中连接源地的通道 |
| 支线 | 只有一端与边缘区、桥接区、环道或者孔隙相连的区域 |
表2 MSPA的景观类型及生态学含义
Table 2 Landscape types and ecological implications of MSPA
| 景观类型 | 生态学含义 |
|---|---|
| 核心区 | 前景像元中较大的生境斑块, 可为物种提供较大的栖息地,对生物多样性保护具有重要意义, 是生态网络中的潜在源地 |
| 孤岛 | 彼此不相连的孤立、破碎的小斑块、板块内外沟通交流的可能性较小 |
| 孔隙 | 核心区与内部非潜在源地之间的过渡区域, 即核心区内部边缘 |
| 边缘 | 核心区与外界非潜在源地之间的过渡区域, 即核心区外部边缘 |
| 环道 | 连接同一核心区, 是核心区内物种迁移的通道 |
| 桥接区 | 连接不同核心区, 可代表生态网络中连接源地的通道 |
| 支线 | 只有一端与边缘区、桥接区、环道或者孔隙相连的区域 |
| 评价因子 | 划分标准 | 电阻值 | 权重 |
|---|---|---|---|
| 土地利用类型 | 林地 草地 耕地 未利用土地 建设用地和水域 | 1 5 8 9 10 | 0.25 |
| 坡度/(°) | <5 5‒15 15‒25 25‒35 >35 | 1 7 8 9 10 | 0.15 |
| 与建设用地的距离/m | >2000 1500‒2000 1000‒1500 500‒1000 <500 | 1 7 8 9 10 | 0.32 |
| 与道路距离/m | >1500 1000‒1500 500‒1000 100‒500 <100 | 1 7 8 9 10 | 0.28 |
表3 阻力因子及其权重值
Table 3 Resistance factor and its weight value
| 评价因子 | 划分标准 | 电阻值 | 权重 |
|---|---|---|---|
| 土地利用类型 | 林地 草地 耕地 未利用土地 建设用地和水域 | 1 5 8 9 10 | 0.25 |
| 坡度/(°) | <5 5‒15 15‒25 25‒35 >35 | 1 7 8 9 10 | 0.15 |
| 与建设用地的距离/m | >2000 1500‒2000 1000‒1500 500‒1000 <500 | 1 7 8 9 10 | 0.32 |
| 与道路距离/m | >1500 1000‒1500 500‒1000 100‒500 <100 | 1 7 8 9 10 | 0.28 |
| 年份 | 不同景观类型面积占比/% | ||||||
|---|---|---|---|---|---|---|---|
| 孤岛 | 孔隙 | 边缘 | 环道 | 桥接区 | 支线 | 核心区 | |
| 2000 | 0.01 | 4.39 | 7.29 | 0.03 | 0.09 | 0.52 | 87.67 |
| 2010 | 0.01 | 4.21 | 7.98 | 0.03 | 0.1 | 0.57 | 87.10 |
| 2020 | 0.01 | 4.16 | 8.06 | 0.04 | 0.11 | 0.59 | 87.04 |
表4 闽三角地区2000-2020年景观类型面积占比
Table 4 The proportion of landscape type area in Fujian delta region from 2000 to 2020
| 年份 | 不同景观类型面积占比/% | ||||||
|---|---|---|---|---|---|---|---|
| 孤岛 | 孔隙 | 边缘 | 环道 | 桥接区 | 支线 | 核心区 | |
| 2000 | 0.01 | 4.39 | 7.29 | 0.03 | 0.09 | 0.52 | 87.67 |
| 2010 | 0.01 | 4.21 | 7.98 | 0.03 | 0.1 | 0.57 | 87.10 |
| 2020 | 0.01 | 4.16 | 8.06 | 0.04 | 0.11 | 0.59 | 87.04 |
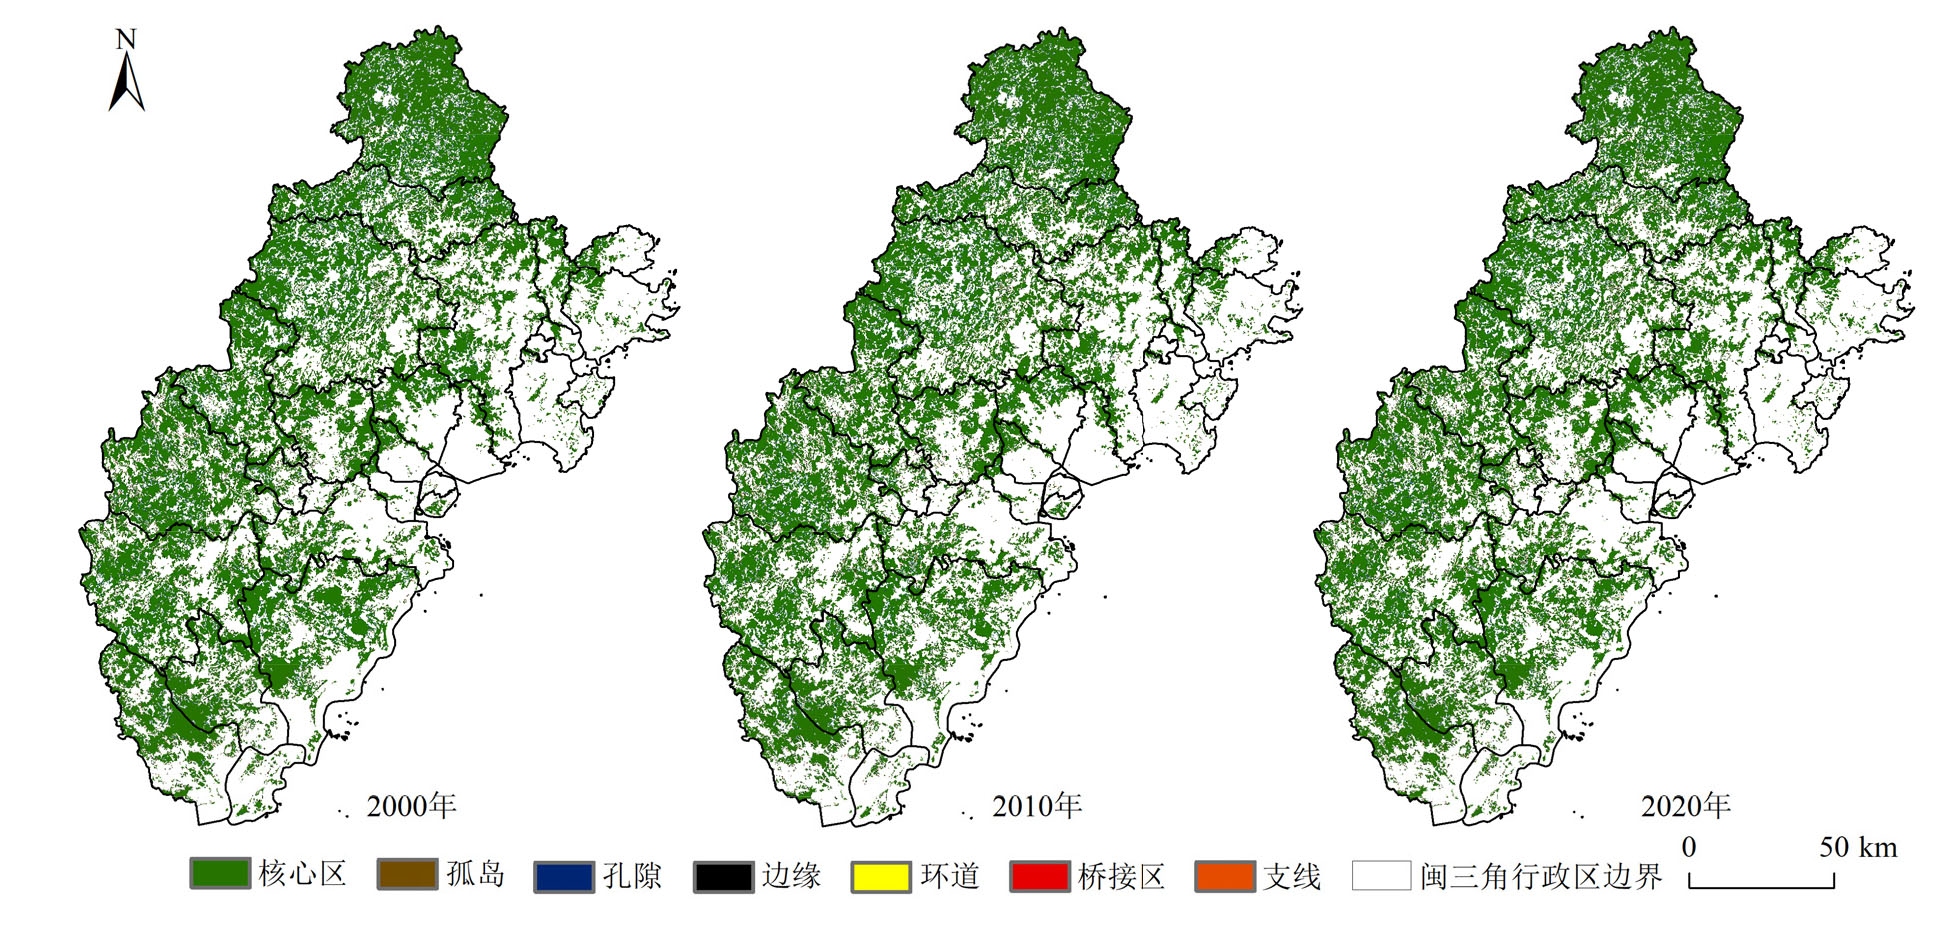
图2 闽三角地区2000-2020年景观类型分布格局
Figure 2 The distribution pattern of landscape types in Fujian delta region from 2000 to 2020
| 不同尺度情景 | 指数 (平均值) | 年份 | ||
|---|---|---|---|---|
| 2000 | 2010 | 2020 | ||
| 小尺度 | B 1) | 0.409 | 0.477 | 0.478 |
| D 2) | 0.590 | 0.596 | 0.600 | |
| 中尺度 | B | 1.448 | 1.628 | 1.593 |
| D | 1.561 | 1.801 | 1.778 | |
| 大尺度 | B | 2.031 | 2.396 | 2.379 |
| D | 2.182 | 2.447 | 2.444 | |
| 超大尺度 | B | 3.418 | 3.343 | 3.880 |
| D | 3.767 | 3.752 | 3.824 | |
表5 不同尺度情景下闽三角地区2000-2020年生态源地连通性指数
Table 5 The connectivity index of ecological sources in Fujian delta region from 2000 to 2020 under different scale scenarios
| 不同尺度情景 | 指数 (平均值) | 年份 | ||
|---|---|---|---|---|
| 2000 | 2010 | 2020 | ||
| 小尺度 | B 1) | 0.409 | 0.477 | 0.478 |
| D 2) | 0.590 | 0.596 | 0.600 | |
| 中尺度 | B | 1.448 | 1.628 | 1.593 |
| D | 1.561 | 1.801 | 1.778 | |
| 大尺度 | B | 2.031 | 2.396 | 2.379 |
| D | 2.182 | 2.447 | 2.444 | |
| 超大尺度 | B | 3.418 | 3.343 | 3.880 |
| D | 3.767 | 3.752 | 3.824 | |
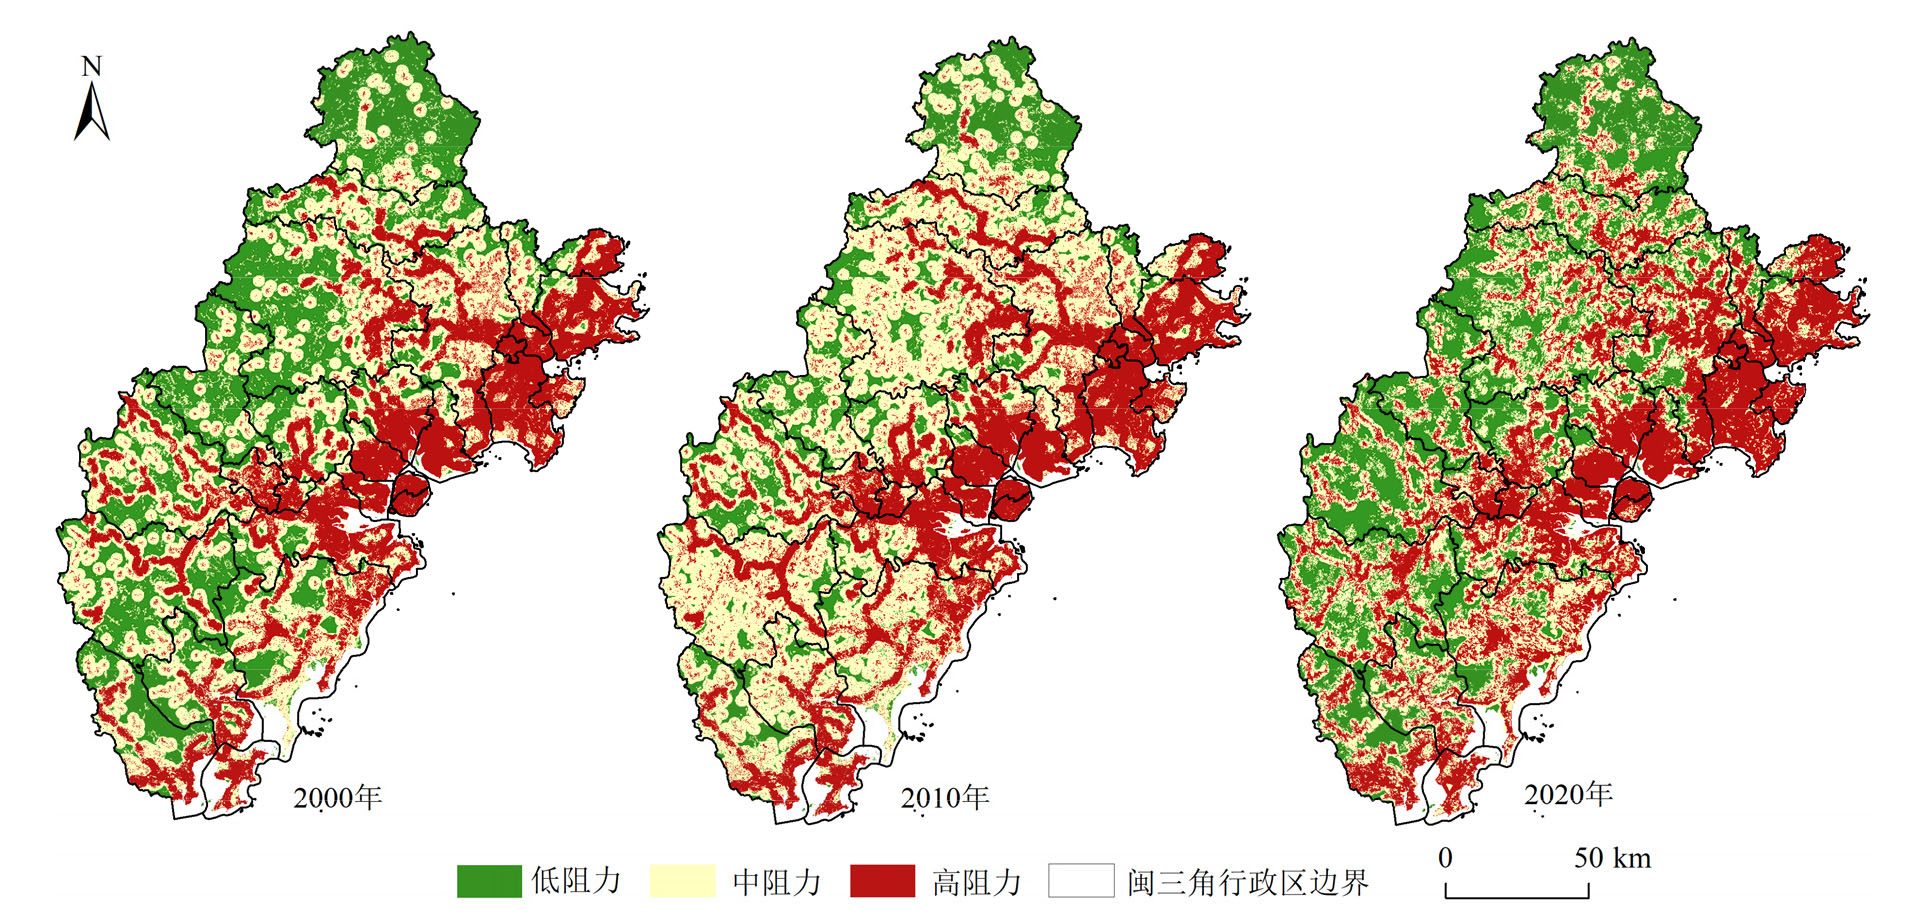
图3 闽三角地区2000-2020年综合阻力面
Figure 3 The comprehensive resistance surface of Fujian delta region from 2000 to 2020
| 年份 | 不同阻力面面积占比/% | ||
|---|---|---|---|
| 低阻力面 | 中阻力面 | 高阻力面 | |
| 2000 | 31.35 | 38.93 | 29.72 |
| 2010 | 16.45 | 49.55 | 34.00 |
| 2020 | 31.38 | 33.82 | 34.80 |
表6 闽三角地区2000-2020年不同阻力面面积占比
Table 6 The proportion of different resistance surface in Fujian delta region from 2000 to 2020
| 年份 | 不同阻力面面积占比/% | ||
|---|---|---|---|
| 低阻力面 | 中阻力面 | 高阻力面 | |
| 2000 | 31.35 | 38.93 | 29.72 |
| 2010 | 16.45 | 49.55 | 34.00 |
| 2020 | 31.38 | 33.82 | 34.80 |
| 要素 | 因素 | 不同尺度情景 | |||
|---|---|---|---|---|---|
| 小尺度 | 中尺度 | 大尺度 | 超大尺度 | ||
| 生态源地 | 数量/个 | 460 | 134 | 92 | 55 |
| 面积/(104 km2) | 1.044 | 1.005 | 0.989 | 0.964 | |
| 生态廊道 | 数量/条 | 1006 | 305 | 208 | 118 |
| 长度/(103 km) | 1.595 | 0.931 | 0.626 | 0.323 | |
表7 闽三角地区不同尺度情景生态网络特征
Table 7 The characteristics of scenario ecological network at different scales in Fujian delta region
| 要素 | 因素 | 不同尺度情景 | |||
|---|---|---|---|---|---|
| 小尺度 | 中尺度 | 大尺度 | 超大尺度 | ||
| 生态源地 | 数量/个 | 460 | 134 | 92 | 55 |
| 面积/(104 km2) | 1.044 | 1.005 | 0.989 | 0.964 | |
| 生态廊道 | 数量/条 | 1006 | 305 | 208 | 118 |
| 长度/(103 km) | 1.595 | 0.931 | 0.626 | 0.323 | |
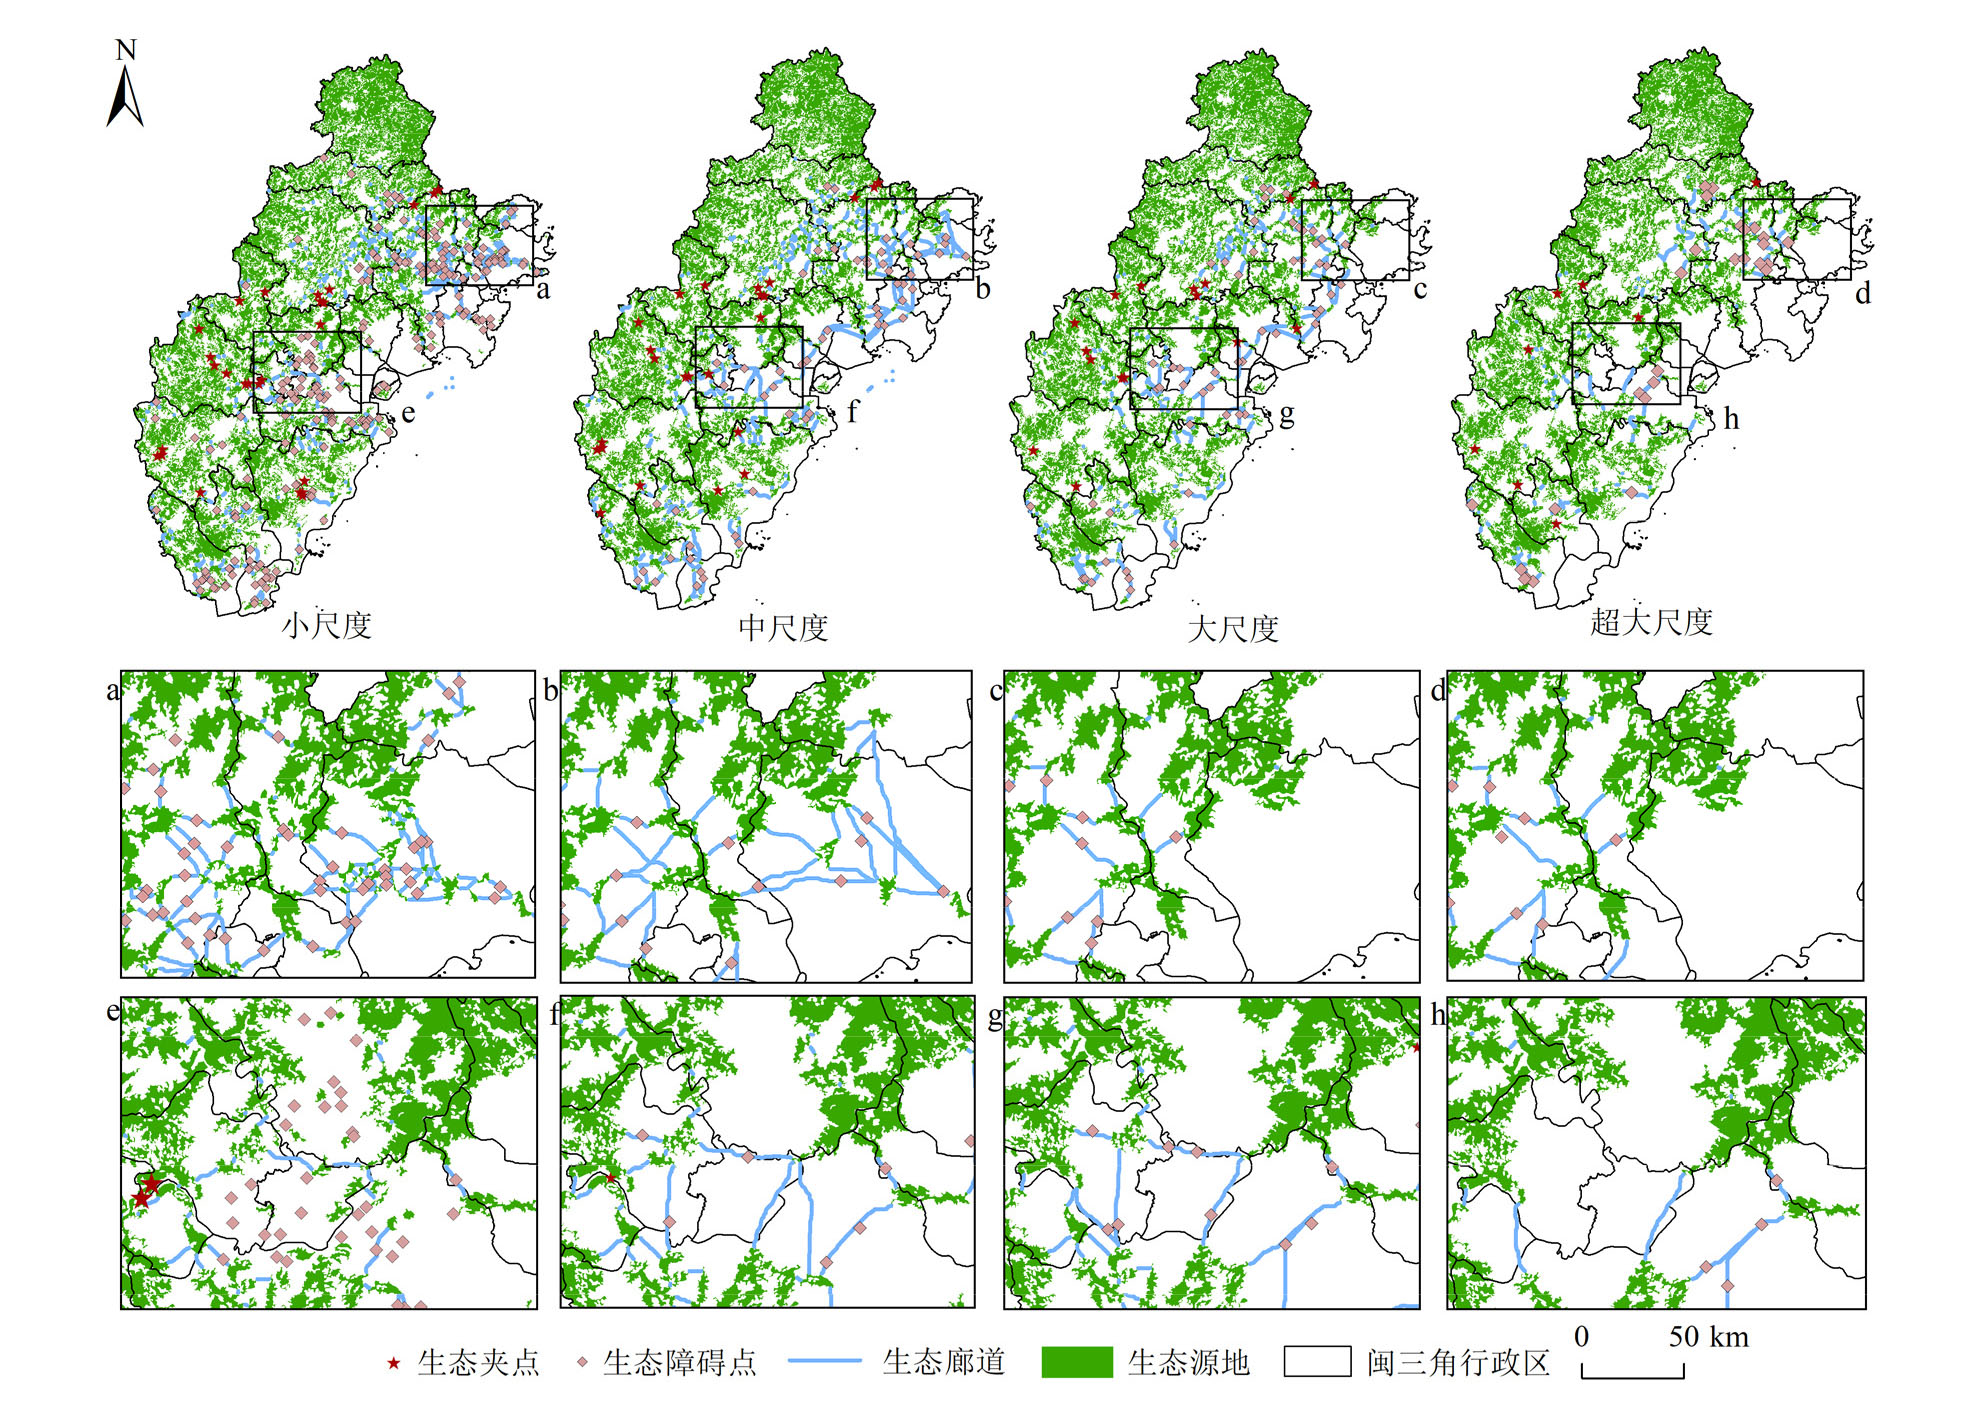
图4 闽三角地区不同尺度情景生态安全格局
Figure 4 Ecological security pattern of different scale scenarios in Fujian delta region
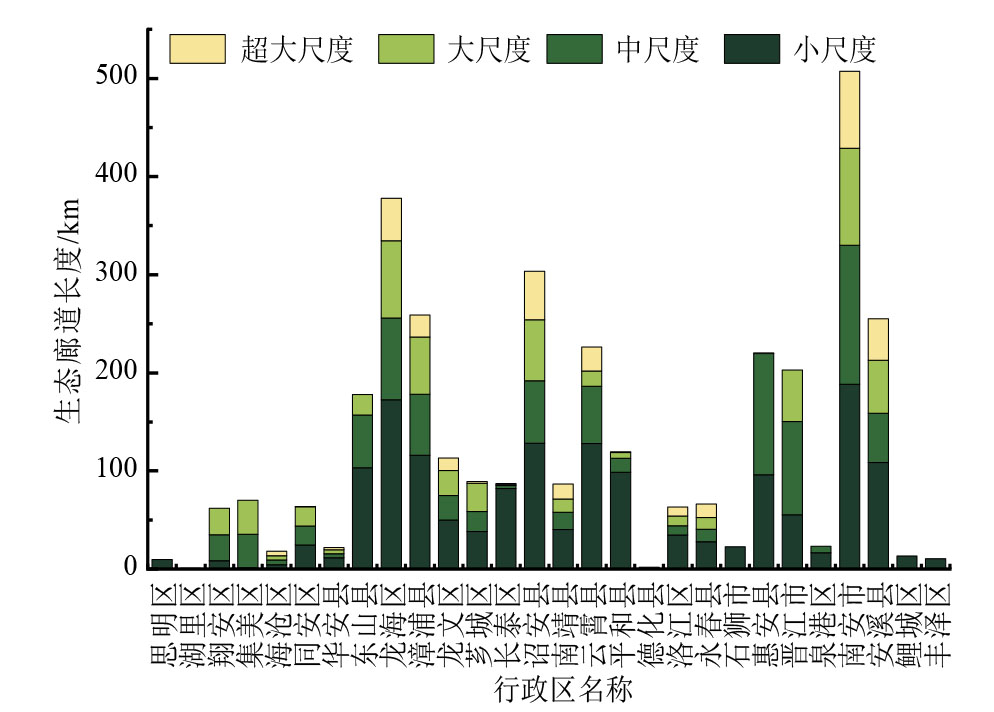
图5 闽三角地区不同区域生态廊道长度
Figure 5 The length of ecological corridors in different regions of Fujian delta region
| 生态网络指数 | 不同尺度情景 | |||
|---|---|---|---|---|
| 小尺度 | 中尺度 | 大尺度 | 超大尺度 | |
| α | 0.586 | 0.626 | 0.641 | 0.589 |
| β | 2.164 | 2.223 | 2.237 | 2.107 |
| γ | 0.724 | 0.752 | 0.762 | 0.728 |
表8 闽三角地区不同尺度情景生态网络指数
Table 8 Scenario ecological network index of different scales in Fujian delta region
| 生态网络指数 | 不同尺度情景 | |||
|---|---|---|---|---|
| 小尺度 | 中尺度 | 大尺度 | 超大尺度 | |
| α | 0.586 | 0.626 | 0.641 | 0.589 |
| β | 2.164 | 2.223 | 2.237 | 2.107 |
| γ | 0.724 | 0.752 | 0.762 | 0.728 |
| [1] |
BOWMAN J, JAEGER J A G, FAHRIG L, 2002. Dispersal distance of mammals is proportional to home range size[J]. Ecology, 83(7): 2049-2055.
DOI URL |
| [2] |
GRASSMAN L I, TEWES M E, SILVY N J, et al., 2006. Spatial organization and diet of the leopard cat (Prionailurus bengalensis) in north-central Thailand[J]. Journal of Zoology, 266(1): 45-54.
DOI URL |
| [3] |
HADDAD N M, BRUDVIG L A, CLOBERT J, et al., 2015. Habitat fragmentation and its lasting impact on Earth’s ecosystems[J]. Science Advances, 1(2): e1500052.
DOI URL |
| [4] |
JIANG H, PENG J, ZHAO Y, et al., 2022. Zoning for ecosystem restoration based on ecological network in mountainous region[J]. Ecological Indicators, 142: 109138.
DOI URL |
| [5] |
KREUTER U P, HARRIS H G, MATLOCK M D, et al., 2001. Change in ecosystem service values in the San Antonio area, Texas[J]. Ecological Economics, 39(3): 333-346.
DOI URL |
| [6] |
LI H L, PENG J, LIU Y X, et al., 2017. Urbanization impact on landscape patterns in Beijing city, China: A spatial heterogeneity perspective[J]. Ecological Indicators, 82: 50-60.
DOI URL |
| [7] |
LI J, SHAN R, YUAN W H, 2023. Constructing the landscape ecological security pattern in the Dawen River basin in China: A framework based on the circuit principle[J]. International Journal of Environmental Research and Public Health, 20(6): 5181.
DOI URL |
| [8] |
MCRAE B H, DICKSON B G, KEITT T H, et al., 2008. Using circuit theory to model connectivity in ecology, evolution, and conservation[J]. Ecology, 89(10): 2712-2724.
DOI PMID |
| [9] |
MINOR E S, LOOKINGBILL T R, 2010. A multiscale network analysis of protected-area connectivity for mammals in the United States[J]. Conservation Biology, 24(6): 1549-1558.
DOI PMID |
| [10] |
NOSS R F, QUIGLEY H B, HORNOCKER M G, et al., 1996. Conservation biology and carnivore conservation in the Rocky Mountains[J]. Conservation Biology, 10(4): 949-963.
DOI URL |
| [11] |
SPANOWICZ A G, JAEGER J A G, 2019. Measuring landscape connectivity: On the importance of within-patch connectivity[J]. Landscape Ecology, 34(10): 2261-2278.
DOI |
| [12] |
SHI F N, LIU S L, SUN Y X, et al., 2020. Ecological network construction of the heterogeneous agro-pastoral areas in the upper Yellow River basin[J]. Agriculture, Ecosystems and Environment, 302: 107069.
DOI URL |
| [13] |
SIMMONDS J S, SONTER L J, WATSON J E M, et al., 2020. Moving from biodiversity offsets to a target-based approach for ecological compensation[J]. Conservation Letters, 13(2): e12695.
DOI URL |
| [14] |
SHEN Z, WU W, TIAN S Q, et al., 2022. A multi-scale analysis framework of different methods used in establishing ecological networks[J]. Landscape and Urban Planning, 228: 104579.
DOI URL |
| [15] |
TANNIER C, BOURGEOIS M, HOUOT H, et al., 2016. Impact of urban developments on the functional connectivity of forested habitats: A joint contribution of advanced urban models and landscape graphs[J]. Land Use Policy, 52: 76-91.
DOI URL |
| [16] |
VOGT P, RIITTERS K H, IWANOWSKI M, et al., 2007. Mapping landscape corridors[J]. Ecological Indicators, 7(2): 481-488.
DOI URL |
| [17] |
WU J S, ZHANG S Y, WEN H H, et al., 2022. Research on multi-scale ecological network connectivity: Taking the Guangdong-Hong Kong-Macao Greater Bay Area as a case study[J]. International Journal of Environmental Research and Public Health, 19(22): 15268.
DOI URL |
| [18] |
ZHOU Y K, NING L X, BAI X L, 2018. Spatial and temporal changes of human disturbances and their effects on landscape patterns in the Jiangsu coastal zone, China[J]. Ecological Indicators, 93: 111-122.
DOI URL |
| [19] | 陈瑾, 赵超超, 赵青, 等, 2023. 基于MSPA分析的福建省生态网络构建[J]. 生态学报, 43(2): 1-12. |
|
CHEN J, ZHAO C C, ZHAO Q, et al., 2023. Construction of ecological network in Fujian Province based on morphological spatial pattern analysis[J]. Acta Ecologica Sinica, 43(2): 1-12.
DOI URL |
|
| [20] |
杜箫宇, 吕飞南, 王春雨, 等, 2023. 基于MSPA-Conefor-MCR的县域尺度生态网络构建——以延庆区为例[J]. 应用生态学报, 2023, 34(4): 1073-1082.
DOI |
|
DU X Y, LÜ F N, WANG C Y, et al., 2023. Construction of ecological network based on MSPA-Conefor-MCR at the county scale: A case study in Yanqing district, Beijing, China[J]. Chinese Journal of Applied Ecology, 34(4): 1073-1082.
DOI |
|
| [21] | 付刚, 肖能文, 乔梦萍, 等, 2017. 北京市近二十年景观破碎化格局的时空变化[J]. 生态学报, 37(8): 2551-2562. |
| FU G, XIAO N W, QIAO M P, et al., 2017. Spatial-temporal changes of landscape fragmentation patterns in Beijing in the last two decades[J]. Acta Ecologica Sinica, 37(8): 2551-2562. | |
| [22] |
黄苍平, 尹小玲, 黄光庆, 等, 2018. 厦门市同安区生态安全格局构建[J]. 热带地理, 38(6): 874-883.
DOI |
|
HUANG C P, YIN X L, HUANG G Q, et al., 2018. Construction of ecological security pattern of Tong’an district, Xiamen city[J]. Tropical Geography, 38(6): 874-883.
DOI |
|
| [23] | 胡其玉, 陈松林, 2021. 基于生态系统服务供需的厦漳泉地区生态网络空间优化[J]. 自然资源学报, 36(2): 342-355. |
|
HU Q Y, CHEN S L, 2021 Optimizing the ecological networks based on the supply and demand of ecosystem services in Xiamen-Zhangzhou-Quanzhou region[J]. Journal of Natural Resources, 36(2): 342-355.
DOI |
|
| [24] | 陆禹, 佘济云, 陈彩虹, 等, 2015. 基于粒度反推法的景观生态安全格局优化——以海口市秀英区为例[J]. 生态学报, 35(19): 6384-6393. |
| LU Y, SHE J Y, CHEN C H, et al., 2015. Landscape ecological security pattern optimization based on the granularity inverse method: A case study in Xiuying district, Haikou[J]. Acta Ecologica Sinica, 35(19): 6384-6393. | |
| [25] | 刘世梁, 侯笑云, 尹艺洁, 等, 2017. 景观生态网络研究进展[J]. 生态学报, 37(12): 3947-3956. |
| LIU S L, HOU X Y, YIN Y J, et al., 2017. Research progress on landscape ecological networks[J]. Acta Ecologica Sinica, 37(12): 3947-3956. | |
| [26] | 刘佳, 尹海伟, 孔繁花, 等, 2018. 基于电路理论的南京城市绿色基础设施格局优化[J]. 生态学报, 38(12): 4363-4372. |
| LIU J, YIN H W, KONG F H, et al., 2018. Structure optimization of circuit theory-based green infrastructure in Nanjing, China[J]. Acta Ecologica Sinica, 38(12): 4363-4372. | |
| [27] | 刘伊萌, 杨赛霓, 倪维, 等, 2020. 生态斑块重要性综合评价方法研究——以四川省为例[J]. 生态学报, 40(11): 3602-3611. |
| LIU Y M, YANG S N, NI W, et al., 2020. Comprehensive assessment method on ecological patch importance: A case study in Sichuan Province, China[J]. Acta Ecologica Sinica, 40(11): 3602-3611. | |
| [28] |
刘晓阳, 魏铭, 曾坚, 等, 2021. 闽三角城市群生态网络分析与构建[J]. 资源科学, 43(2): 357-367.
DOI |
|
LIU X Y, WEI M, ZENG J, et al., 2021. Ecological network analysis and construction: A case study of the urban agglomeration of the Min River Delta, China[J]. Resources Science, 43(2): 357-367.
DOI |
|
| [29] |
李平星, 邹露, 2022. 基于土地利用变化的生态廊道识别和建设成本研究——以南京东郊地区为例[J]. 生态环境学报, 31(2): 277-285.
DOI |
| LI P X, ZOU L, 2022. Identification and construction cost of ecological corridors based on land use change: The case of eastern suburb Nanjing[J]. Ecology and Environmental Sciences, 31(2): 277-285. | |
| [30] |
倪庆琳, 侯湖平, 丁忠义, 等, 2020. 基于生态安全格局识别的国土空间生态修复分区——以徐州市贾汪区为例[J]. 自然资源学报, 35(1): 204-216.
DOI |
|
NI Q L, HOU H P, DING Z Y, et al., 2020. Ecological remediation zoning of territory based on the ecological security pattern recognition: Taking Jiawang district of Xuzhou city as an example[J]. Journal of Natural Resources, 35(1): 204-216.
DOI URL |
|
| [31] | 覃彬桂, 林伊琳, 赵俊三, 等, 2023. 基于InVEST模型和电路理论的昆明市国土空间生态修复关键区域识别[J]. 中国环境科学, 43(2): 809-820. |
| QIN B G, LIN Y L, ZHAO J S, et al., 2023. Identification of key areas for the ecological restoration of territorial space in Kunming based on the InVEST model and circuit theory[J]. China Environmental Science, 43(2): 809-820. | |
| [32] |
宋利利, 秦明周, 2016. 整合电路理论的生态廊道及其重要性识别[J]. 应用生态学报, 27(10): 3344-3352.
DOI |
| SONG L L, QIN M Z, 2016. Identification of ecological corridors and its importance by integrating circuit theory[J]. Chinese Journal of Applied Ecology, 27(10): 3344-3352. | |
| [33] | 邬建国, 2007. 景观生态学-格局、过程、尺度与等级[M]. 第2版. 北京: 高等教育出版社: 23. |
| WU F G. 2007. Landscape ecology-pattern, process, scale and hierarchy[M]. 2nd edition. Beijing: Higher Education Press: 23. | |
| [34] |
韦家怡, 李铖, 吴志峰, 等, 2022. 粤港澳大湾区生态安全格局及重要生态廊道识别[J]. 生态环境学报, 31(4): 652-662.
DOI |
| WEI J Y, LI C, WU Z F, et al., 2022. Identifying ecological security patterns and prioritizing ecological corridors in the Guangdong-Hong Kong-Macao Greater Bay Area[J]. Ecology and Environmental Sciences, 31(4): 652-662. | |
| [35] | 王正伟, 王宏卫, 杨胜天, 等, 2022. 基于生态系统服务功能的新疆绿洲生态安全格局识别及优化策略——以拜城县为例[J]. 生态学报, 42(1): 91-104. |
| WANG Z W, WANG H W, YANG S T, et al., 2022. Identification and optimization strategy of ecological security pattern of oasis in Xinjiang based on ecosystem service function: Taking Baicheng County as an example[J]. Acta Ecologica Sinica, 42(1): 91-104. | |
| [36] | 许峰, 尹海伟, 孔繁花, 等, 2015. 基于MSPA与最小路径方法的巴中西部新城生态网络构建[J]. 生态学报, 35(19): 6425-6434. |
| XU F, YIN H W, KONG F H, et al., 2015. Developing ecological networks based on MSPA and the least-cost path method: A case study in Bazhong western new district[J]. Acta Ecologica Sinica, 35(19): 6425-6434. | |
| [37] |
许静, 廖星凯, 甘崎旭, 等, 2023. 基于MSPA与电路理论的黄河流域甘肃段生态安全格局构建[J]. 生态环境学报, 32(4): 805-813.
DOI |
| XU J, LIAO X K, GAN Q X, et al., 2023. Construction of ecological security pattern based on MSPA and circuit theory in Gansu section of the Yellow River basin[J]. Ecology and Environmental Sciences, 32(4): 805-813. | |
| [38] | 殷炳超, 何书言, 李艺, 等, 2018. 基于陆海统筹的海岸带城市群生态网络构建方法及应用研究[J]. 生态学报, 38(12): 4373-4382. |
| YIN B C, HE S Y, LI Y, et al., 2018. Development and application of an ecological network model for a coastal megalopolis based on land-sea integration[J]. Acta Ecologica Sinica, 38(12): 4373-4382. | |
| [39] | 余慈衔, 王柳柱, 赵晟, 等, 2023. 基于MSPA和MCR模型的舟山岛生态安全格局构建及优化[J]. 海洋通报, 42(1):102-111. |
| YU C X, WANG L Z, ZHAO S, et al., 2023. Construction and optimization of ecological security pattern in Zhoushan Island based on MSPA and MCR model[J]. Marine Science Bulletin, 42(1): 102-111. | |
| [40] | 杨帅琦, 何文, 王金叶, 等, 2023. 基于MCR模型的漓江流域生态安全格局构建[J]. 中国环境科学, 43(4): 1824-1833. |
| YANG S Q, HE W, WANG J Y, et al., 2023. Ecological security pattern construction in Lijiang River basin based on MCR model[J]. China Environment Science, 43(4): 1824-1833. | |
| [41] | 翟香, 兰安军, 廖艳梅, 等, 2022. 基于生态安全格局的国土空间生态修复关键区域定量识别——以贵州省为例[J]. 水土保持研究, 29(6): 322-329, 343. |
| ZHAI X, LAN A P, LIAO Y M, et al., 2022. Quantitative identification of key areas of land space ecological restoration based on the ecological security pattern: A case study of Guizhou Province[J]. Research of Soil and Water Conservation, 29(6): 322-329, 343. |
| [1] | 蔡国俊, 袁桂香, 符辉. 基于文献计量分析的生态网络研究现状和趋势[J]. 生态环境学报, 2022, 31(8): 1690-1699. |
| [2] | 韦家怡, 李铖, 吴志峰, 张莉, 吉冬青, 程炯. 粤港澳大湾区生态安全格局及重要生态廊道识别[J]. 生态环境学报, 2022, 31(4): 652-662. |
| [3] | 杨贤房, 陈朝, 郑林, 万智巍, 陈永林, 王远东. 稀土矿区不同土地利用类型土壤细菌群落特征及网络分析[J]. 生态环境学报, 2022, 31(4): 793-801. |
| [4] | 李平星, 邹露. 基于土地利用变化的生态廊道识别和建设成本研究——以南京东郊地区为例[J]. 生态环境学报, 2022, 31(2): 277-285. |
| [5] | 王宇姝, 盛海彦, 罗莎莎, 胡月明, 余玲玲. 环青海湖4种生境土壤中原核微生物群落结构及分子网络特征[J]. 生态环境学报, 2021, 30(7): 1393-1403. |
| 阅读次数 | ||||||
|
全文 |
|
|||||
|
摘要 |
|
|||||