生态环境学报 ›› 2021, Vol. 30 ›› Issue (6): 1168-1176.DOI: 10.16258/j.cnki.1674-5906.2021.06.007
王剑1( ), 包海1,2,*(), 李达毅1, 刘智远1, 杨娜1
收稿日期:2021-01-22
出版日期:2021-06-18
发布日期:2021-09-10
通讯作者:
* E-mail: baohai@imnu.edu.cn作者简介:王剑(1995年生),男,硕士研究生,主要从事生物源挥发性有机化合物的研究。E-mail: 1164240738@qq.com
基金资助:
WANG Jian1(), BAO Hai1,2,*(), LI Dayi1, LIU Zhiyuan1, YANG Na1
Received:2021-01-22
Online:2021-06-18
Published:2021-09-10
摘要:
生物源挥发性有机物(Biogenic Volatile Organic Compounds,BVOC)对城市臭氧污染起着重要作用,为准确估算BVOC对城市臭氧污染的贡献,研究BVOC标准状态(叶温T=303 K,PAR (Photosynthetically Active Radiation)=1000 μmol∙m-2∙s-1)下的排放量极为重要。于2018年8月、2019年9月和2020年9月,以干旱半干旱区的呼和浩特市作为采样地点,选择4种针叶树种为研究对象,采用动态箱采集-TD-GC/MS分析法对干旱半干旱区夏季绿化树种BVOC排放量进行了定性定量分析,并依据实验数据确定了BVOC推算模式G93模式中最佳的经验系数β值,最终测定了夏季4种绿化树种BVOC标准状态下的排放量。结果如下:(1)干旱半干旱区主要绿化树种杜松(Juniperus rigida)、油松(Pinus tabulaeformis)、白皮松(Pinus bengeana)、云杉(Picea asperata)标准状态下排放量最佳的β值分别为0.136、0.10、0.11、0.064 K-1;(2)杜松、油松、白皮松、云杉等排放单萜烯标准状态下的排放量分别为1.85、0.57、0.09、0.08 μg∙g-1∙h-1;其异戊二烯标准状态下的排放量分别为0.05、0.02、0、0.03 μg∙g-1∙h-1;(3)估算不同气候条件下植物BVOC排放量时,通过改变G93模式中β值较准确推定不同区域树种标准状态下的排放量,进而较准确评价不同区域BVOC排放量对臭氧污染的贡献。
中图分类号:
王剑, 包海, 李达毅, 刘智远, 杨娜. 干旱半干旱区夏季绿化树种挥发性有机物标准排放量的测定[J]. 生态环境学报, 2021, 30(6): 1168-1176.
WANG Jian, BAO Hai, LI Dayi, LIU Zhiyuan, YANG Na. Emissions of Volatile Organic Compounds from Landscape Trees in Arid and Semi-Arid Region During Summer[J]. Ecology and Environment, 2021, 30(6): 1168-1176.
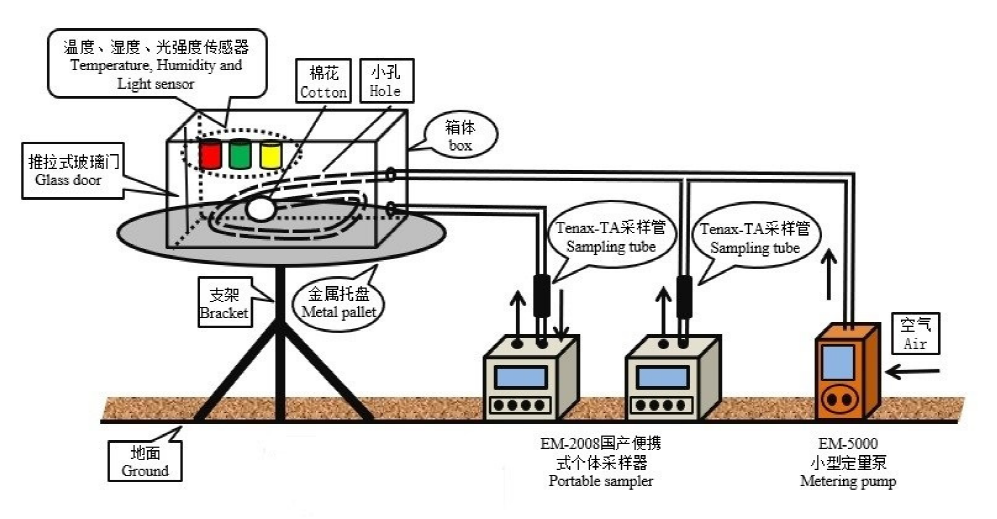
图1 动态采样箱采样示意图
Fig. 1 Diagram of the dynamic chamber system
| 树种 Code | 采样日期 Sampling time | BVOC排放量 BVOC emissions/(μg·g-1·h-1) | N* | 温度Temperature/℃ | PAR/(μmol·m-2·s-1) | RH/% | ||||
|---|---|---|---|---|---|---|---|---|---|---|
| 异戊二烯Isoprene | 单萜烯*Monoterpenes* | |||||||||
| 杜松 Juniperus rigida | 2018-08-25 | 0 | 1.10‒4.76 | 12 | 23.51‒25.64 | 11.03‒16.93 | 71.31 | |||
| 2018-08-26 | 0‒0.03 | 0.39‒0.92 | 12 | 20.75‒29.62 | 51.20‒82.86 | 70.75 | ||||
| 2018-08-27 | 0.01‒0.03 | 1.44‒1.67 | 12 | 23.55‒28.32 | 50.17‒75.28 | 74.29 | ||||
| 总均值 Mean | 0‒0.03 | 0.98‒2.45 | 36 | 22.60‒27.86 | 37.47‒58.36 | 65.55 | ||||
| 油松 Pinus tabulaeformis | 2019-09-02 | 0.04‒0.16 | 0.04‒0.47 | 12 | 26.84‒55.27 | 62.58‒142.22 | 39.93 | |||
| 2019-09-03 | 0.05‒0.06 | 0.05‒0.11 | 12 | 21.69‒35.36 | 25.63‒150.47 | 33.43 | ||||
| 2019-09-04 2020-09-05 2020-09-06 2020-09-07 | 0.01‒0.02 0.02‒0.19 0.02‒0.05 0.02‒0.07 | 0.03‒0.18 0.06‒0.62 0.01‒0.12 0.01‒0.17 | 12 12 12 12 | 23.41‒31.09 21.35‒37.02 23.44‒36.82 25.34‒40.89 | 20.39‒133.29 52.91‒968.63 74.89‒1277.26 70.81‒1198.36 | 29.33 59.80 44.68 32.54 | ||||
| 总均值 Mean | 0.04‒0.12 | 0.03‒0.28 | 72 | 23.68‒39.41 | 51.20‒645.04 | 39.95 | ||||
| 白皮松 Pinus bungeana | 2019-09-05 | 0‒0.01 | 0.04‒0.10 | 12 | 22.65‒33.20 | 26.77‒527.01 | 54.93 | |||
| 2019-09-06 | 0‒0.08 | 0.01‒0.21 | 12 | 17.64‒35.66 | 30.36‒130.15 | 61.28 | ||||
| 2019-09-07 | 0‒0.11 | 0.01‒0.08 | 12 | 17.67‒33.66 | 28.06‒274.33 | 59.82 | ||||
| 2020-09-16 | 0 | 0.01‒0.26 | 12 | 21.00‒35.96 | 162.16‒1987.76 | 18.4 | ||||
| 2020-09-17 | 0 | 0.02‒0.71 | 12 | 22.41‒42.61 | 93.64‒1536.60 | 30.59 | ||||
| 2020-09-18 | 0‒0.02 | 0.01‒0.96 | 12 | 23.38‒42.83 | 71.93‒1914.29 | 41.95 | ||||
| 总均值 Mean | 0‒0.04 | 0.02‒0.39 | 72 | 22.41‒40.47 | 68.82‒1061.69 | 30.32 | ||||
| 云杉 Picea asperata | 2020-09-05 | 0‒0.16 | 0.02‒0.25 | 12 | 30.48‒37.37 | 636.87‒1442.69 | 31.04 | |||
| 2020-09-06 | 0‒0.12 | 0.02‒0.54 | 12 | 28.36‒39.35 | 113.20‒1977.75 | 22.70 | ||||
| 2020-09-07 | 0.02‒0.08 | 0.02‒0.09 | 12 | 30.52‒36.72 | 276.60‒118.17 | 20.93 | ||||
| 总均值 Mean | 0.01‒0.12 | 0.02‒0.29 | 36 | 29.79‒37.81 | 342.22‒1179.54 | 24.89 | ||||
表1 呼和浩特市绿化树种BVOC排放量及采样箱内环境参数
Table 1 BVOC emissions from landscape trees in Hohhot City and the meteorological parameter in the sampling box
| 树种 Code | 采样日期 Sampling time | BVOC排放量 BVOC emissions/(μg·g-1·h-1) | N* | 温度Temperature/℃ | PAR/(μmol·m-2·s-1) | RH/% | ||||
|---|---|---|---|---|---|---|---|---|---|---|
| 异戊二烯Isoprene | 单萜烯*Monoterpenes* | |||||||||
| 杜松 Juniperus rigida | 2018-08-25 | 0 | 1.10‒4.76 | 12 | 23.51‒25.64 | 11.03‒16.93 | 71.31 | |||
| 2018-08-26 | 0‒0.03 | 0.39‒0.92 | 12 | 20.75‒29.62 | 51.20‒82.86 | 70.75 | ||||
| 2018-08-27 | 0.01‒0.03 | 1.44‒1.67 | 12 | 23.55‒28.32 | 50.17‒75.28 | 74.29 | ||||
| 总均值 Mean | 0‒0.03 | 0.98‒2.45 | 36 | 22.60‒27.86 | 37.47‒58.36 | 65.55 | ||||
| 油松 Pinus tabulaeformis | 2019-09-02 | 0.04‒0.16 | 0.04‒0.47 | 12 | 26.84‒55.27 | 62.58‒142.22 | 39.93 | |||
| 2019-09-03 | 0.05‒0.06 | 0.05‒0.11 | 12 | 21.69‒35.36 | 25.63‒150.47 | 33.43 | ||||
| 2019-09-04 2020-09-05 2020-09-06 2020-09-07 | 0.01‒0.02 0.02‒0.19 0.02‒0.05 0.02‒0.07 | 0.03‒0.18 0.06‒0.62 0.01‒0.12 0.01‒0.17 | 12 12 12 12 | 23.41‒31.09 21.35‒37.02 23.44‒36.82 25.34‒40.89 | 20.39‒133.29 52.91‒968.63 74.89‒1277.26 70.81‒1198.36 | 29.33 59.80 44.68 32.54 | ||||
| 总均值 Mean | 0.04‒0.12 | 0.03‒0.28 | 72 | 23.68‒39.41 | 51.20‒645.04 | 39.95 | ||||
| 白皮松 Pinus bungeana | 2019-09-05 | 0‒0.01 | 0.04‒0.10 | 12 | 22.65‒33.20 | 26.77‒527.01 | 54.93 | |||
| 2019-09-06 | 0‒0.08 | 0.01‒0.21 | 12 | 17.64‒35.66 | 30.36‒130.15 | 61.28 | ||||
| 2019-09-07 | 0‒0.11 | 0.01‒0.08 | 12 | 17.67‒33.66 | 28.06‒274.33 | 59.82 | ||||
| 2020-09-16 | 0 | 0.01‒0.26 | 12 | 21.00‒35.96 | 162.16‒1987.76 | 18.4 | ||||
| 2020-09-17 | 0 | 0.02‒0.71 | 12 | 22.41‒42.61 | 93.64‒1536.60 | 30.59 | ||||
| 2020-09-18 | 0‒0.02 | 0.01‒0.96 | 12 | 23.38‒42.83 | 71.93‒1914.29 | 41.95 | ||||
| 总均值 Mean | 0‒0.04 | 0.02‒0.39 | 72 | 22.41‒40.47 | 68.82‒1061.69 | 30.32 | ||||
| 云杉 Picea asperata | 2020-09-05 | 0‒0.16 | 0.02‒0.25 | 12 | 30.48‒37.37 | 636.87‒1442.69 | 31.04 | |||
| 2020-09-06 | 0‒0.12 | 0.02‒0.54 | 12 | 28.36‒39.35 | 113.20‒1977.75 | 22.70 | ||||
| 2020-09-07 | 0.02‒0.08 | 0.02‒0.09 | 12 | 30.52‒36.72 | 276.60‒118.17 | 20.93 | ||||
| 总均值 Mean | 0.01‒0.12 | 0.02‒0.29 | 36 | 29.79‒37.81 | 342.22‒1179.54 | 24.89 | ||||
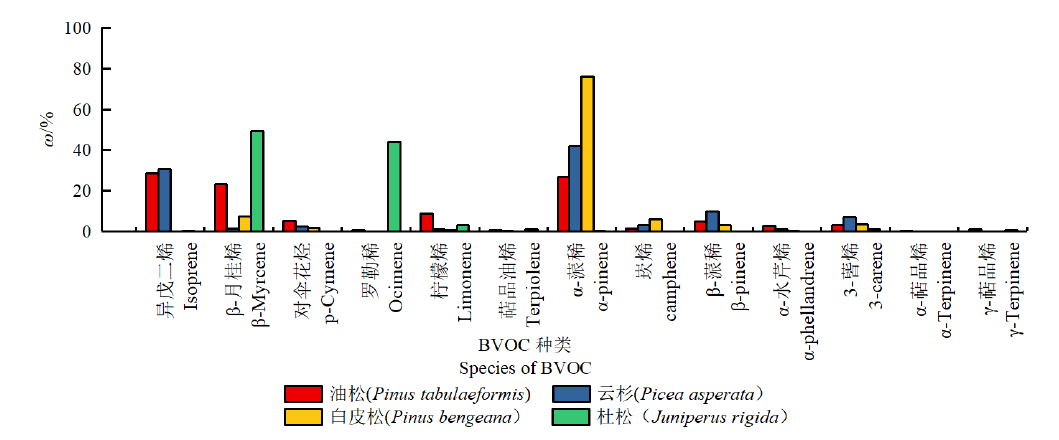
图2 不同绿化树种BVOC排放量相对含量
Fig. 2 Relative content of BVOC emission from different landscape trees
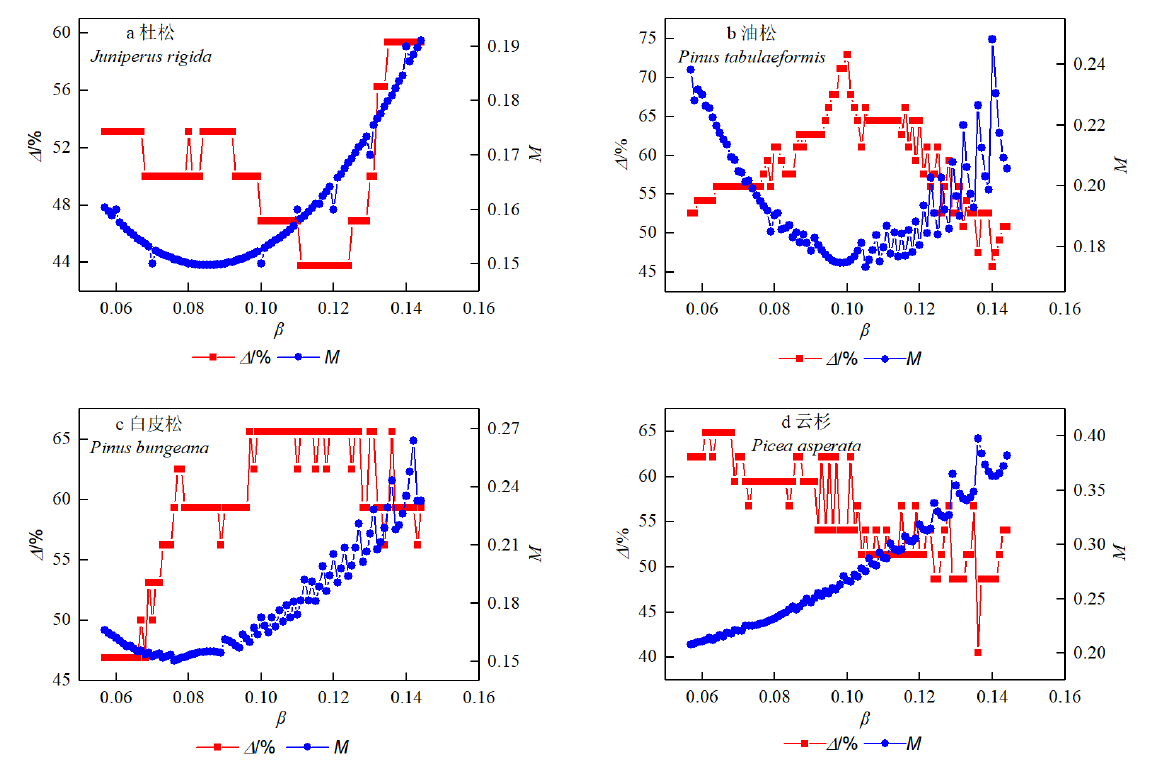
图3 杜松、油松、白皮松和云杉排放单萜烯的G93模式最佳的β值的选择 β为G93模式中的经验系数;Δ%值为预测数据所能解释的(离散度<0.09)实测数据占总数据量的百分比;M值为归一化均方误差
Fig. 3 Selection of optimal β value in G93 model of Monoterpene emission from four trees (Juniperus rigida, Pinus tabulaeformis, Pinus bengeana, Picea asperata) β is empirical coefficient in G93 model; Δ% is the percentage of experimental data accounted for by the predicted data (dispersion<0.09); M is normalized mean squared error
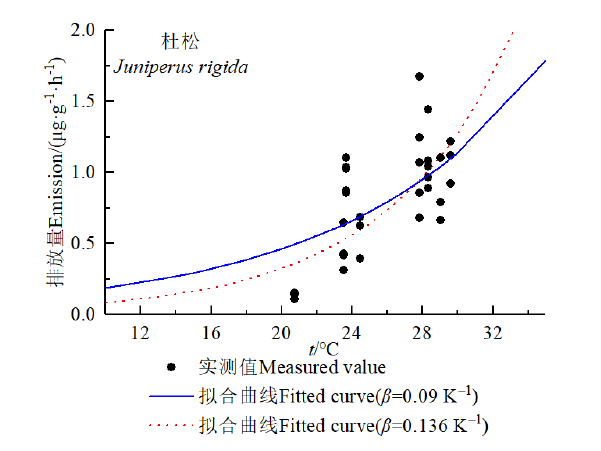
图4 杜松排放单萜烯实测值与G93模式(β=0.09 K-1、β=0.136 K-1)预测值拟合曲线
Fig. 4 Fitted curve of the measured data and the predicted values (with G93 model, β=0.09 K-1, β=0.136 K-1) of monoterpene
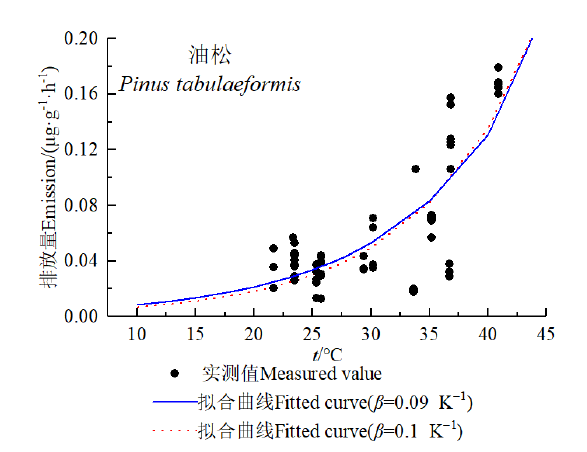
图5 油松排放单萜烯实测值与G93模式(β=0.09 K-1、β=0.10 K-1)预测值拟合曲线
Fig. 5 Fitted curve of the measured data and the predicted values (with G93 model, β=0.09 K-1, β=0.10 K-1) of monoterpene emissions from Pinus tabulaeformis
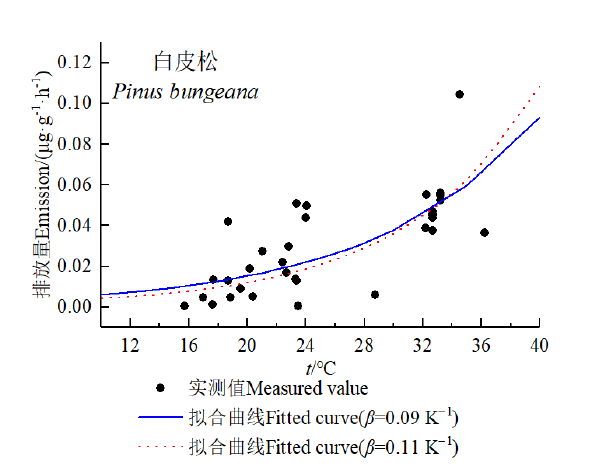
图6 白皮松排放单萜烯实测值与G93模式(β=0.09 K-1、β=0.11 K-1)预测值拟合曲线
Fig. 6 Fitted curve of the measured data and the predicted values (with G93 model, β=0.09 K-1, β=0.11 K-1) of monoterpene emissions from Pinus bungeana
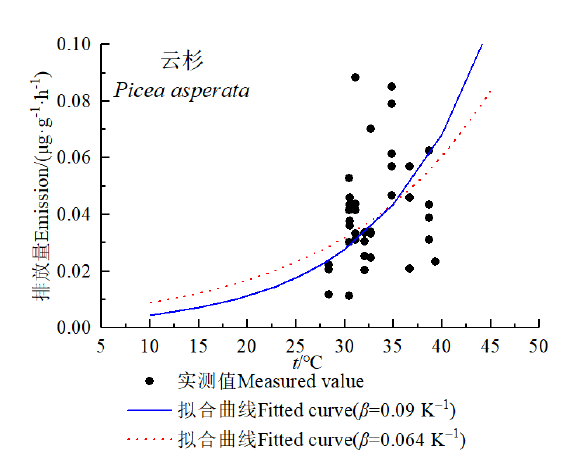
图7 云杉排放单萜烯实测值与G93模式(β=0.09K-1、β=0.064 K-1)预测值拟合曲线
Fig. 7 Fitted curve of the measured data and the predicted values (with G93 model, β=0.09 K-1, β=0.064 K-1) of monoterpene emissions from Picea asperata
| 树种 Tree species | BVOC/(μg∙g-1∙h-1) | 有效采样数据 Valid sampling data | 文献值 The literature data/(μg∙g-1∙h-1) | ||
|---|---|---|---|---|---|
| 异戊二烯 Isoprene | 单萜烯类 Monoterpenes | 异戊二烯 Isoprene | 单萜烯类 Monoterpenes | ||
| 杜松 Juniperus rigida | 0.05 | 1.85 | 36 | ‒ | ‒ |
| 油松 Pinus tabulaeformis | 0.02 | 0.57 | 72 | 0.1b, 0.4±0.1a | 3b, 19.0±4.5a |
| 白皮松 Pinus bengeana | 0 | 0.09 | 72 | 0a | 1.2a |
| 云杉 Picea asperata | 0.03 | 0.08 | 36 | 0.32c, 0.3‒1.8d | 0.5c, 0.2‒7.8d |
表2 呼和浩特市不同绿化树种标准状态(303 K,PAR,1000 μmol∙m-2∙s-1)下BVOC排放量及文献值
Table 2 BVOC emissions from different landscape trees at standard condition (303 K, PAR, 1000 μmol∙m-2∙s-1) in Hohhot and literature data
| 树种 Tree species | BVOC/(μg∙g-1∙h-1) | 有效采样数据 Valid sampling data | 文献值 The literature data/(μg∙g-1∙h-1) | ||
|---|---|---|---|---|---|
| 异戊二烯 Isoprene | 单萜烯类 Monoterpenes | 异戊二烯 Isoprene | 单萜烯类 Monoterpenes | ||
| 杜松 Juniperus rigida | 0.05 | 1.85 | 36 | ‒ | ‒ |
| 油松 Pinus tabulaeformis | 0.02 | 0.57 | 72 | 0.1b, 0.4±0.1a | 3b, 19.0±4.5a |
| 白皮松 Pinus bengeana | 0 | 0.09 | 72 | 0a | 1.2a |
| 云杉 Picea asperata | 0.03 | 0.08 | 36 | 0.32c, 0.3‒1.8d | 0.5c, 0.2‒7.8d |
| [1] |
AYDIN Y M, YAMAN B, KOCA H, et al., 2014. Biogenic volatile organic compound (BVOC) emissions from forested areas in Turkey: Determination of specific emission rates for thirty-one tree species[J]. Science of the Total Environment, 490: 239-253.
DOI URL |
| [2] |
BAI J H, GUENTHER A, TUMIPSEED A, et al., 2016. Seasonal variations in whole-ecosystem BVOC emissions from a subtropical bamboo plantation in China[J]. Atmospheric Environment, 124: 12-21.
DOI URL |
| [3] |
BENJAMIN M T, WINER A M, 1997. Estimating the ozone-forming potential of urban trees and shrubs[J]. Atmospheric Environment, 32(1): 53-68.
DOI URL |
| [4] | CARTER W P L, 1994. Development of ozone reactivity scales for volatile organic compounds[J]. Air & Waste manage, 44(7): 881-899. |
| [5] |
DEMENT W B, TYSON and MONEY H, 1975. Mechanism of monoterpene volatilization in Salvia mellifera[J]. Phytochemistry, 14(12): 2555-2557.
DOI URL |
| [6] | EVANS R C, TINGEY D T, GUMPERTZ M L, et al., 1985. Interspecies Variation in Terpenoid Emissions from Engelmann and Sitka Spruce Seedlings[J]. Forest Science, 31(1): 132-142. |
| [7] |
GERON C, DALY R, HARLEY P, et al., 2016. Large drought-induced variations in oak leaf volatile organic compound emissions during PINOT NOIR 2012 [J]. Chemosphere, 146: 8-21.
DOI URL |
| [8] |
GERON C, GUENTHER O A, GREENBERG J, et al., 2006. Volatile organic compounds from vegetation in southern Yunnan Province, China: Emission rates and some potential regional implications[J]. Atmospheric Environment, 40(10): 1759-1773.
DOI URL |
| [9] |
GUENTHER A B, ZIMMERMAN P R, HARLEY P C, et al., 1993. Isoprene and monoterpene emission rate variability: Model evaluations and sensitivity analyses[J]. Journal of Geophysical Research Atmospheres, 98(D7): 12609-12617.
DOI URL |
| [10] |
GUENTHER A, ZIMMERMAN P, WILDERMUTH M, 1994. Natural volatile organic compound emission rate estimates for U.S woodland and landscapes[J]. Atmospheric Environment, 28(6): 1197-1210.
DOI URL |
| [11] |
GUENTHER A B, AUGH B, BRASSEUR G, et al., 1999. Isoprene emission estimates and uncertainties for the Central African EXPRESSO study domain[J]. Journal of Geophysical Research, 104(D23): 30625-30639.
DOI URL |
| [12] |
GUENTHER A, GERON C, PIERCE T, et al., 2000. Natural emissions of non-methane volatile organic compounds, carbon monoxide, and oxides of nitrogen from North America[J]. Atmospheric Environment, 34(12-14): 2205-2230.
DOI URL |
| [13] |
GUENTHER A, HEWITT C, ERICKSON D, 1995. A global model of natural volatile organic compound emissions[J]. Journal of Geophysical Research, 100(D5): 8873-8892.
DOI URL |
| [14] |
GUENTHER A, MONSON R, FALL R, 1991. Isoprene and monoterpene emission rate variability: Observations with eucalyptus and emission rate algorithm development[J]Journal of Geophysical Research, 96(D6): 10799-10808.
DOI URL |
| [15] | GRABMER W, KREUZWIESER J, WISTHALER A C, et al., 2006. VOC emissions from Norway spruce (Picea abies L. [Karst]) twigs in the field—Results of a dynamic enclosure study [J]. Atmospheric Environment, 40(Suppl 1): 128-137. |
| [16] | ISIDOROV V A, ZENKEVICH IG, IOFFE B V, 1985. Volatile organic compounds in the atmosphere of forests[J]. Atmospheric Environment, 19(1): 1-8. |
| [17] |
JUUTI S, AREY J, ATKINSON R, 1990. Monoterpene emission rate measurements from a Monterey Pine[J]. Journal of Geophysical Research, 95(D6): 7515-7519.
DOI URL |
| [18] |
KESSELMEIER J, STAUDT M, 1999. Biogenic volatile organic compounds (VOC): An overview on emission, physiology and ecology[J]. Journal of Atmospheric Chemistry, 33: 23-88.
DOI URL |
| [19] |
LAOTHAWORNKITKUL J, TAYLOR J E, PAUL N D, et al., 2009. Biogenic volatile organic compounds in the Earth system[J]. New Phytologist, 183(1): 27-51.
DOI URL |
| [20] |
LI L Y, XIE S D, 2014. Historical variations of biogenic volatile organic compound emission inventories in China, 1981-2003 [J]. Atmospheric Environment, 95(1): 185-196.
DOI URL |
| [21] |
LIM Y J, ARMENDARIZ J, SON Y S, et al., 2011. Seasonal variations of isoprene emissions from five oak tree species in East Asia[J]. Atmospheric Environment, 45(13): 2202-2210.
DOI URL |
| [22] |
MATSUNAGA S N, NIWA S, MOCHIZUKI T, et al., 2013. Seasonal variation in basal emission rates and composition of mono- and sesquiterpenes emitted from dominant conifers in Japan[J]. Atmospheric Environment, 69(3): 124-130.
DOI URL |
| [23] |
ORTEGA J, HELMIG D, DALY R W, et al., 2008. Approaches for quantifying reactive and low-volatility biogenic organic compound emissions by vegetation enclosure techniques—Part B: Applications[J]. Chemosphere, 72(3): 365-380.
DOI URL |
| [24] | PIERCE T, WALDRUFF P, 1991. PC-BEIS: A personal computer version of the biogenic emissions inventory system[J]. Journal of the Air & Waste Management Association, 41(7): 937-941. |
| [25] |
ROSELLE S J, PIERCET E, SCHERE K L, 1991. The sensitivity of regional ozone modeling to biogenic hydrocarbons[J]. Journal of Geophysical Research, 96(D4): 7371-7394.
DOI URL |
| [26] |
SIMPSON D, WINIWARTER W, BRIESSON G, 1999. Inventorying emissions from nature in Europe[J]. Journal of Geophysical Research, 104(D7): 8113-8152.
DOI URL |
| [27] |
TINGEY D T, EVANS R, GUMPERTZ M, 1981. Effects of environmental conditions on isoprene emission from live oak[J]. Planta, 152(6): 565-570.
DOI URL |
| [28] |
WANG T, XUE L K, BRIMBLECOMBE P, et al., 2017. Ozone pollution in China: A review of concentrations meteorological influences chemical precursors and effects[J]. Science of the Total Environment, 575: 1582-1596.
DOI URL |
| [29] | ZARE A, CHRISTENSEN J H, GROSS A, et al., 2013. Quantifying the contributions of natural emissions to ozone and total fine PM concentrations in the Northern Hemisphere[J]. Atmospheric Chemistry & Physics, 13(6): 16775-16830. |
| [30] | 白建辉 GUENTHER A, TUMIPSEED A, 2012. 长白山温带森林单萜烯排放模拟[J]. 环境科学学报, 32(9): 2236-2244. |
| BAI J H, GUENTHER A, TUMIPSEED A, 2012. Simulation of monoterpene emission in a temperate forest on Changbai Mountain[J]Acta Scientiae Circumstantiae, 32(9): 2236-2244. | |
| [31] | 郭阿君, 岳桦, 2003. 观赏植物挥发性的研究[J]. 北方园艺 (6): 36-37. |
| GUO A J, YUE H, 2003. Study on volatiles of ornamental plants[J]. Northern Horticulture (6): 36-37. | |
| [32] | 崔佳奇, 刘宏涛, 陈媛媛, 2021. 中国城市建成区绿化覆盖率变化特征及影响因素分析[J]. 生态环境学报, 30(2): 331-339. |
| CUI J Q, LIU H T, CHEN Y Y, 2021. Changes in green coverage rate of urban built-up areas in China and influencing factors[J]. Ecology and Environmental Sciences, 30(2): 331-339. | |
| [33] | 高素莲, 闫学军, 刘光辉, 等, 2020. 济南市夏季臭氧重污染时段VOCs污染特征及来源解析[J]. 生态环境学报, 29(9): 1839-1846. |
| GAO S L, YAN X J, LIU G H, et al., 2020. Characteristics and Source Apportionment of Ambient VOCs in Serious Ozone Pollution Period of Summer in Ji'nan[J]. Ecology and Environmental Sciences, 29(9): 1839-1846. | |
| [34] | 黄爱葵, 李楠, GUENTHER A, 等, 2011. 深圳市显著排放VOCs的园林植物调查与分析[J]. 环境科学, 32(12): 3555-3559. |
| HUANG A K, LI N, GUENTHER A, et al., 2011. Investigation on emission properties of biogenic VOCs of landscape plants in Shenzhen[J]. Environmental Science, 32(12): 3555-3559. | |
| [35] | 孔琴心, 刘广仁, 李桂忱, 1999. 近地面臭氧浓度变化及其对人体健康的可能影响[J]. 气候与环境研究, 4(1): 61-66. |
| KONG Q X, LIU G R, LI G C, 1999. Surface Ozone Concentration Variation and Possible Influences on Human Health[J]. Climatic and Environmental Research 4(1): 61-66. | |
| [36] | 李德文, 史奕, 何兴元, 2008. O3浓度升高对银杏及油松BVOCs排放的影响[J]. 环境科学, 29(2): 300-304. |
| LI D W, SHI Y, HE X Y, 2008. Effects of Elevated O3 on the Volatile Organic Compounds Emit from Ginkgo biloba and Pinus tabulaeformis[J]. Environmental Science, 29(2): 300-304. | |
| [37] | 李俊仪, 田梁宇, 伦小秀, 等, 2017. 北京地区植物源挥发性有机物(BVOCs) 排放清单[J]. 环境化学, 36(4): 776-786. |
| LI J Y, TIAN L Y, LUN X X, et al., 2017. Emission inventory of botanical volatile organic compounds (BVOCs) in Beijing[J]. Environmental Chemistry, 36(4): 776-786. | |
| [38] | 李少宁, 鲁绍伟, 赵云阁, 等, 2019. 北京典型天气下的4种阔叶树种液流特征及其影响因素[J]. 生态与农村环境学报, 35(2): 189-196. |
| LI S N, LU S W, ZHAO Y G, et al., 2019. Characteristics and influencing factors in sap flow of four broadleaved tree species for typical weather conditions of Beijing[J]. Ecology and Environmental Sciences, 35(2): 189-196. | |
| [39] | 牟玉静, 宋文质, 张晓山, 等, 1999. 落叶阔叶树异戊二烯排放研究[J]. 环境化学, 18(2): 21-27. |
| MOU Y J, SONG W Z, ZHANG X S, et al., 1999. Study on emissions of isoprene from deciduous and broadleaf trees[J]. Environmental Chemistry, 18(2): 21-27. | |
| [40] | 彭立新, 唐孝炎, 白郁华, 等, 2000. 天然源排放碳氢化合物对广州地区光化学污染的影响[J]. 中国环境科学, 20(2): 132-135. |
| PENG L X, TANG X Y, BAI Y H, et al., 2000. Effect of biogenic hydrocarbon to photochemical pollution in Guangzhou[J]. China Environmental Science, 20(2): 132-135. | |
| [41] | 屈玉, 安俊岭, 2009. 人为源和生物源排放对臭氧的贡献——以春夏季东亚地区为例[J]. 中国环境科学, 29(4): 337-344. |
| QU Y, AN J L, et al., 2009. Total and synergistic impacts of anthropogenic and biogenic emissions on ozone-examples in East Asia in spring and summer[J]. China Environmental Science, 29(4): 337-344. | |
| [42] | 王凤贤, 乔宏龙, 刘小丽, 等, 2019. 基于二类调查的呼和浩特市林地资源动态变化分析[J]. 内蒙古林业调查设计, 42(1): 6-9. |
| WANG F X, QIAO H L, LIU X L, et al., 2019. Dynamic change of forest land resources in Hohhot City based on forest management inventory[J]. Inner Mongolia Forestry Investigation and Design, 42(1): 6-9. | |
| [43] | 王晓华, 包玉荣, 2010. 呼和浩特市建成区园林绿化植物调查与分析[J]. 内蒙古农业大学学报(自然科学版), 31(1): 99-106. |
| WANG X H, BAO Y R, 2010. Hohhot built-up area survey and analysis of landscape plants[J]. Journal of Inner Mongolia Agricultural University (Natural Science Edition), 31(1): 99-106. | |
| [44] | 王志辉, 张树宇, 陆思华, 等, 2003. 北京地区植物VOCs排放速率的测定[J]. 环境科学, 24(2): 7-12. |
| WANG Z H, ZHANG S Y, LU S H, et al., 2003. Screenings of 23 Plant Species in Beijing for Volatile Organic Compound Emissions[J]. Environmental Science, 24(2): 7-12. | |
| [45] | 肖悦, 田永中, 许文轩, 等, 2018. 中国城市大气污染特征及社会经济影响分析[J]. 生态环境学报, 27(3): 518-526. |
| XIAO Y, TIAN Y Z, XU W X, et al., 2018. Study on the Spatiotemporal Characteristics and Socioeconomic Driving Factors of Air Pollution in China[J]. Ecology and Environmental Sciences, 27(3): 518-526. | |
| [46] | 闫美霖, 李湉湉, 刘晓途, 2012. 我国臭氧短期暴露的人群健康效应研究进展[J]. 环境与健康, 29(8): 752-761. |
| YAN M L, LI T T, LIU X T, 2012. Human health effects of short-term ozone exposure: A review of Chinese epidemiological evidence[J]. Journal of Environment and Health, 29(8): 752-761. | |
| [47] | 阎秀峰, 2001. 植物次生代谢生态学[J]. 植物生态学报, 25(5): 639-640. |
| YAN X F, 2001. Ecology of plant secondary metabolism[J]. Chinese Journal of Plant Ecology, 25(5): 639-640. |
| [1] | 韩翠, 康扬眉, 余海龙, 李冰, 黄菊莹. 荒漠草原凋落物分解过程中降水量对土壤酶活性的影响[J]. 生态环境学报, 2022, 31(9): 1802-1812. |
| [2] | 赵晓亮, 郭猛, 吕美婷, 赵雪莹, 姜瑰国, 黄媛媛, 王凡, 姬亚芹. 阜新市绿化树种对大气颗粒物及重金属滞留能力研究[J]. 生态环境学报, 2021, 30(8): 1662-1671. |
| [3] | 刘旻霞, 于瑞新, 穆若兰, 夏素娟. 兰州北山不同海拔3种典型绿化树种光合特性研究[J]. 生态环境学报, 2021, 30(10): 1943-1951. |
| 阅读次数 | ||||||
|
全文 |
|
|||||
|
摘要 |
|
|||||