Ecology and Environment ›› 2024, Vol. 33 ›› Issue (8): 1306-1317.DOI: 10.16258/j.cnki.1674-5906.2024.08.015
• Research Article [Environmental Science] • Previous Articles Next Articles
AO Yong1,2,3,*( ), ZHANG Long1, WANG Xiaofeng1,2,3, WU Yanyun1, TANG Bingqian1, ZHANG Yiheng1
Received:2024-03-30
Online:2024-08-18
Published:2024-09-25
奥勇1,2,3,*(), 张龙1, 王晓峰1,2,3, 吴彦芸1, 唐冰倩1, 张亦恒1
通讯作者:
作者简介:奥勇(1965年生),男,副教授,博士,主要从事GIS与遥感方面的教学和研究。E-mail: aoyong@chd.edu.cn
基金资助:CLC Number:
AO Yong, ZHANG Long, WANG Xiaofeng, WU Yanyun, TANG Bingqian, ZHANG Yiheng. Carbon Accounting and Evolution Pattern Analysis of Land Use Changes in Shaanxi Province from the “Nature-Society” Perspective[J]. Ecology and Environment, 2024, 33(8): 1306-1317.
奥勇, 张龙, 王晓峰, 吴彦芸, 唐冰倩, 张亦恒. 基于“自然-社会”视角的陕西省土地利用变化碳核算与演变格局分析[J]. 生态环境学报, 2024, 33(8): 1306-1317.
Add to citation manager EndNote|Ris|BibTeX
URL: https://www.jeesci.com/EN/10.16258/j.cnki.1674-5906.2024.08.015

Figure 1 Geographical map of Shaanxi Province

Figure 2 Research framework
| 类型 | 原煤 | 焦炭 | 原油 | 汽油 | 煤油 | 柴油 | 天然气 | 电力 |
|---|---|---|---|---|---|---|---|---|
| 转换标准煤系数 | 0.714 | 0.971 | 1.43 | 1.47 | 1.47 | 1.46 | 1.33 | 1.23 |
| 碳含量因子 | 0.756 | 0.855 | 0.585 | 0.553 | 0.571 | 0.592 | 0.448 | 0.272 |
| 氧化率因子 | 0.940 | 0.930 | 0.980 | 0.980 | 0.980 | 0.980 | 0.990 | 1.00 |
Table 1 Table of carbon emission factors of various energy sources in society
| 类型 | 原煤 | 焦炭 | 原油 | 汽油 | 煤油 | 柴油 | 天然气 | 电力 |
|---|---|---|---|---|---|---|---|---|
| 转换标准煤系数 | 0.714 | 0.971 | 1.43 | 1.47 | 1.47 | 1.46 | 1.33 | 1.23 |
| 碳含量因子 | 0.756 | 0.855 | 0.585 | 0.553 | 0.571 | 0.592 | 0.448 | 0.272 |
| 氧化率因子 | 0.940 | 0.930 | 0.980 | 0.980 | 0.980 | 0.980 | 0.990 | 1.00 |

Figure 3 Fitting relationship between carbon emission and total value of night light
| 年份 | 绝对误差/106 t | 相对误差/% |
|---|---|---|
| 2002 | 1.18 | 4.21 |
| 2007 | 2.10 | 3.19 |
| 2012 | 4.34 | 3.55 |
| 2017 | 13.3 | 6.93 |
| 2022 | 16.9 | 8.79 |
Table 2 The fitting precision of carbon emission and total night light value
| 年份 | 绝对误差/106 t | 相对误差/% |
|---|---|---|
| 2002 | 1.18 | 4.21 |
| 2007 | 2.10 | 3.19 |
| 2012 | 4.34 | 3.55 |
| 2017 | 13.3 | 6.93 |
| 2022 | 16.9 | 8.79 |

Figure 4 Spatial distribution of land use types in Shaanxi Province from 2002 to 2022
| 土地利用类型 | 2002年面积/ 105 hm2 | 2002-2012年变化率/ % | 2012年面积/ 105 hm2 | 2012-2022年变化率/ % | 2022年面积/ 105 hm2 | 2002-2022年变化率/ % |
|---|---|---|---|---|---|---|
| 耕地 | 59.9 | −9.60 | 54.2 | −3.69 | 52.2 | −12.9 |
| 林地 | 84.6 | 6.57 | 90.2 | 5.47 | 95.1 | 12.4 |
| 草地 | 55.7 | 0.494 | 55.9 | −7.20 | 51.9 | −6.74 |
| 水域 | 0.570 | 11.3 | 0.634 | 2.07 | 0.647 | 13.6 |
| 建设用地 | 2.79 | 47.9 | 4.13 | 32.5 | 5.46 | 95.9 |
| 未利用地 | 1.94 | −75.7 | 0.472 | −54.7 | 0.214 | −89.0 |
Table 3 Land use type area change in Shaanxi Province from 2002 to 2022
| 土地利用类型 | 2002年面积/ 105 hm2 | 2002-2012年变化率/ % | 2012年面积/ 105 hm2 | 2012-2022年变化率/ % | 2022年面积/ 105 hm2 | 2002-2022年变化率/ % |
|---|---|---|---|---|---|---|
| 耕地 | 59.9 | −9.60 | 54.2 | −3.69 | 52.2 | −12.9 |
| 林地 | 84.6 | 6.57 | 90.2 | 5.47 | 95.1 | 12.4 |
| 草地 | 55.7 | 0.494 | 55.9 | −7.20 | 51.9 | −6.74 |
| 水域 | 0.570 | 11.3 | 0.634 | 2.07 | 0.647 | 13.6 |
| 建设用地 | 2.79 | 47.9 | 4.13 | 32.5 | 5.46 | 95.9 |
| 未利用地 | 1.94 | −75.7 | 0.472 | −54.7 | 0.214 | −89.0 |
| 2002年 | 2022年 | ||||||
|---|---|---|---|---|---|---|---|
| 耕地 | 林地 | 草地 | 水域 | 建设用地 | 未利用地 | 期间减少 | |
| 耕地 | 439 | 68.3 | 6.66 | 1.26 | 24.1 | 0.060 | 160 |
| 林地 | 14.3 | 830 | 1.62 | 0.007 | 0.100 | 0.001 | 16.1 |
| 草地 | 66.1 | 52.6 | 434 | 0.286 | 2.72 | 0.969 | 123 |
| 水域 | 0.930 | 0.013 | 0.087 | 3.99 | 0.618 | 0.056 | 1.71 |
| 建设用地 | 0.245 | 0.001 | 0.011 | 0.873 | 26.8 | 0.001 | 1.13 |
| 未利用地 | 1.15 | 0.001 | 16.9 | 0.050 | 0.298 | 1.05 | 18.4 |
| 期间增加 | 82.8 | 121 | 85.2 | 2.48 | 27.9 | 1.09 | 2055 |
Table 4 Land use transfer matrix of Shaanxi Province from 2002 to 2022 104 hm2
| 2002年 | 2022年 | ||||||
|---|---|---|---|---|---|---|---|
| 耕地 | 林地 | 草地 | 水域 | 建设用地 | 未利用地 | 期间减少 | |
| 耕地 | 439 | 68.3 | 6.66 | 1.26 | 24.1 | 0.060 | 160 |
| 林地 | 14.3 | 830 | 1.62 | 0.007 | 0.100 | 0.001 | 16.1 |
| 草地 | 66.1 | 52.6 | 434 | 0.286 | 2.72 | 0.969 | 123 |
| 水域 | 0.930 | 0.013 | 0.087 | 3.99 | 0.618 | 0.056 | 1.71 |
| 建设用地 | 0.245 | 0.001 | 0.011 | 0.873 | 26.8 | 0.001 | 1.13 |
| 未利用地 | 1.15 | 0.001 | 16.9 | 0.050 | 0.298 | 1.05 | 18.4 |
| 期间增加 | 82.8 | 121 | 85.2 | 2.48 | 27.9 | 1.09 | 2055 |
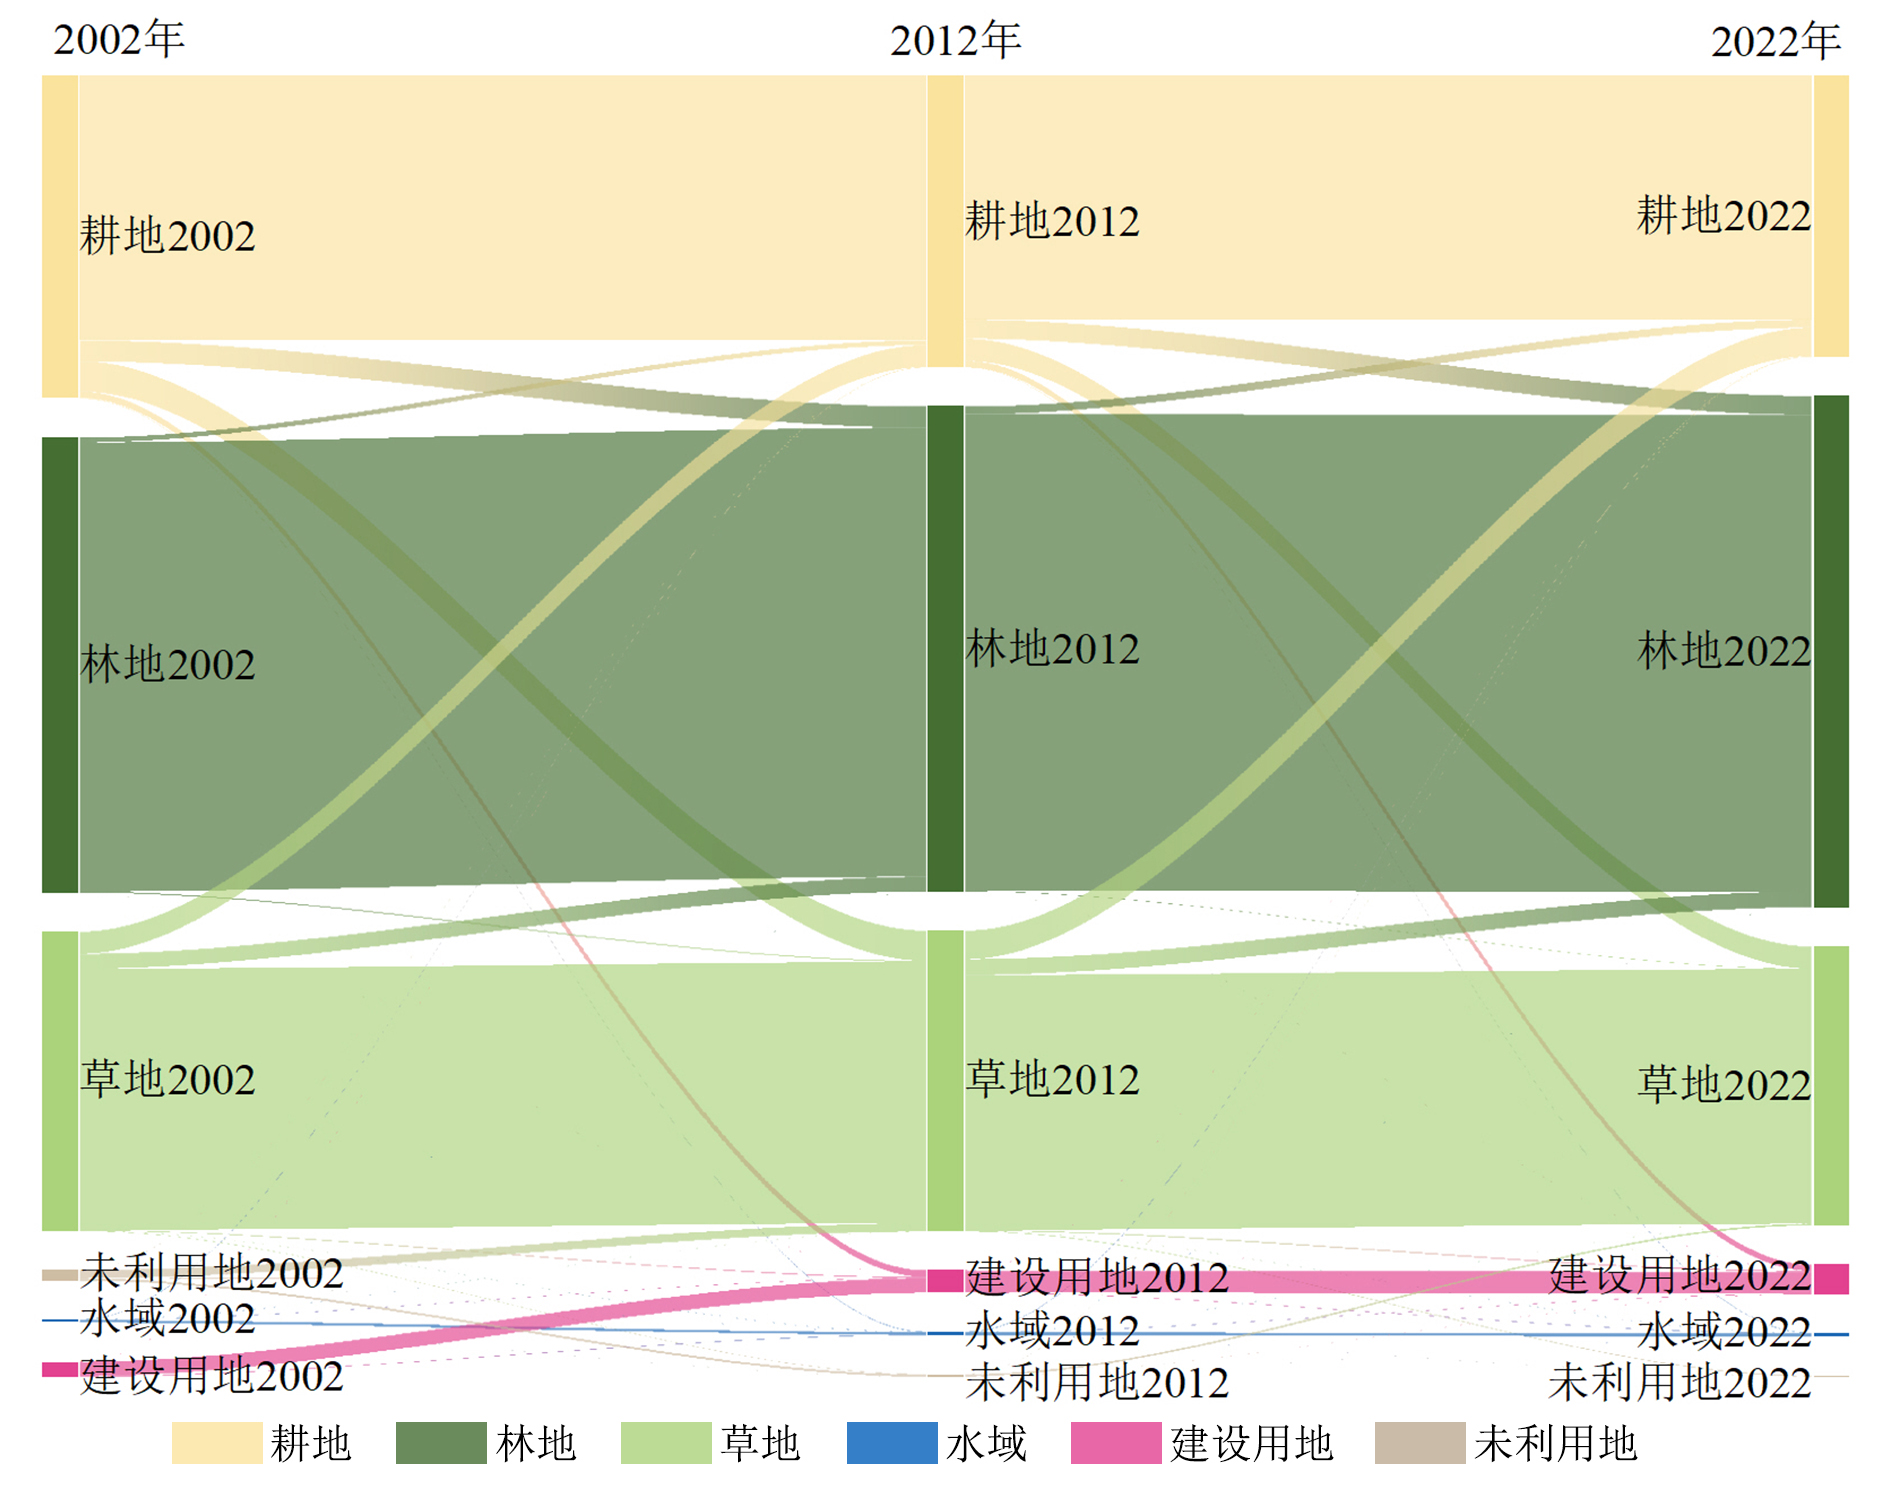
Figure 5 Map of land use transfer in Shaanxi Province from 2002 to 2022
| 年份 | 耕地 | 林地 | 草地 | 建设用地 | 未利用地 | 碳汇量 |
|---|---|---|---|---|---|---|
| 2002 | 4.48 | 6.83 | 3.36 | −0.281 | 0.035 | ‒ |
| 2007 | 4.27 | 7.04 | 3.32 | −0.660 | 0.029 | −0.050 |
| 2012 | 4.05 | 7.43 | 3.38 | −1.22 | 0.009 | 0.215 |
| 2017 | 3.82 | 7.96 | 3.38 | −1.93 | 0.004 | 0.293 |
| 2022 | 3.90 | 8.59 | 3.14 | −1.92 | 0.004 | 0.470 |
Table 5 Carbon sink quantity of different land types in Shaanxi Province from 2002 to 2022 108 t
| 年份 | 耕地 | 林地 | 草地 | 建设用地 | 未利用地 | 碳汇量 |
|---|---|---|---|---|---|---|
| 2002 | 4.48 | 6.83 | 3.36 | −0.281 | 0.035 | ‒ |
| 2007 | 4.27 | 7.04 | 3.32 | −0.660 | 0.029 | −0.050 |
| 2012 | 4.05 | 7.43 | 3.38 | −1.22 | 0.009 | 0.215 |
| 2017 | 3.82 | 7.96 | 3.38 | −1.93 | 0.004 | 0.293 |
| 2022 | 3.90 | 8.59 | 3.14 | −1.92 | 0.004 | 0.470 |
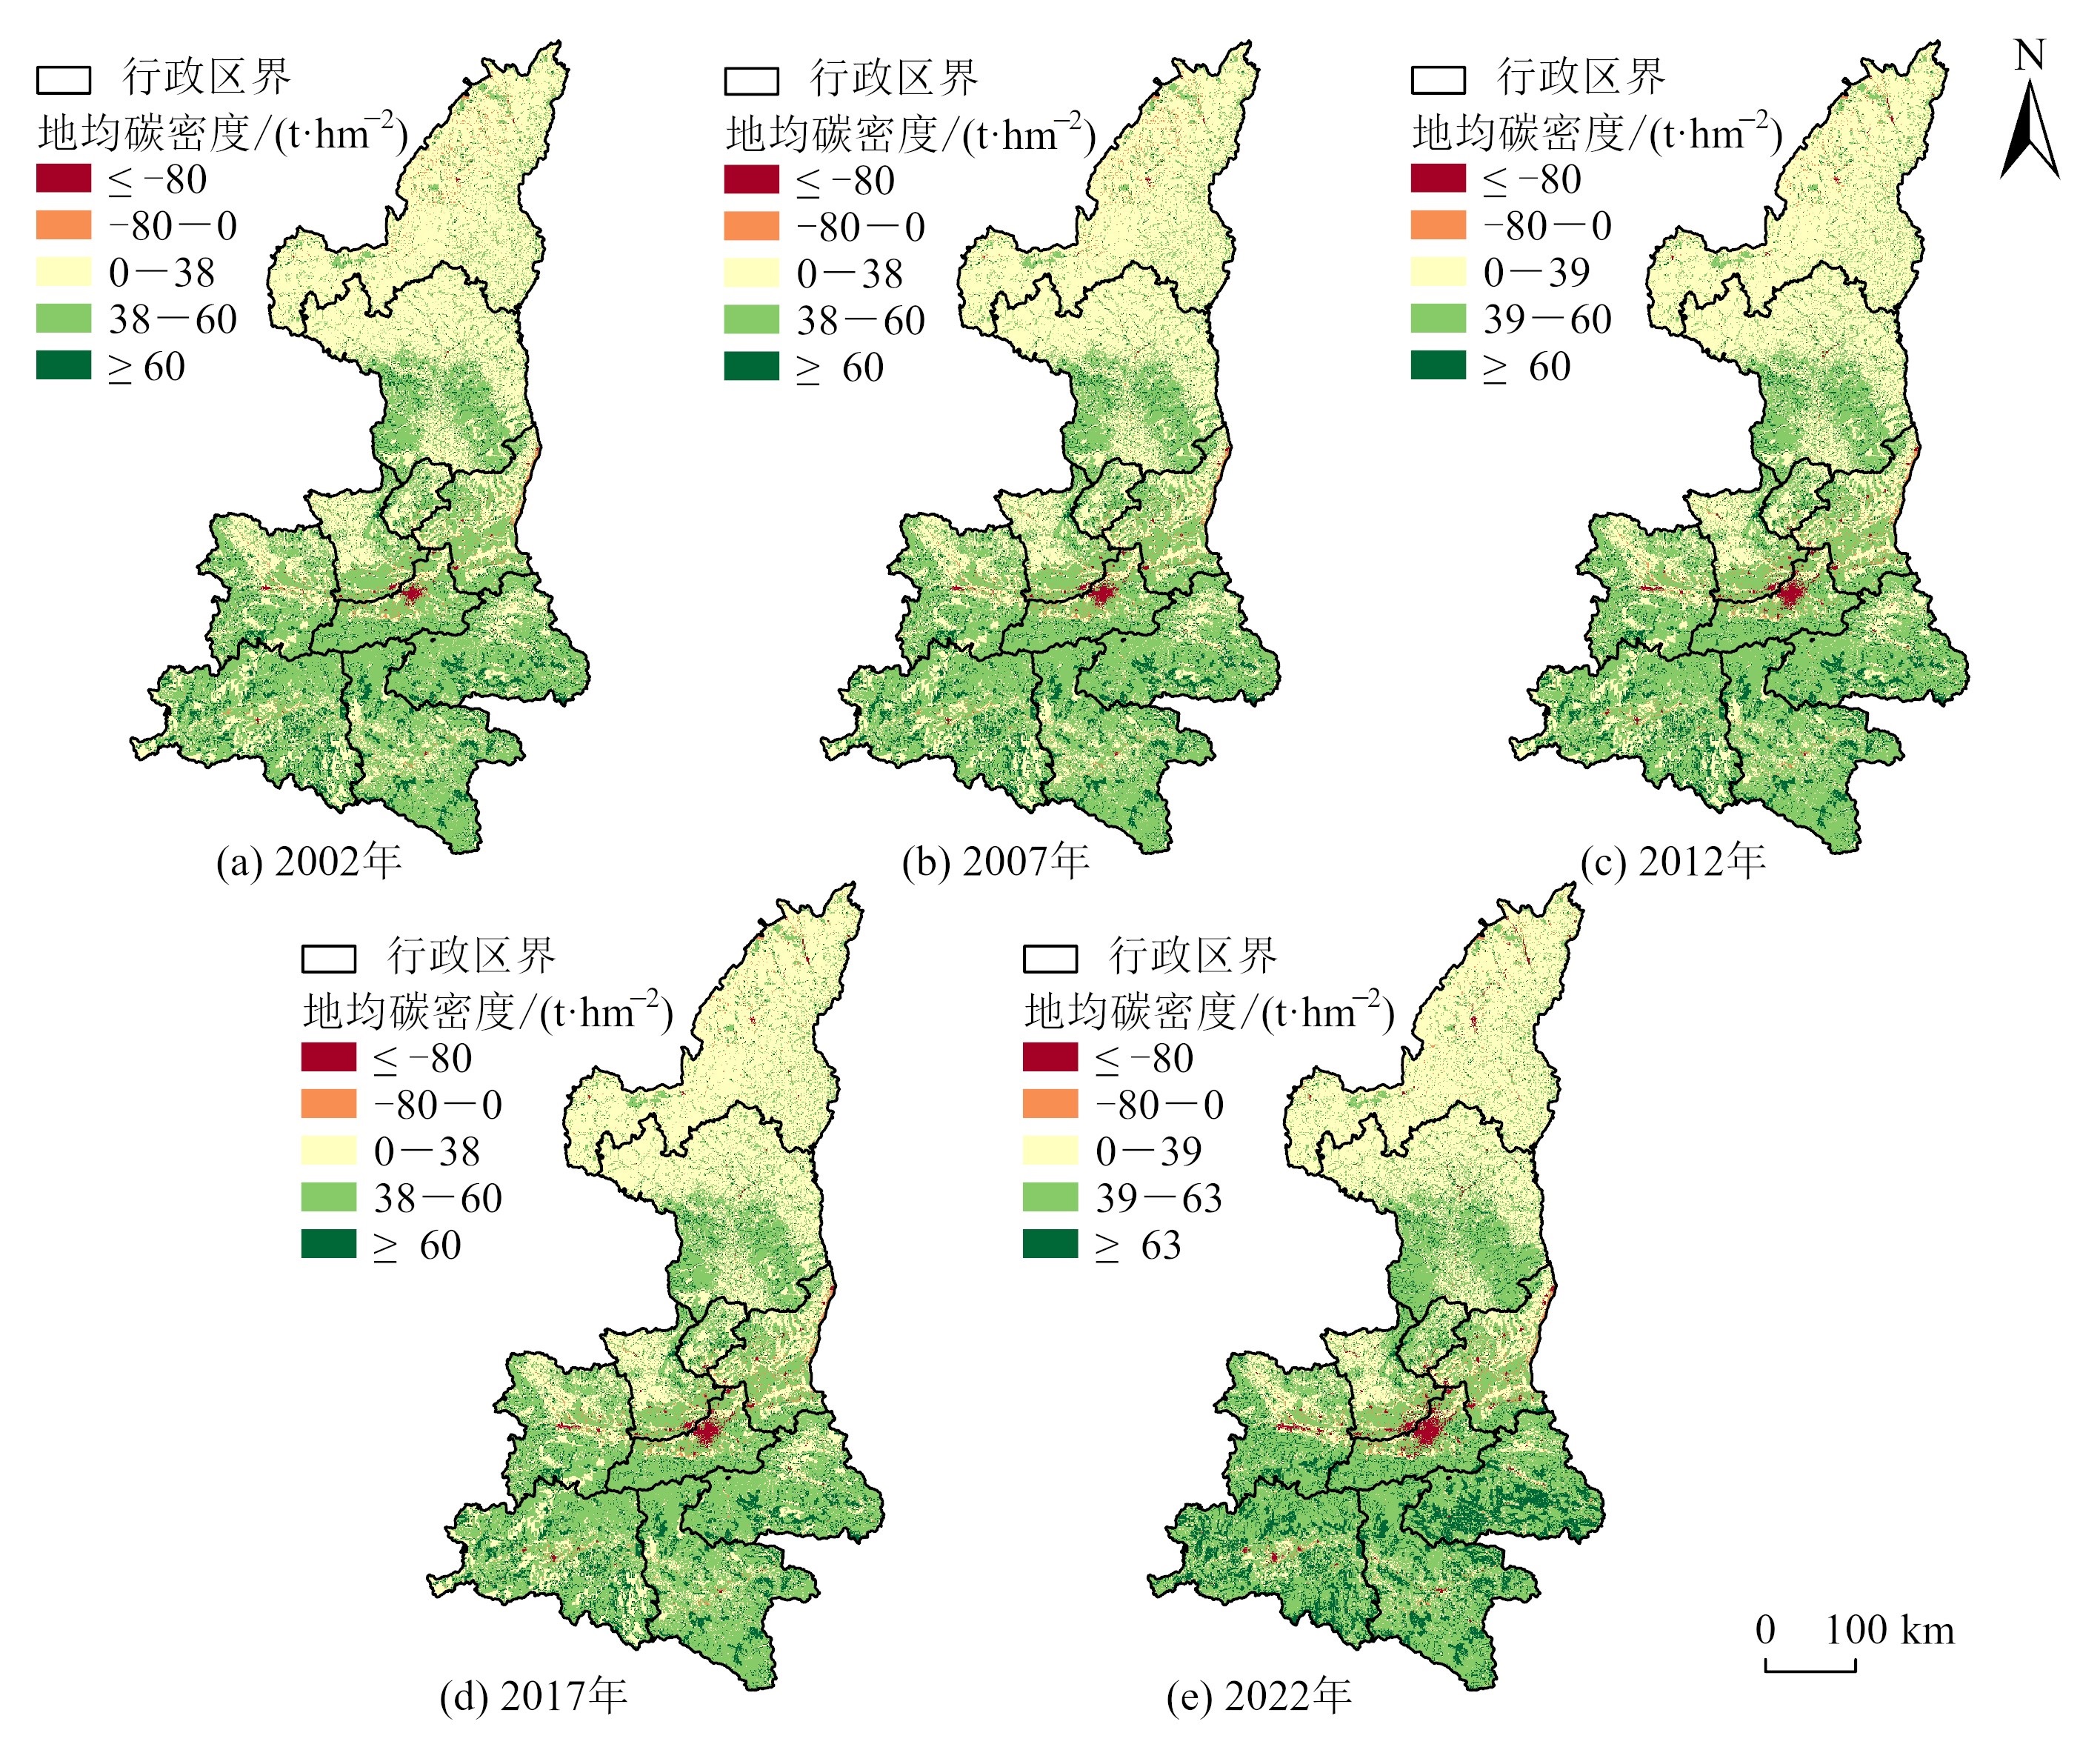
Figure 6 Spatial distribution of carbon density of land use in Shaanxi Province from 2002 to 2022

Figure 7 Characteristics of land use and carbon convergence in Shaanxi Province from 2002 to 2022
| 年份 | 2002 | 2007 | 2012 | 2017 | 2022 |
|---|---|---|---|---|---|
| Moran’s I | 0.520 | 0.563 | 0.546 | 0.562 | 0.557 |
| p值 | 0.000 | 0.000 | 0.000 | 0.000 | 0.000 |
| z值 | 333 | 352 | 360 | 359 | 357 |
Table 6 Statistical table of global Moran's I in Shaanxi Province from 2002 to 2022
| 年份 | 2002 | 2007 | 2012 | 2017 | 2022 |
|---|---|---|---|---|---|
| Moran’s I | 0.520 | 0.563 | 0.546 | 0.562 | 0.557 |
| p值 | 0.000 | 0.000 | 0.000 | 0.000 | 0.000 |
| z值 | 333 | 352 | 360 | 359 | 357 |
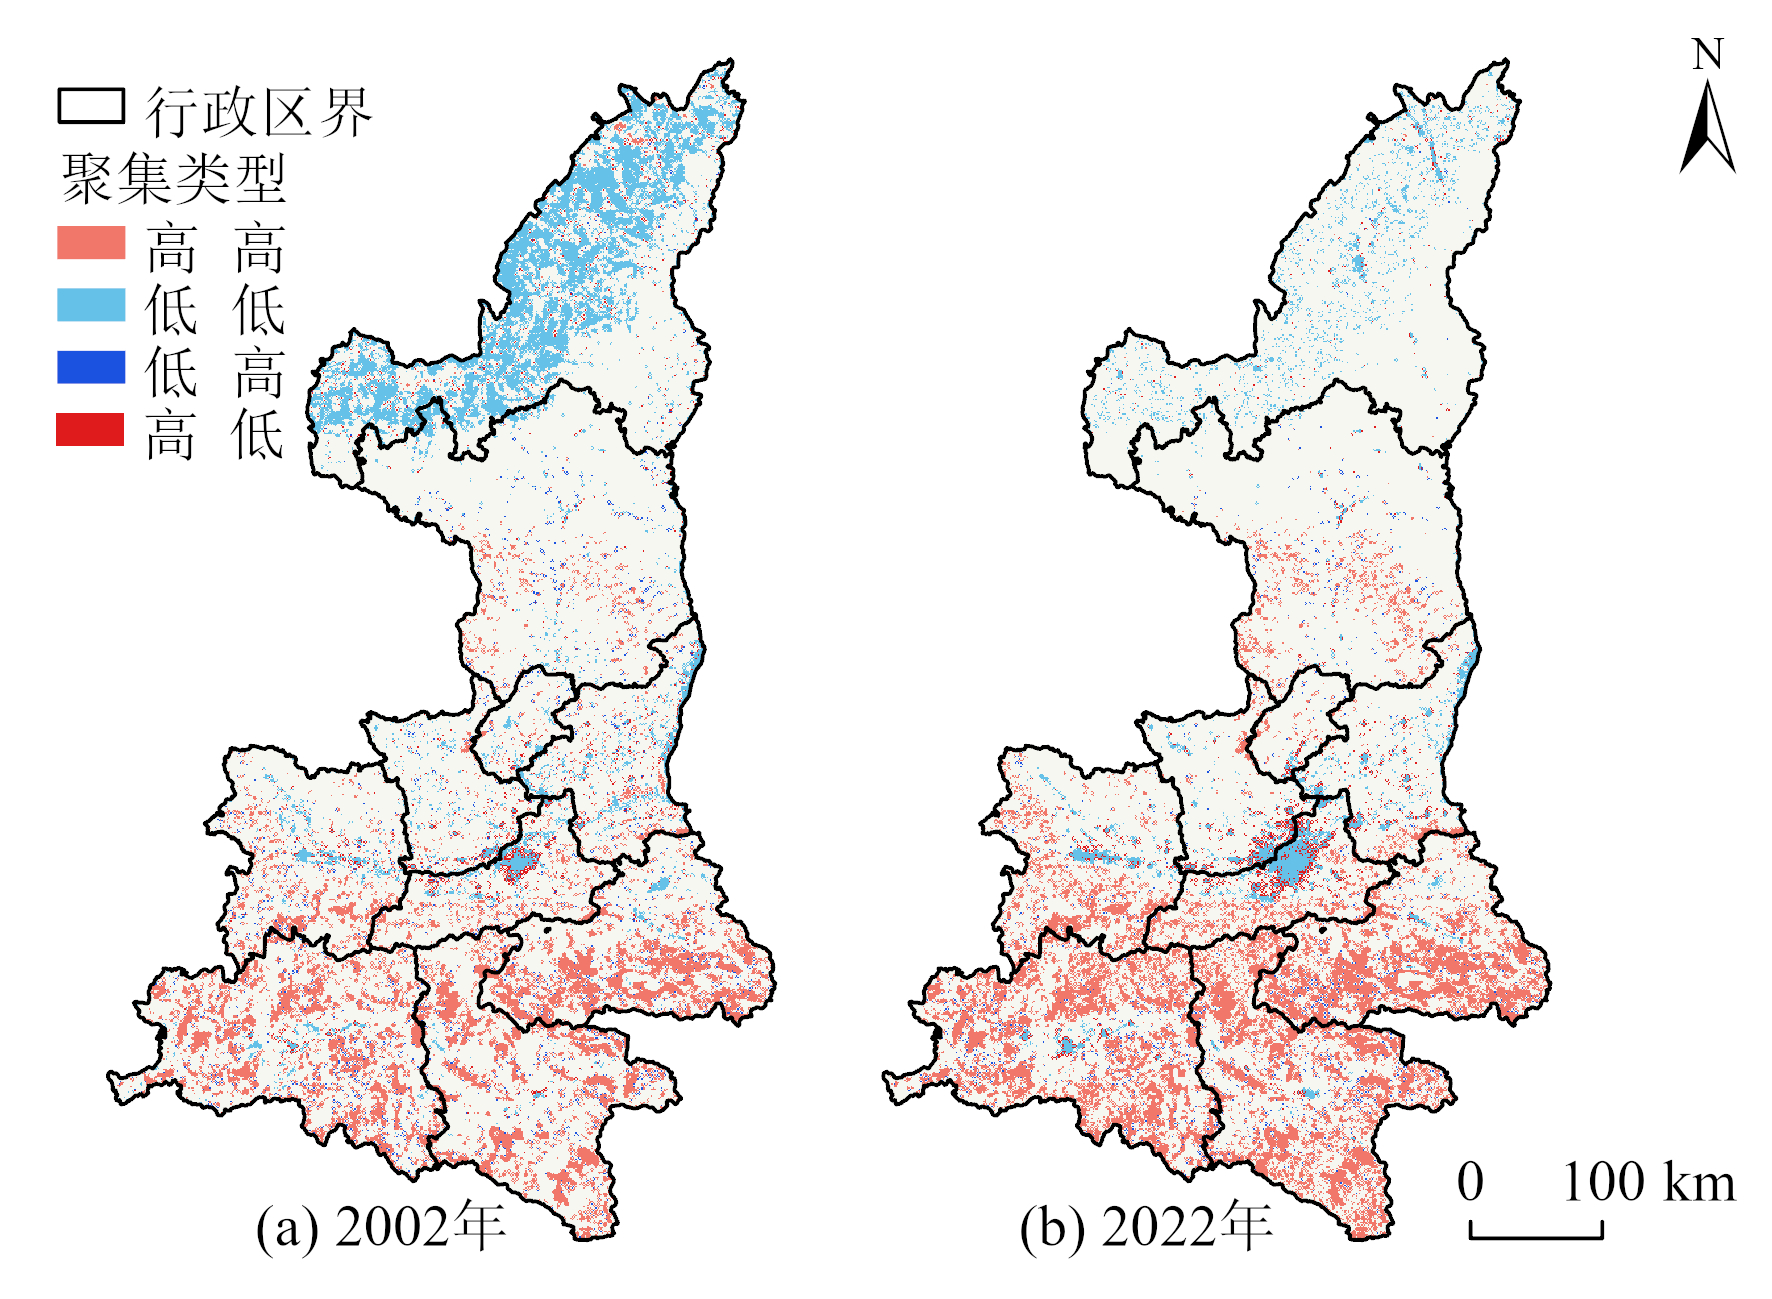
Figure 8 Spatial clustering distribution of carbon in Shaanxi Province from 2002 to 2022
| [1] | CHEN J D, GAO M, CHENG S L, et al., 2020. County-level CO2 emissions and sequestration in china during 1997-2017[J]. Scientific Data, 7(1): 391. |
| [2] | FRIEDLINGSTEIN P, O’SULLIVAN M, JONES M W, et al., 2020. Global carbon budget 2020[J]. Earth System Science Data, 12(4): 3269-3340. |
| [3] | HE Q S, TAN S K, XIE P, et al., 2019. Re-assessing vegetation carbon storage and emissions from land use change in China using surface area[J]. Chinese Geographicial Science, 29(4): 601-613. |
| [4] | HOUGHTON R A, NASSIKAS A A, 2017. Global and regional fluxes of carbon from land use and land cover change 1850-2015[J]. Global Biogeochemical Cycles, 31(3): 456-472. |
| [5] | JANIZADEH S, CHANDRA P S, SAHA A, et al., 2021. Mapping the spatial and temporal variability of flood hazard affected by climate and land-use changes in the future[J]. Journal of Environmental Management, 298: 113551. |
| [6] | KHEZRI M, HESHMATI A, KHODAEI M, 2022. Environmental implications of economic complexity and its role in determining how renewable energies affect CO2 emissions[J]. Applied Energy, 306(Part B): 117948. |
| [7] | LAU H C, RAMAKRISHNA S, ZHANG K, et al., 2021. The role of carbon capture and storage in the energy transition[J]. Energy Fuels, 35(9): 7364-7386. |
| [8] | IEA, 2021. Global energy view 2021[R]. France: International Energy Agency. |
| [9] | IPCC, 2019. Climate change and land: An IPCC special report on climate change, desertification, land degradation, sustainable land management, food security, and greenhouse gas fluxes in terrestrial ecosystems[R]. Geneva: Intergovernmental Panel on Climate Change. |
| [10] | IPCC, 2023. Climate change 2023: Synthesis report[R]. Geneva: Intergovernmental Panel on Climate Change. |
| [11] | SCHUH A E, OTTE M, LAUVAUX T, et al., 2021. Far-field biogenic and anthropogenic emissions as a dominant source of variability in local urban carbon budgets: A global high-resolution model study with implications for satellite remote sensing[J]. Remote Sensing of Environment, 262: 112473. |
| [12] | STEPHENS L, FULLER D, BOIVIN N, et al., 2019. Archaeological assessment reveals Earth’s early transformation through land use[J]. Science, 365: 897-902. |
| [13] | WANG F, SHACKMAN J, LIU X, 2017. Carbon emission flow in the power industry and provincial CO2 emissions: Evidence from cross-provincial secondary energy trading in China[J]. Journal of Cleaner Production, 159: 397-409. |
| [14] | YAO Y T, LI Z J, W T, et al., 2018. A new estimation of China’ snet ecosystem productivity based on eddy covariance measurements and a model tree ensemble approach[J]. Agricultural and Forest Meteorology, 253-254: 84-93. |
| [15] | ZHAO C X, LIU Y L, YAN Z X, 2023. Effects of land-use change on carbon emission and its driving factors in Shaanxi Province from 2000 to 2020[J]. Environmental Science and Pollution Research, 30: 68313-68326. |
| [16] | ZHAO M, ZHOU Y Y, LI X C, et al., 2020. Mapping urban dynamics (1992-2018) in southeast Asia using consistent night time light data from DMSP and VIIRS[J]. Remote Sensing of Environment, 248: 111980. |
| [17] | ZHOU Y, CHEN M X, TANG Z P, et al., 2021. Urbanization, land use change, and carbon emissions: Quantitative assessments for city-level carbon emissions in Beijing-Tianjin-Hebei region[J]. Sustainable Cities and Society, 66: 102701. |
| [18] | 常建波, 付兴涛, 郑美君, 等, 2023. 能源消耗碳排放的时空演变与预测:基于山西省夜间灯光数据[J]. 环境科学与技术, 46(3): 81-89. |
| CHANG J B, FU X T, ZHENG M J, et al., 2023. Temporal and spatial evolution and prediction of energy consumption carbon emissions based on night light data in Shanxi Province[J]. Environmental Science & Technology, 46(3): 81-89. | |
| [19] | 曹周亮, 张欣蓉, 员学锋, 等, 2022. 基于土地利用变化的陕西省县域碳排放时空变化及影响因素研究[J]. 水土保持通报, 42(5): 376-385. |
| CAO Z L, ZHANG X R, YUN X F, et al., 2022. Temporal and spatial changes of county carbon emission and its influencing factors based on land use change in Shaanxi Province[J]. Bulletin of Soil and Water Conservation, 42(5): 376-385. | |
| [20] |
曹子阳, 吴志峰, 匡耀求, 等, 2015. DMSP/OLS夜间灯光影像中国区域的校正及应用[J]. 地球信息科学学报, 17(9): 1092-1102.
DOI |
| CAO Z Y, WU Z F, KUANG Y Q, et al., 2015. Correction of DMSP/OLS night-time light images and its application in China[J]. Journal of Geo-information Science, 17(9): 1092-1102. | |
| [21] |
邓蕾, 上官周平, 2012. 陕西省天然草地生物量空间分布格局及其影响因素[J]. 草地学报, 20(5): 825-835.
DOI |
|
DENG L, SHANGGUAN Z P, 2012. Distribution of natural grassland biomass and its relationship with influencing factors in Shaanxi[J]. Acta Agrestia Sinica, 20(5): 825-835.
DOI |
|
| [22] | 付晓, 张煜星, 王雪军, 2022. 2060年前我国森林生物量碳库及碳汇潜力预测[J]. 林业科学, 58(2): 32-41. |
| FU X, ZHANG Y X, WANG X J, 2022. Prediction of forest biomass carbon pool and carbon sink potential in China before 2060[J]. Scientia Silvae Sinicae, 58(2): 32-41. | |
| [23] | 冯薇, 赵荣钦, 谢志祥, 等, 2023. 碳中和目标下土地利用碳排放效率及其时空格局——以黄河流域72个地级市为例[J]. 中国土地科学, 37(1): 102-113. |
| FENG W, ZHAO R Q, XIE Z X, et al., 2023. Land use carbon emission efficiency and its spatial-temporal pattern under carbon neutral target: A case study of 72 cities in the Yellow River Basin[J]. China Land Science, 37(1): 102-113. | |
| [24] | 国家发展和改革委员会应对气候变化司, 2011. 省级温室气体清单编制指南 (试行)[R]. 北京: 国家发展改革委. |
| Climate Change Division, 2011. Development and reform commission. Guidelines for the preparation of provincial GHG inventories (Trial)[R]. Beijing: Climate Change Division. | |
| [25] | 郝丽, 徐娟娟, 翟园, 等, 2017. 近30 a陕西省森林植被碳储量及其动态变化[J]. 干旱区研究, 2017, 34(05): 1056-1062. |
| HAO L, XU J J, ZHAI Y, et al., 2017. Forest carbon storage and its dynamic change in Shaanxi Province in recent 30 years[J]. Arid Zone Research, 34(5): 1056-1062. | |
| [26] | 李宸宇, 朱建华, 张峰, 等, 2021. 基于NbS的北京市乔木林固碳能力分析[J]. 北京林业大学学报, 43(6): 13-22. |
| LI C Y, ZHU J H, ZHANG F, et al., 2021. Carbon sequestration capacity of Beijing arbor forest based on NbS[J]. Journal of Beijing Forestry University, 43(6): 13-22. | |
| [27] | 李帆, 贾夏, 赵永华, 等, 2023. 基于DPSIR模型的黄土高原生态敏感性演变格局及驱动力分析[J]. 农业工程学报, 39(9): 241-251. |
| LI F, JIA X, ZHAO Y H, et al., 2023. Evolutionary pattern and driving forces of ecological sensitivity in the Loess Plateau using DPSIR model[J]. Transactions of the Chinese Society of Agricultural Engineering, 39(9): 241-251. | |
| [28] | 梁膑月, 曹春, 李锦超, 等, 2023. 近20年兰西城市群生态系统服务价值对土地利用转型的时空响应[J]. 环境科学, 45(6): 3329-3340. |
| LIANG B Y, CAO C, LI J C, et al., 2023. Spatiotemporal response of ecosystem service value to land use change in the Lanzhou-Xining urban agglomeration over the past 20 years[J]. Environmental Science, 45(6): 3329-3340. | |
| [29] |
刘纪远, 宁佳, 匡文慧, 等, 2018. 2010-2015年中国土地利用变化的时空格局与新特征[J]. 地理学报, 73(5): 789-802.
DOI |
|
LIU J Y, NING J, KUANG W H, et al., 2018. Spatio-temporal patterns and characteristics of land-use change in China during 2010-2015[J]. Acta Geographica Sinica, 73(5): 789-802.
DOI |
|
| [30] |
吕国玮, 周建春, 蔡玉梅, 等, 2023. 广东省土地利用及其变化和林业碳核算研究[J]. 地理学报, 78(3): 640-657.
DOI |
|
LÜ G W, ZHOU J C, CAI Y M, et al., 2023. Carbon accounting for land use, land-use change and forestry in Guangdong Province[J]. Acta Geographica Sinica, 78(3): 640-657.
DOI |
|
| [31] | 朴世龙, 何悦, 王旭辉, 等, 2022. 中国陆地生态系统碳汇估算: 方法、进展、展望[J]. 中国科学: 地球科学, 52(6): 1010-1020. |
| PIAO S L, HE Y, WANG X H, et al., 2022. Estimation of China’ sterrestrial ecosystem carbon sink: Methods, progress and prospects[J]. Science China Earth Sciences, 52(6): 1010-1020. | |
| [32] | 苏泳娴, 陈修治, 叶玉瑶, 等, 2013. 基于夜间灯光数据的中国能源消费碳排放特征及机理[J]. 地理学报, 68(11): 1513-1526. |
| SU Y X, CHEN X Z, YE Y Y, et al., 2013. The characteristics and mechanisms of carbon emissions from energy consumption in China using DMSP/S night light imageries[J]. Acta Geographica Sinica, 68(11): 1513-1526. | |
| [33] | 孙欣琪, 张蚌蚌, 柴朝卿, 等, 2022. 沙地整治下榆林土地利用及土壤有机质时空分异特征[J]. 农业工程学报, 38(24): 207-217. |
| SUN X Q, ZHANG B B, CAI C Q, et al., 2022. Spatial-temporal characteristics of land use and soil organic matter in Yulin under sandy land remediation[J]. Transactions of the Chinese Society of Agricultural Engineering, 38(24): 207-217. | |
| [34] | 王丹, 荆延德, 韩善梅, 等, 2022. 基于格网的南四湖流域土地利用碳排放与其生态系统服务价值时空关系分析[J]. 生态学报, 42(23): 9604-9614. |
| WANG D, JING Y D, HAN S M, et al., 2022. Spetial-temporal relationship of land-use carbon emission and ecosystem service value in Nansi Basin based upon a grid square[J]. Acta Ecologica Sinica, 42(23): 9604-9614. | |
| [35] | 王萌辉, 白中科, 董潇楠, 2018. 基于生态系统服务供需的陕西省土地整治空间分区[J]. 中国土地科学, 32(11): 73-80. |
| WANG M H, BAI Z K, DONG X N, 2018. Land consolidation zoning in Shaanxi Province based on the supply and demand of ecosystem services[J]. China Land science, 32(11): 73-80. | |
| [36] |
王天福, 龚直文, 邓元杰, 2022. 基于土地利用变化的陕西省植被碳汇提质增效优先区识别[J]. 自然资源学报, 37(5): 1214-1232.
DOI |
| WANG T F, GONG Z W, DENG Y J, 2022. Identification of priority areas for improving quality and efficiency of vegetation carbon sinks in Shaanxi Province based on land use change[J]. Journal of Natural Resources, 37(5): 1214-1232. | |
| [37] | 王艳军, 王孟杰, 柳林, 等, 2022. DMSP/OLS夜光数据的珠三角碳排放时空差异性分析[J]. 遥感学报, 26(9): 1824-1837. |
| WANG Y J, WWANG M J, LIU L, et al., 2022. Analyzing the spatiotemporal differences of carbon emission in the Pearl River Delta using DMSP/OLS nighttime light images[J]. National Remote Sensing Bulletin, 26(9): 1824-1837. | |
| [38] | 武爱彬, 赵艳霞, 郭小平, 等, 2023. 碳中和目标下河北省土地利用碳排放格局演变与多情景模拟[J]. 农业工程学报, 39(14): 261-270, 293. |
| WU A B, ZHAO Y X, GUO X P, et al., 2023. Evolution and multi scenario simulation of land use carbon emission pattern in Hebei Province under carbon neutral target[J]. Transactions of the Chinese Society of Agricultural Engineering, 39(14): 261-270, 293. | |
| [39] | 吴健生, 晋雪茹, 王晗, 等, 2023. 中国碳排放及影响因素的市域尺度分析[J]. 环境科学, 44(5): 2974-2982. |
| WU J S, JIN X R, WANG H, et al., 2023. Analysis of carbon emissions and influencing factors in China based on city scale[J]. Environmental Science, 44(5): 2974-2982. | |
| [40] | 肖钟湧, 陈颖锋, 林晓凤, 等, 2022. 基于多源卫星遥感数据的中国2003年-2018年CO2时空变化研究[J]. 遥感学报, 26(12): 2486-2496. |
| XIAO Z Y, CHEN Y F, LIN X F, et al., 2022. The temporal and spatial variation of CO2 column concentration over China from 2003 to 2018 based on multi-source satellite remote sensing data[J]. National Remote Sensing Bulletin, 26(12): 2486-2496. | |
| [41] | 杨斌, 杨俊, 王占岐, 等, 2022. 长江经济带耕地绿色低碳利用的时空格局及其成因分析[J]. 中国土地科学, 36(10): 63-71. |
| YANG B, YANG J, WANG Z Q, et al., 2022. Spatial-temporal pattern and attribution of cultivated land green and low-carbon utilization in the Yangtze River economic belt[J]. China Land Science, 36(10): 63-71. | |
| [42] | 杨阳, 张萍萍, 吴凡, 等, 2023. 黄土高原植被建设及其对碳中和的意义与对策[J]. 生态学报, 43(21): 9071-9081. |
| YANGY, ZHANG P P, WU F, et al., 2023. The Significance and countermeasures of vegetation construction on the Loess Plateau to carbon neutrality[J]. Acta Ecologica Sinica, 43(21): 9071-9081. | |
| [43] |
张涛, 方宏, 韦玉春, 等, 2020. 顾及空间自相关性的高分遥感影像中建设用地的变化检测[J]. 自然资源学报, 35(4): 963-976.
DOI |
|
ZHANG T, FANG H, WEI Y C, et al., 2020. Detection of the construction land change in fine spatial resolution remote sensing imagery coupling spatial autocorrelation[J]. Journal of Natural Resources, 35(4): 963-976.
DOI |
|
| [44] | 张余, 姜博, 赵映慧, 等, 2022. 东北三省土地利用碳排放时空格局及影响因素研究[J]. 地域研究与开发, 41(4): 150-156. |
| ZHANG Y, JIANG B, ZHAO Y H, et al., 2022. Temporal and spatial pattern changes and influencing factors of land use carbon emissionsin the Three Provinces of Northeast China[J]. Areal Research and Development, 41(4): 150-156. |
| Viewed | ||||||
|
Full text |
|
|||||
|
Abstract |
|
|||||
Copyright © 2021 Editorial Office of ACTA PETROLEI SINICA
Address:No. 6 Liupukang Street, Xicheng District, Beijing, P.R.China, 510650
Tel: 86-010-62067128, 86-010-62067137, 86-010-62067139
Fax: 86-10-62067130
Email: syxb@cnpc.com.cn
Support byBeijing Magtech Co.ltd, E-mail:support@magtech.com.cn