Ecology and Environmental Sciences ›› 2026, Vol. 35 ›› Issue (1): 99-111.DOI: 10.16258/j.cnki.1674-5906.2026.01.009
• Research Article [Environmental Science] • Previous Articles Next Articles
CHEN Yanling1,2( ), ZHOU Yuan1,2,*(), QIAN Yue1,2, WU Yanliang3, DENG Lichen1,2, WU Qiong4, ZHAN Longfei4
Received:2025-02-28
Revised:2025-09-15
Accepted:2025-11-14
Online:2026-01-18
Published:2026-01-05
陈燕玲1,2(), 周媛1,2,*(), 钱悦1,2, 吴燕良3, 邓力琛1,2, 吴琼4, 占龙飞4
通讯作者:
* E-mail: 作者简介:陈燕玲(1993年生),女,工程师,硕士,从事生态遥感监测、空气污染研究。E-mail: 863692055@qq.com
基金资助:CLC Number:
CHEN Yanling, ZHOU Yuan, QIAN Yue, WU Yanliang, DENG Lichen, WU Qiong, ZHAN Longfei. Spatiotemporal Distribution of Ozone Column Concentrations and Associated Affecting Factors in Jiangxi Province Based on OMI[J]. Ecology and Environmental Sciences, 2026, 35(1): 99-111.
陈燕玲, 周媛, 钱悦, 吴燕良, 邓力琛, 吴琼, 占龙飞. 基于OMI的江西省臭氧柱浓度时空分布特征及影响因素研究[J]. 生态环境学报, 2026, 35(1): 99-111.
Add to citation manager EndNote|Ris|BibTeX
URL: https://www.jeesci.com/EN/10.16258/j.cnki.1674-5906.2026.01.009

Figure 1 Distribution of observation stations in Jiangxi Province
| 地区 | 整层O3柱浓度 | 对流层O3柱浓度 |
|---|---|---|
| 江西省 | 0.60** 1) | 0.67** |
| 九江 | 0.52** | |
| 景德镇 | 0.64** | |
| 上饶 | 0.56** | |
| 南昌 | 0.60** | |
| 鹰潭 | 0.55** | |
| 宜春 | 0.49** | |
| 新余 | 0.56** | |
| 萍乡 | 0.52** | |
| 抚州 | 0.51** | |
| 吉安 | 0.54** | |
| 赣州 | 0.54** |
Table 1 Correlation coefficients between total and tropospheric O3 column concentrations and O3-8h mass concentrations at monitoring sites
| 地区 | 整层O3柱浓度 | 对流层O3柱浓度 |
|---|---|---|
| 江西省 | 0.60** 1) | 0.67** |
| 九江 | 0.52** | |
| 景德镇 | 0.64** | |
| 上饶 | 0.56** | |
| 南昌 | 0.60** | |
| 鹰潭 | 0.55** | |
| 宜春 | 0.49** | |
| 新余 | 0.56** | |
| 萍乡 | 0.52** | |
| 抚州 | 0.51** | |
| 吉安 | 0.54** | |
| 赣州 | 0.54** |
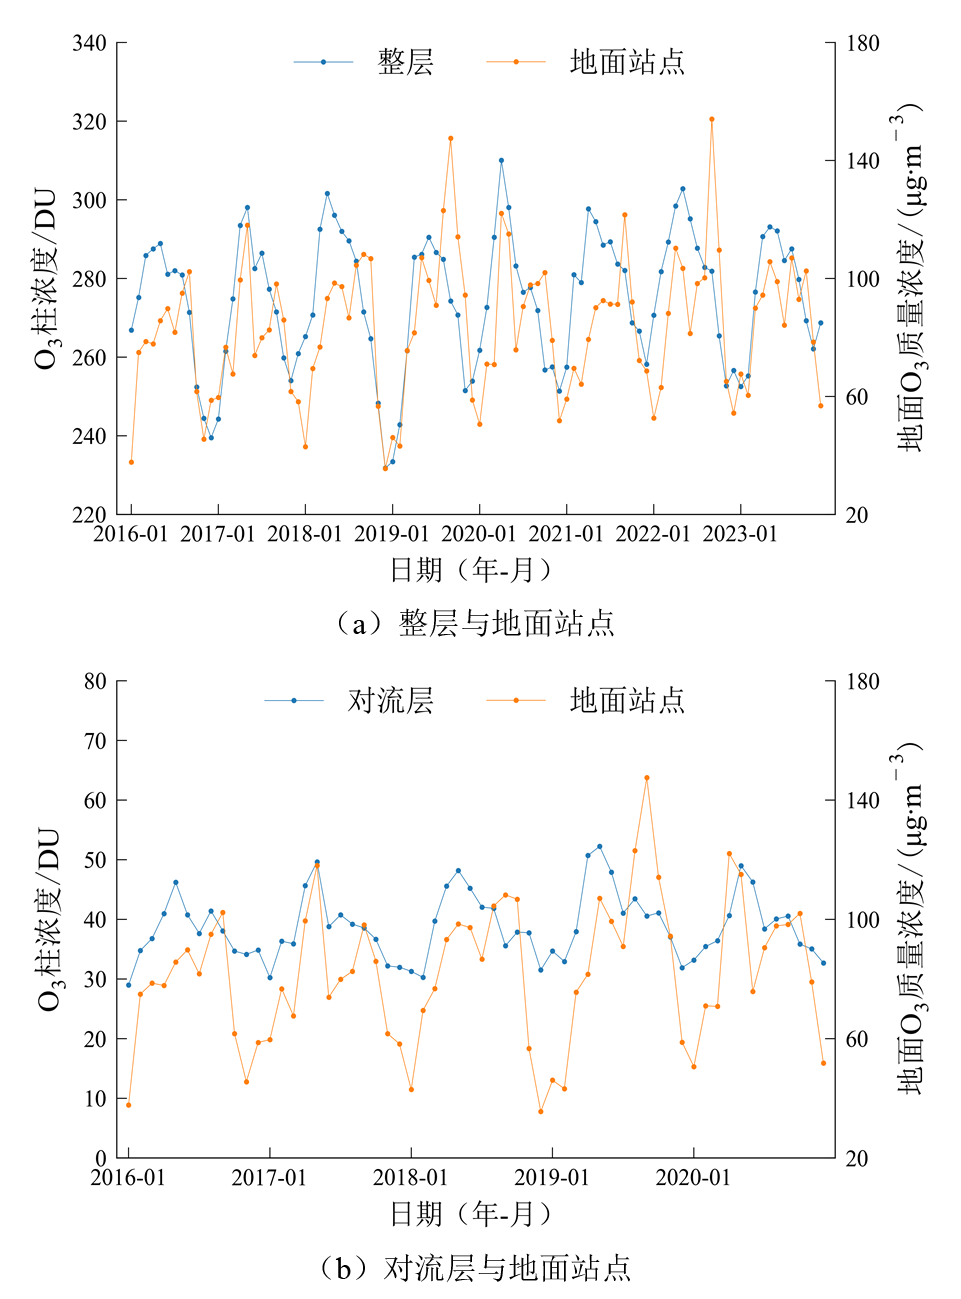
Figure 2 Comparison between total and tropospheric O3 column concentrations and O3-8h mass concentrations at monitoring sites
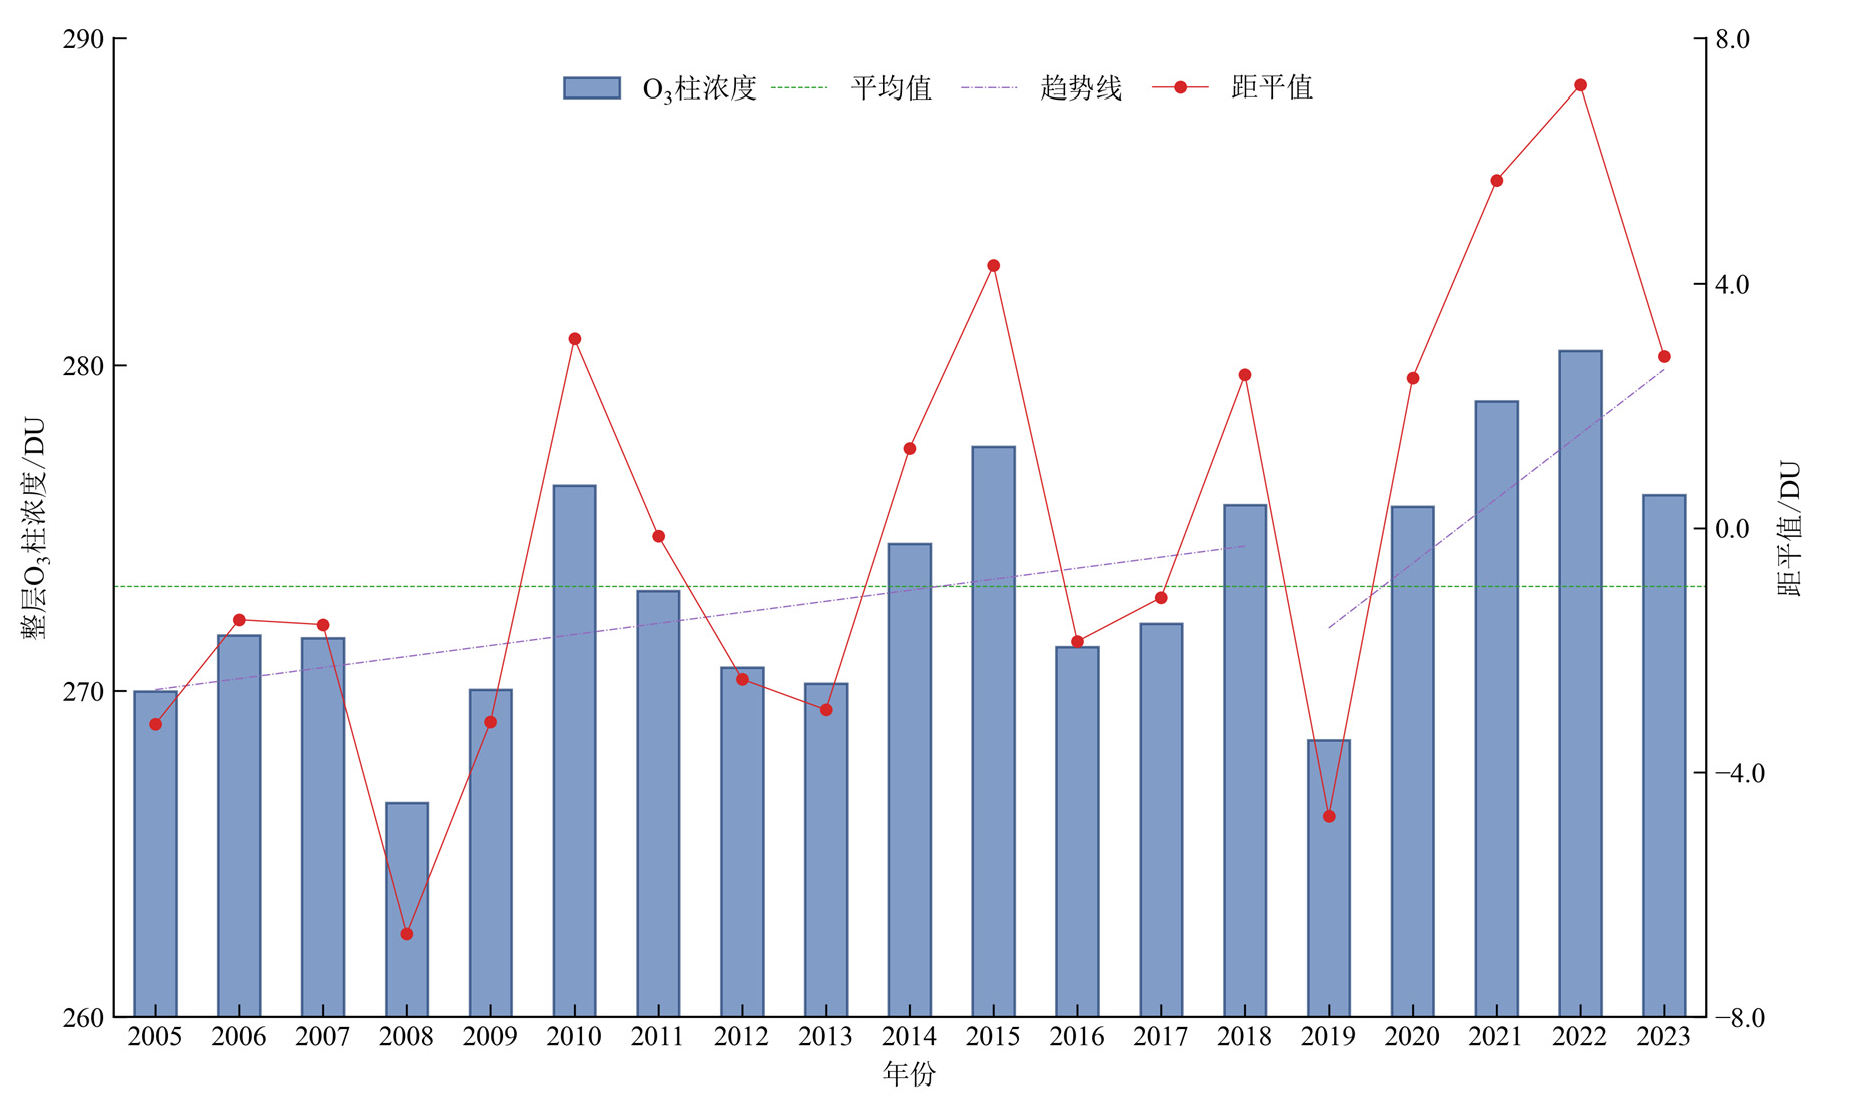
Figure 3 Variations in annual-mean total O3 column concentrations in Jiangxi Province from 2005 to 2023
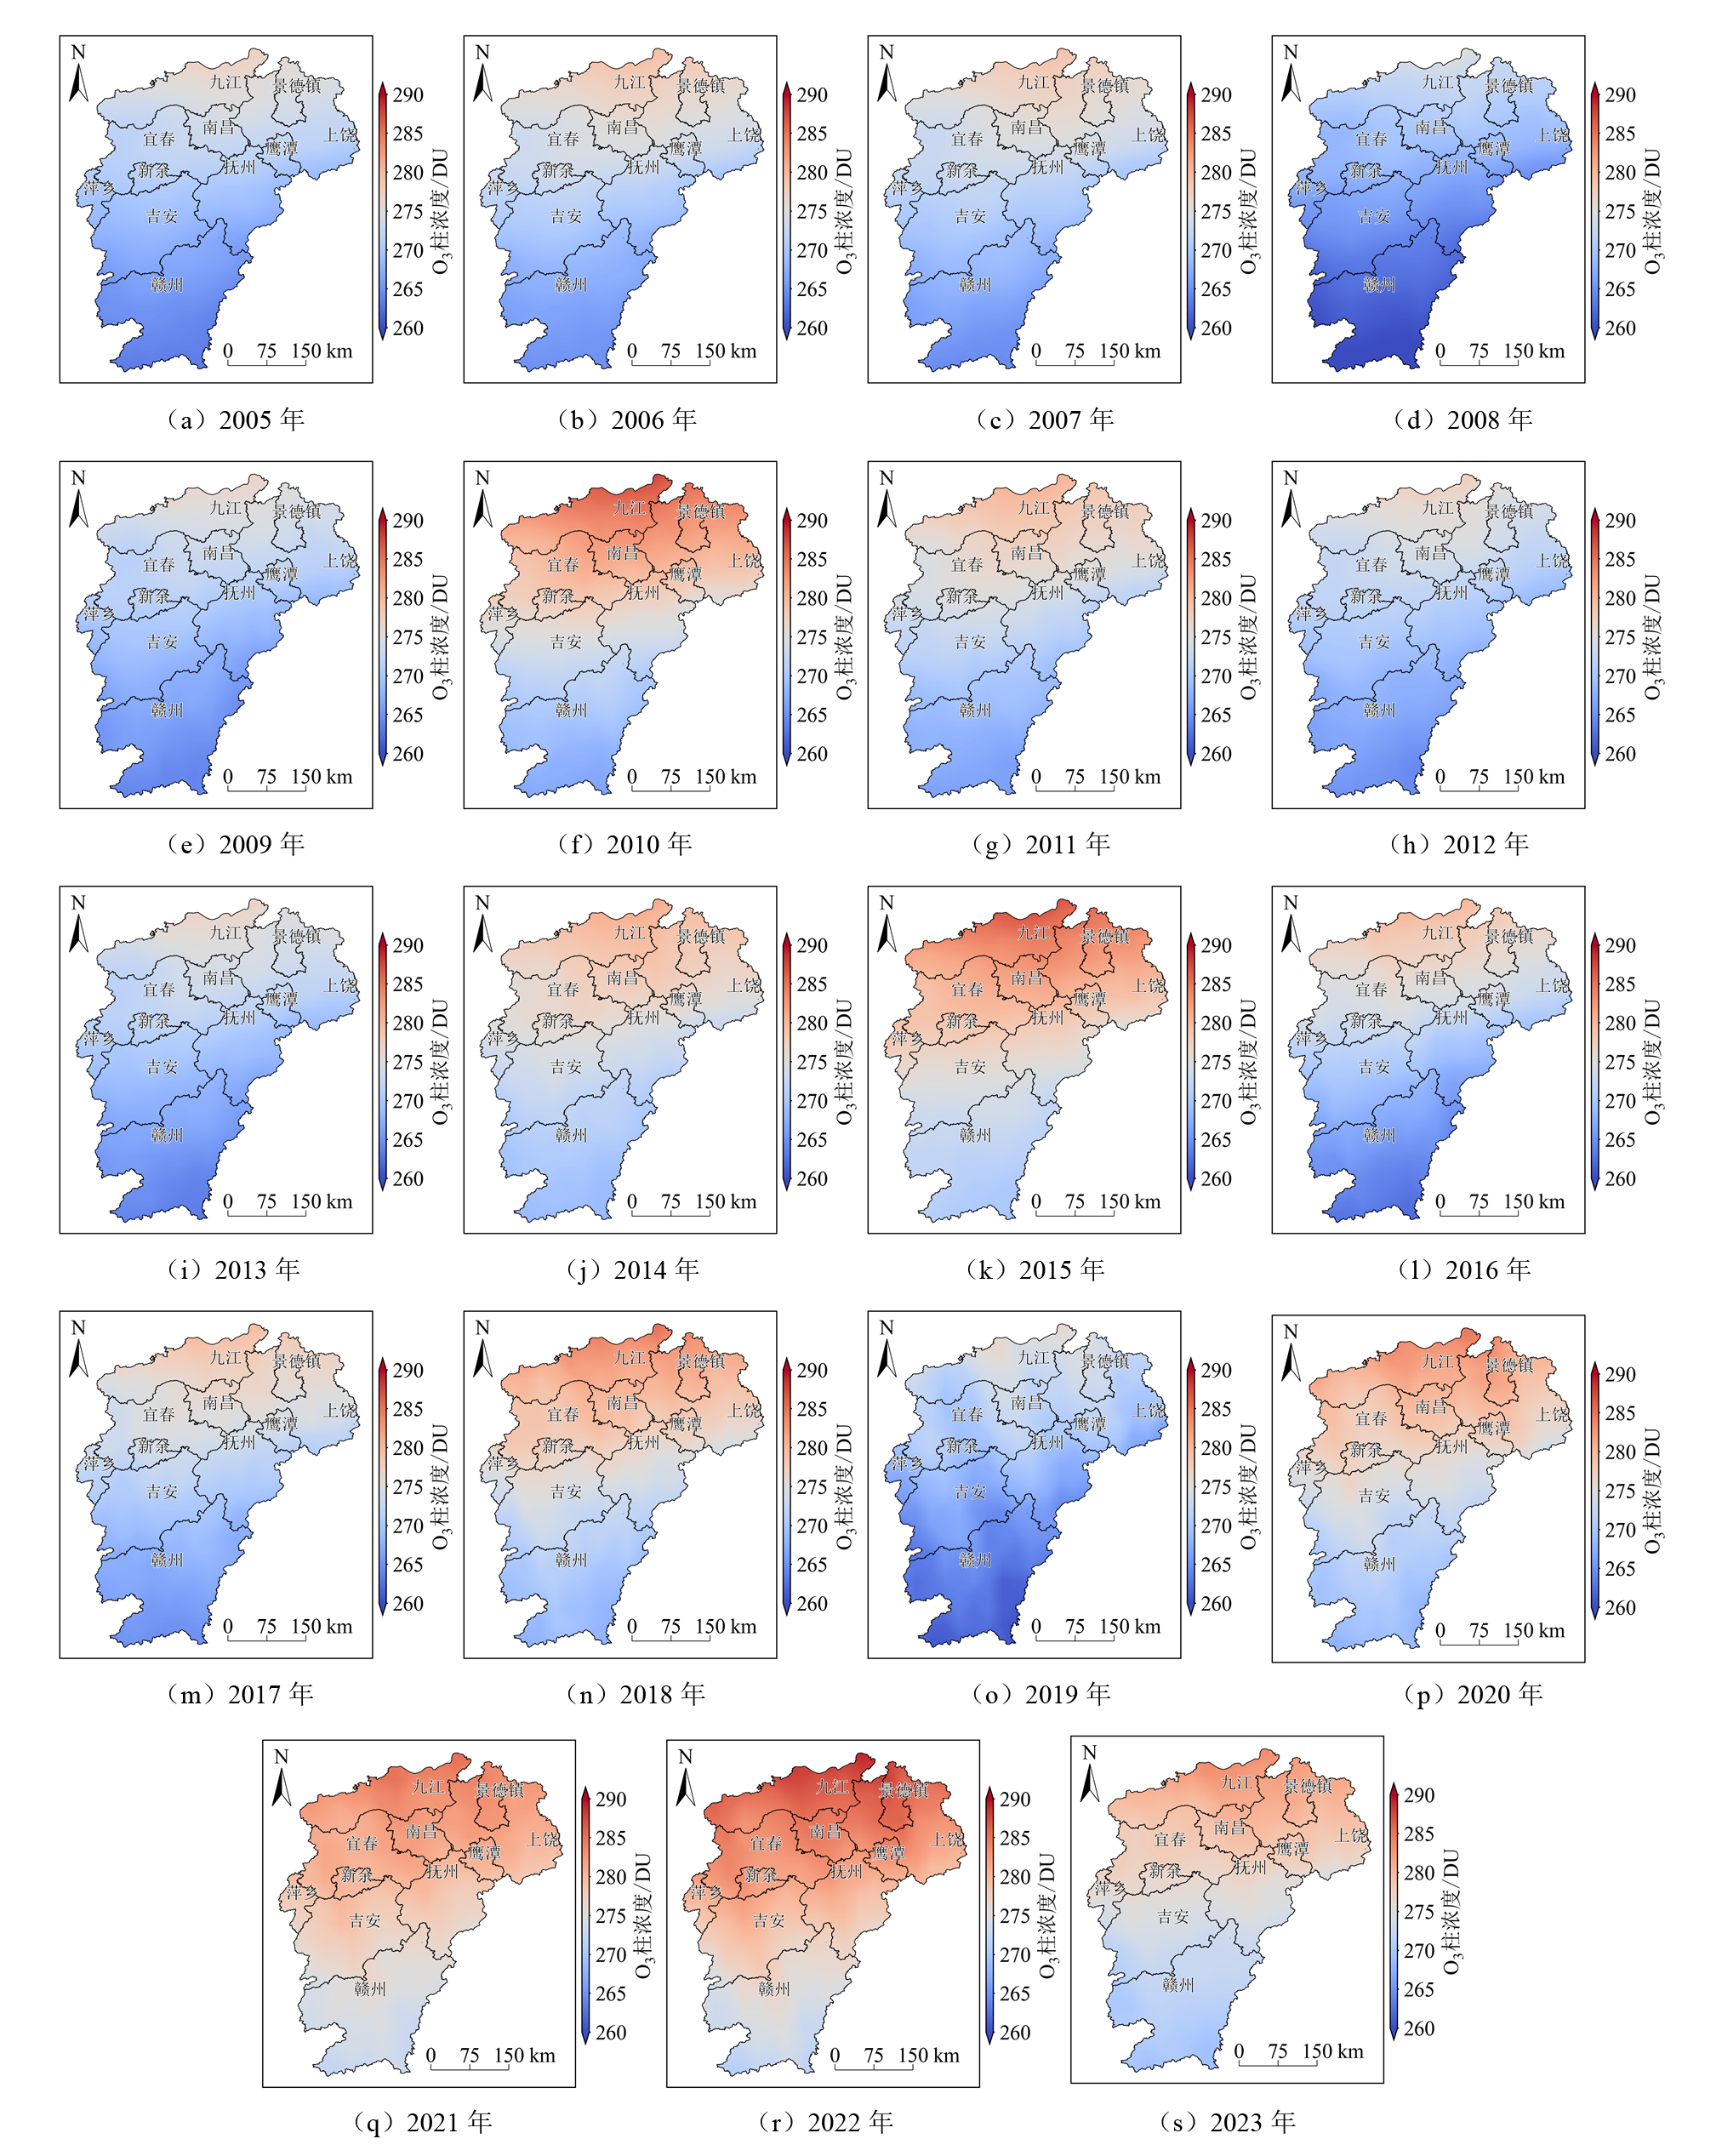
Figure 4 Annual distributions of total O3 column concentrations in Jiangxi Province from 2005 to 2023
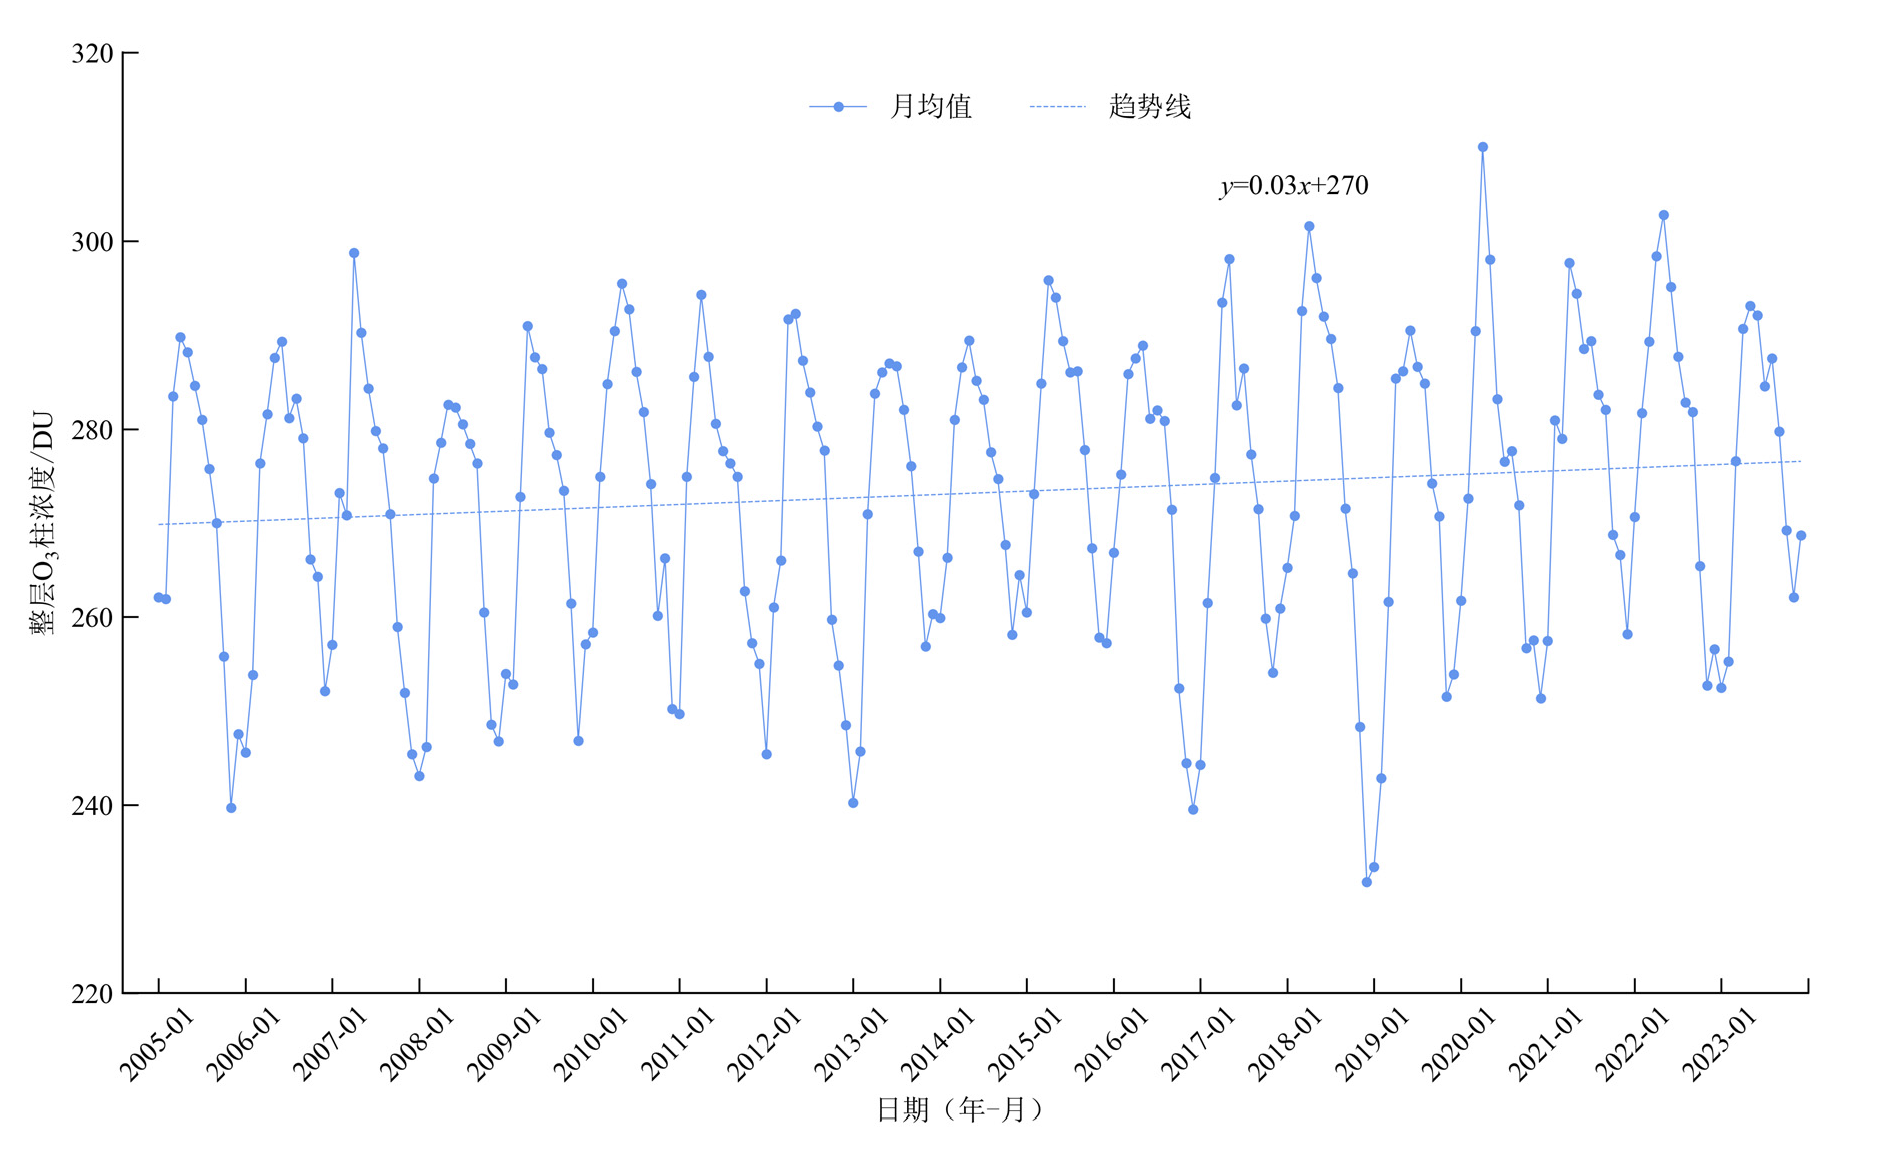
Figure 5 Variations in monthly-mean total O3 column concentrations in Jiangxi Province from 2005 to 2023

Figure 6 Distributions in monthly-mean total O3 column concentrations in Jiangxi Province from 2005 to 2023

Figure 7 Seasonal variations in total O3 column concentrations in Jiangxi Province from 2005 to 2023

Figure 8 Seasonal distributions of total O3 column concentrations in Jiangxi Province from 2005 to 2023

Figure 9 Variations in annual-mean tropospheric O3 column concentrations in Jiangxi Province from 2005 to 2020

Figure 10 Variations in monthly-mean tropospheric O3 column concentrations in Jiangxi Province from 2005 to 2020

Figure 11 Seasonal variations in tropospheric O3 column concentrations in Jiangxi Province from 2005 to 2020
| O3柱层次 | 气象要素 | |||||
|---|---|---|---|---|---|---|
| 气温 | 降水量 | 气压 | 日照时数 | 相对湿度 | 风速 | |
| 整层 | 0.64** | 0.56** | −0.73** | 0.31** | 0.06** | 0.10** |
| 对流层 | 0.63** | 0.49** | −0.68** | 0.28** | 0.09** | 0.02** |
Table 2 Correlation coefficients between total and tropospheric O3 column concentrations and surface meteorological factors at monitoring sites
| O3柱层次 | 气象要素 | |||||
|---|---|---|---|---|---|---|
| 气温 | 降水量 | 气压 | 日照时数 | 相对湿度 | 风速 | |
| 整层 | 0.64** | 0.56** | −0.73** | 0.31** | 0.06** | 0.10** |
| 对流层 | 0.63** | 0.49** | −0.68** | 0.28** | 0.09** | 0.02** |
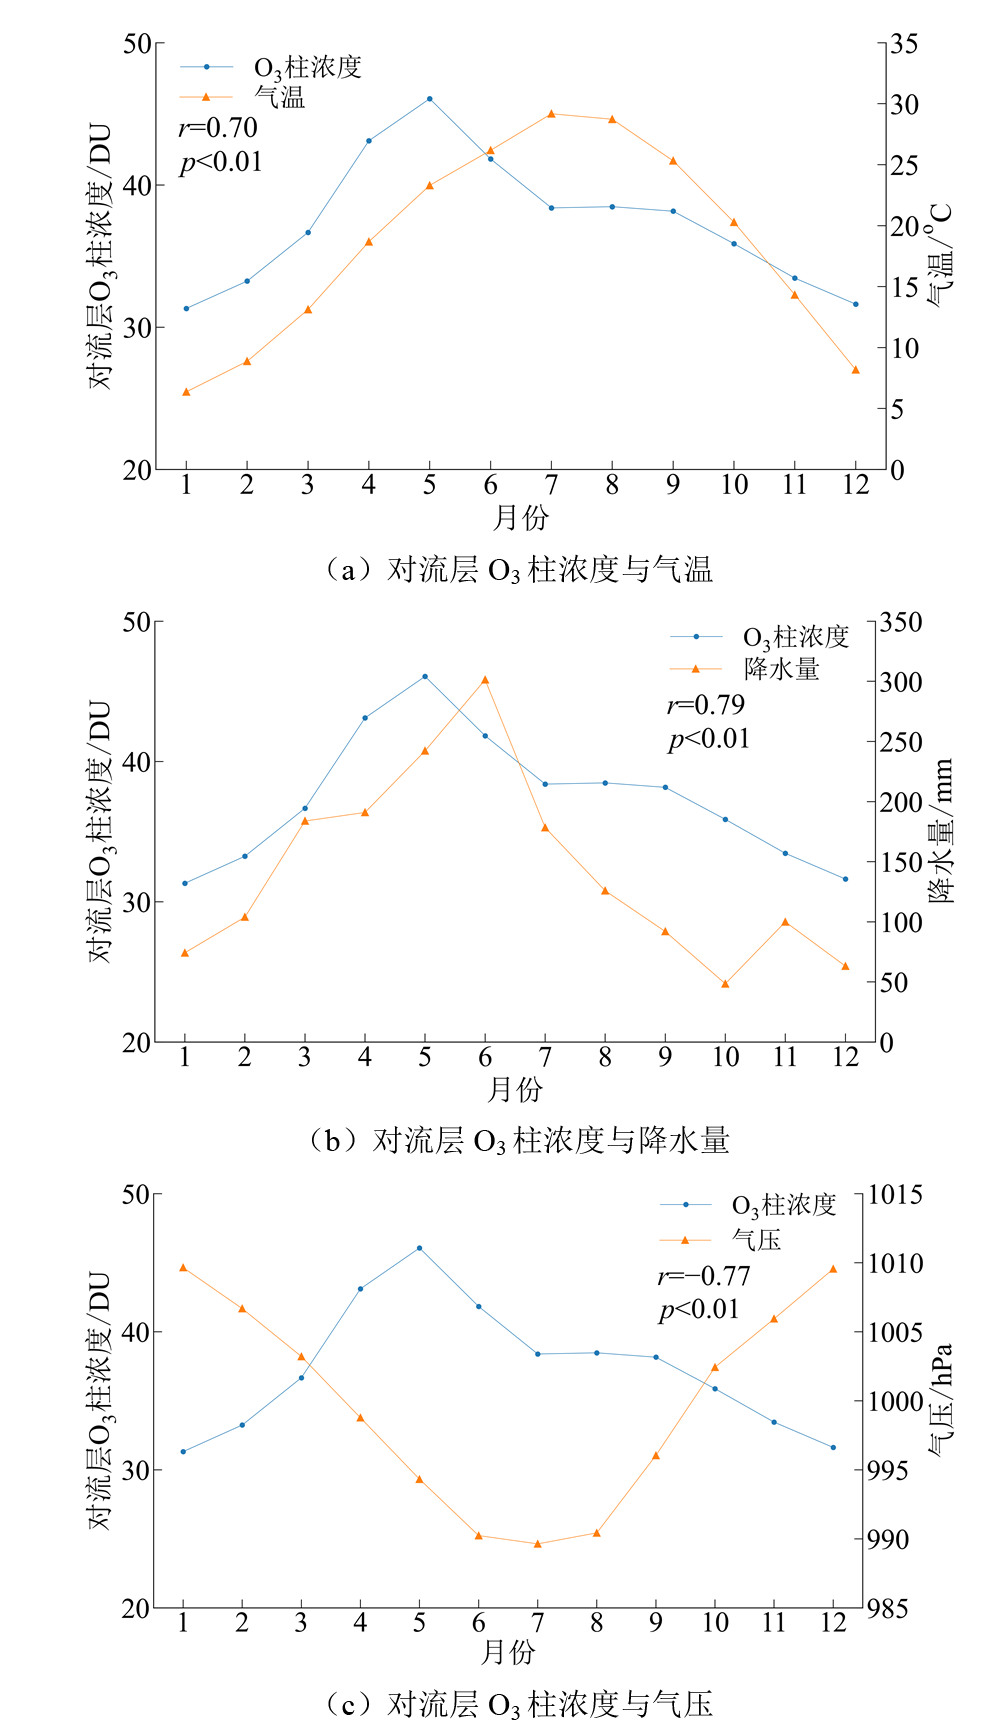
Figure 12 Trends in monthly-mean tropospheric O3 column concentrations and surface meteorological variables (temperature, precipitation, pressure) in Jiangxi Province from 2005 to 2020
| O3柱层次 | 人为因素 | ||||||||
|---|---|---|---|---|---|---|---|---|---|
| 生产总值 | 第一产业 | 第二产业 | 第三产业 | 人口数 | 能源消费总量 | NOx排放量 | NOx排放量(工业) | NOx排放量(机动车) | |
| 整层 | 0.61** | 0.59** | 0.62** | 0.60** | 0.50** | 0.59** | −0.46** | −0.41** | −0.50** |
| 对流层 | 0.87** | 0.86** | 0.87** | 0.85** | 0.77** | 0.86** | −0.53** | −0.63** | −0.13** |
Table 3 Correlation coefficients between total and tropospheric O3 column concentrations and human factors
| O3柱层次 | 人为因素 | ||||||||
|---|---|---|---|---|---|---|---|---|---|
| 生产总值 | 第一产业 | 第二产业 | 第三产业 | 人口数 | 能源消费总量 | NOx排放量 | NOx排放量(工业) | NOx排放量(机动车) | |
| 整层 | 0.61** | 0.59** | 0.62** | 0.60** | 0.50** | 0.59** | −0.46** | −0.41** | −0.50** |
| 对流层 | 0.87** | 0.86** | 0.87** | 0.85** | 0.77** | 0.86** | −0.53** | −0.63** | −0.13** |
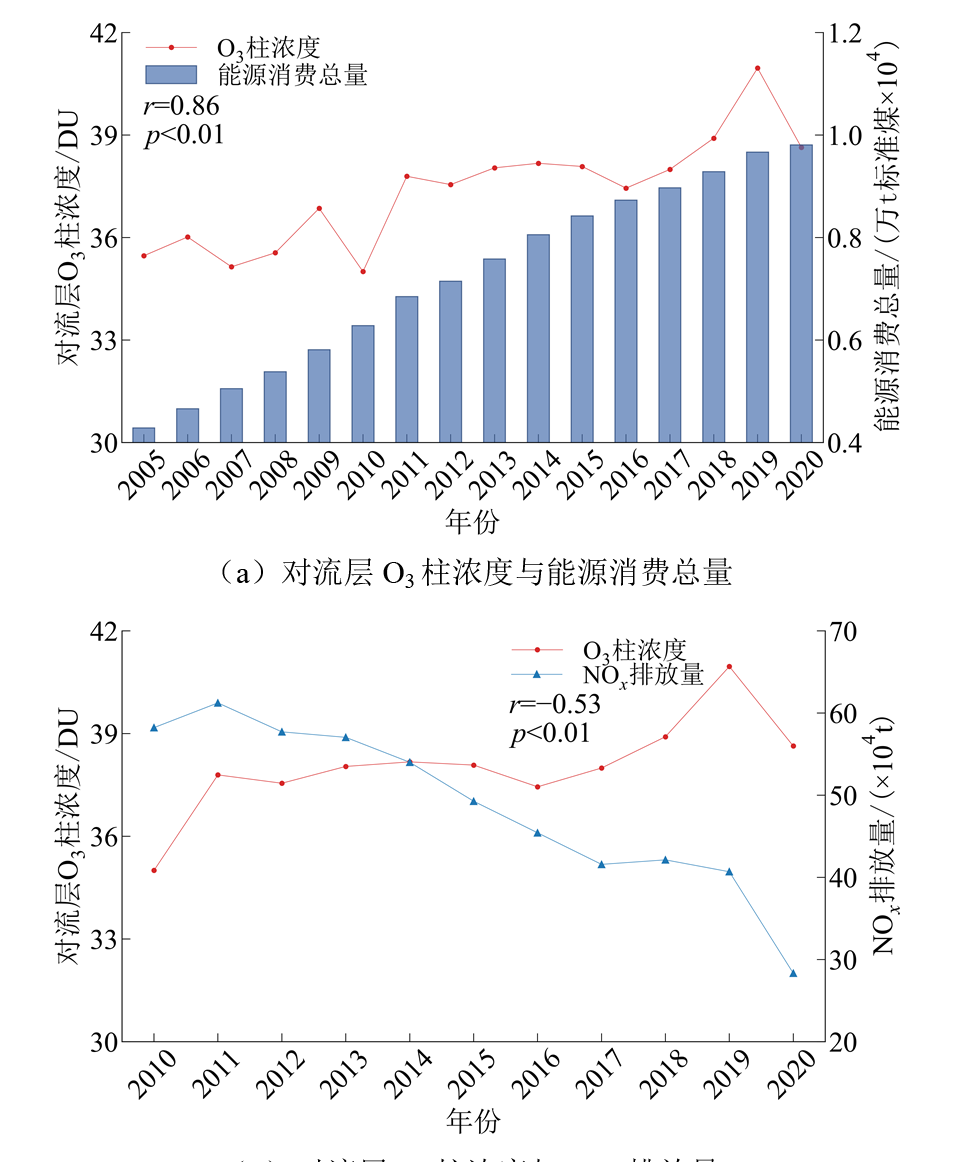
Figure 13 Trends in annual-mean tropospheric O3 column concentrations, total energy consumption, and nitrogen oxide emissions in Jiangxi Province
| [1] |
CHANG K L, PETROPAVLOVSKIKH I, COOPER O R, et al., 2017. Regional trend analysis of surface ozone observations from monitoring networks in eastern North America, Europe and East Asia[J]. Elementa: Science of the Anthropocene, 5: 50.
DOI URL |
| [2] |
CHEN X, ZHONG B Q, HUANG F X, et al., 2020. The role of natural factors in constraining long-term tropospheric ozone trends over Southern China[J]. Atmospheric Environment, 220: 117060.
DOI URL |
| [3] |
FLEMING Z L, DOHERTY R M, SCHNEIDEMESSER E V, et al., 2018. Tropospheric ozone assessment report: Present-day ozone distribution and trends relevant to human health[J]. Elementa: Science of the Anthropocene, 6: 12.
DOI URL |
| [4] | LEFOHN A S, MALLEY C S, SMITH L, et al., 2018. Tropospheric ozone assessment report: Global ozone metrics for climate change, human health, and crop/ecosystem research[J]. Elementa: Science of the Anthropocene, 6: 27. |
| [5] |
LI J, 2020. Pollution trends in China from 2000 to 2017: A multi-sensor view from space[J]. Remote Sensing, 12(2): 208.
DOI URL |
| [6] |
LI X, LI Y J, MA Q M, et al., 2019. Spatial and temporal variation of total and tropospheric ozone columns over China[J]. The International Archives of the Photogrammetry, Remote Sensing and Spatial Information Sciences, XLII-3/W9: 113-118.
DOI URL |
| [7] | LIAO Z H, LING Z H, GAO M, et al., 2021. Tropospheric ozone variability over Hong Kong based on recent 20 years (2000-2019) ozonesonde observation[J]. Journal of Geophysical Research: Atmospheres, 126(3): e2020JD033054. |
| [8] | LIU J H, STRODE S A, LIANG Q, et al., 2022. Change in tropospheric ozone in the recent decades and its contribution to global total ozone[J]. Journal of Geophysical Research: Atmospheres, 127(22): e2022JD037170. |
| [9] | LU X, HONG J Y, ZHANG L, et al., 2018. Severe surface ozone pollution in China: A global perspective[J]. Environmental Science & Technology Letters, 5(8): 487-494. |
| [10] |
MATYSSEK R, KARNOSKY D F, WIESER G, et al., 2010. Advances in understanding ozone impact on forest trees: Messages from novel phytotron and free-air fumigation studies[J]. Environmental Pollution, 158(6): 1990-2006.
DOI PMID |
| [11] |
MONKS P S, 2000. A review of the observations and origins of the spring ozone maximum[J]. Atmospheric Environment, 34(21): 3545-3561.
DOI URL |
| [12] | ORTE P F, LUCCINI E, WOLFRAM E, et al., 2020. Comparison of OMI-DOAS total ozone column with ground-based measurements in Argentina[J]. Revista De Teledetección, 57: 13-23. |
| [13] |
QIN M M, HU A Q, MAO J J, et al., 2022. PM2.5 and O3 relationships affected by the atmospheric oxidizing capacity in the Yangtze River Delta, China[J]. Science of The Total Environment, 810: 152268.
DOI URL |
| [14] |
SUN H T, SHIN Y M, XIA M T, et al., 2022. Spatial resolved surface ozone with urban and rural differentiation during 1990-2019: A space-time bayesian neural network downscaler[J]. Environmental Science & Technology, 56(11): 7337-7349.
DOI URL |
| [15] |
WANG T, XUE L K, BRIMBLECOMBE P, et al., 2017. Ozone pollution in China: A review of concentrations, meteorological influences, chemical precursors, and effects[J]. Science of The Total Environment, 575: 1582-1596.
DOI URL |
| [16] |
WU K, YANG X Y, CHEN D A, et al., 2020. Estimation of biogenic VOC emissions and their corresponding impact on ozone and secondary organic aerosol formation in China[J]. Atmospheric Research, 231: 104656.
DOI URL |
| [17] |
XIANG S L, LIU J F, TAO W, et al., 2020. Control of both PM2.5 and O3 in Beijing-Tianjin-Hebei and the surrounding areas[J]. Atmospheric Environment, 224: 117259.
DOI URL |
| [18] |
ZHU L, LIU M X, SONG J Y, 2022. Spatiotemporal variations and influent factors of tropospheric ozone concentration over China based on OMI data[J]. Atmosphere, 13(2): 253.
DOI URL |
| [19] | ZIEMKE J R, CHANDRA S, DUNCAN B N, et al., 2006. Tropospheric ozone determined from Aura OMI and MLS: Evaluation of measurements and comparison with the Global Modeling Initiative’s chemical transport model[J]. Journal of Geophysical Research: Atmospheres, 111(D19): 2006JD007089. |
| [20] |
ZIEMKE J R, OLSEN M A, WITTE J C, et al., 2014. Assessment and applications of NASA ozone data products derived from Aura OMI/MLS satellite measurements in context of the GMI chemical transport model[J]. Journal of Geophysical Research: Atmospheres, 119(9): 5671-5699.
DOI URL |
| [21] | 曹侃, 应旻, 魏峻山, 等, 2021. 江西省臭氧污染特征及其与气象条件的关系[J]. 中国环境监测, 37(2): 44-59. |
| CAO K, YING M, WEI J S, et al., 2021. Characteristics of ozone pollution in Jiangxi Province and its relationship with meteorological factors[J]. Environmental Monitoring in China, 37(2): 44-59. | |
| [22] | 曹培豪, 刘镇, 储险峰, 等, 2024. 江西省极端干旱下臭氧污染特征及成因分析[J]. 中国环境监测, 40(3): 98-106. |
| CAO P H, LIU Z, CHU X F, et al., 2024. Characteristics and mechanisms of the ozone pollution episode during the extreme drought in Jiangxi Province[J]. Environmental Monitoring in China, 40(3): 98-106. | |
| [23] | 曹晓云, 祁栋林, 肖建设, 等, 2021. 基于卫星观测的青海高原对流层臭氧时空分布特征研究[J]. 环境科学学报, 41(5): 1640-1648. |
| CAO X Y, QI D L, XIAO J S, et al., 2021. Temporal and spatial distribution characteristics of tropospheric ozone in Qinghai Plateau based on satellite observations[J]. Acta Scientiae Circumstantiae, 41(5): 1640-1648. | |
| [24] | 陈希, 黄富祥, 夏学齐, 等, 2015. 华北地区对流层臭氧长期变化趋势及影响因子分析[J]. 科学通报, 60(27): 2659-2666. |
| CHEN X, HUANG F X, XIA X Q, et al., 2015. Analysis of tropospheric ozone long-term changing trends and affecting factors over northern China[J]. Chinese Science Bulletin, 60(27): 2659-2666. | |
| [25] | 方小珍, 刘诚, 邓力琛, 等, 2024. 江西省近地面臭氧污染特征及成因分析[J]. 东华理工大学学报(自然科学版), 47(4): 381-390. |
| FANG X Z, LIU C, DENG L C, et al., 2024. Analysis on characteristics and causes of ground-level ozone pollution in Jiangxi Province[J]. Journal of East China University of Technology (Natural Science Edition), 47(4): 381-390. | |
| [26] | 郭云飞, 包云轩, 刘端阳, 2022. 基于卫星和地面观测的中国典型城市群对流层内臭氧时空变化特征[J]. 环境科学研究, 35(3): 719-730. |
| GUO Y F, BAO Y X, LIU D Y, 2022. Spatial-temporal variations of tropospheric ozone over typical urban agglomerations in China based on satellite and surface observations[J]. Research of Environmental Sciences, 35(3): 719-730. | |
| [27] | 侯鑫, 张霄羽, 张红, 等, 2024. 中国对流层臭氧的时空变化及影响因素研究[J]. 环境科学研究, 37(9): 1911-1919. |
| HOU X, ZHANG X Y, ZHANG H, et al., 2024. Spatiotemporal dynamics and driving factors of tropospheric ozone in China[J]. Research of Environmental Sciences, 37(9): 1911-1919. | |
| [28] | 钱悦, 许彬, 夏玲君, 等, 2021. 2016-2019年江西省臭氧污染特征与气象因子影响分析[J]. 环境科学, 42(5): 2190-2201. |
| QIAN Y, XU B, XIA L J, et al., 2021. Characteristics of ozone pollution and relationships with meteorological factors in Jiangxi Province[J]. Environmental Science, 42(5): 2190-2201. | |
| [29] | 宋佳颖, 刘旻霞, 孙瑞弟, 等, 2020. 基于OMI数据的东南沿海大气臭氧浓度时空分布特征研究[J]. 环境科学学报, 40(2): 438-449. |
| SONG J Y, LIU M X, SUN R D, et al., 2020. Temporal and spatial distribution characteristics of atmospheric ozone concentration in Southeast Coast based on OMI data[J]. Acta Scientiae Circumstantiae, 40(2): 438-449. | |
| [30] | 王扬, 刘旻霞, 宋宜凯, 等, 2023. 黄河流域大气对流层O3和NO2时空变化及来源解析[J]. 环境科学学报, 43(7): 273-285. |
| WANG Y, LIU M X, SONG Y K, et al., 2023. Spatiotemporal succession and source analysis of O3 and NO2 in troposphere over the Yellow River Basin[J]. Acta Scientiae Circumstantiae, 43(7): 273-285. | |
| [31] | 王跃启, 江洪, 肖钟湧, 等, 2009. 基于OMI数据的中国臭氧总量时空动态信息提取[J]. 环境科学与技术, 32(6): 177-180, 184. |
|
WANG Y Q, JIANG H, XIAO Z Y, et al., 2009. Extracting temporal and spatial distribution information about total ozone amount in China based on OMI satellite data[J]. Environmental Science & Technology, 32(6): 177-180, 184.
DOI URL |
|
| [32] |
翁雷霆, 王鹏, 肖荣波, 等, 2025. 2000-2022年珠三角城市群PM2.5与O3时空分布特征及其影响因素[J]. 生态环境学报, 34(2): 268-278.
DOI |
| WENG L T, WANG P, XIAO R B, et al., 2025. Spatial-temporal distribution characteristics of PM2.5 and O3 in the Pearl River Delta urban agglomeration and corresponding influence factors[J]. Ecology and Environmental Sciences, 34(2): 268-278. | |
| [33] | 肖仕锐, 刘旻霞, 李乐, 等, 2022. 河套平原O3浓度时空分布、传输路径及潜在源贡献分析[J]. 环境科学学报, 42(6): 237-249. |
| XIAO S R, LIU M X, LI L, et al., 2022. Temporal and spatial distribution, transmission path and potential source contribution of O3 concentration in Hetao Plain[J]. Acta Scientiae Circumstantiae, 42(6): 237-249. | |
| [34] |
许健, 张卓, 饶兰兰, 等, 2024. 对流层臭氧卫星遥感反演综述[J]. 地球科学进展, 39(1): 56-70.
DOI |
| XU J, ZHANG Z, RAO L L, et al., 2024. Tropospheric ozone retrieval from satellite remote sensing-A review[J]. Advances in Earth Science, 39(1): 56-70. | |
| [35] | 于瑞新, 刘旻霞, 李亮, 等, 2021. 长三角地区近15年大气臭氧柱浓度时空变化及影响因素[J]. 环境科学学报, 41(3) : 770-784. |
| YU R X, LIU M X, LI L, et al., 2021. Spatial and temporal variation of atmospheric ozone column concentration and influencing factors in the Yangtze River Delta region in recent 15 years[J]. Acta Scientiae Circumstantiae, 41(3): 770-784. | |
| [36] | 张涵, 姜华, 高健, 等, 2022. PM2.5与臭氧污染形成机制及协同防控思路[J]. 环境科学研究, 35(3): 611-620. |
| ZHANG H, JIANG H, GAO J, et al., 2022. Formation mechanism and management strategy of cooperative control of PM2.5 and O3[J]. Research of Environmental Sciences, 35(3): 611-620. | |
| [37] | 张倩倩, 张兴赢, 2019. 基于卫星和地面观测的2013年以来我国臭氧时空分布及变化特征[J]. 环境科学, 40(3): 1132-1142. |
| ZHANG Q Q, ZHANG X Y, 2019. Ozone spatial-temporal distribution and trend over China since 2013: Insight from satellite and surface observation[J]. Environmental Science, 40(3): 1132-1142. | |
| [38] |
张莹, 高玚, 祝善友, 等, 2014. 近30 a中国上空臭氧总量时空变化遥感监测分析[J]. 地球信息科学学报, 16(6): 971-978.
DOI |
| ZHANG Y, GAO Y, ZHU S Y, et al., 2014. Variation of total ozone over China for 30 years analyzed by multi-source satellite remote sensing data[J]. Journal of Geo-information Science, 16(6): 971-978. | |
| [39] | 中华人民共和国环境保护部, 2012. 环境空气质量指数 (AQI) 技术规定 (试行): HJ 633—2012 [S]. 北京: 中国环境科学出版社. |
| Ministry of Environmental Protection of the People’s Republic of China, 2012. Technical regulation on ambient air quality index (on trial): HJ 633—2012 [S]. Beijing: China Environmental Science Press. |
| [1] | SUN Yuhuan, YANG Yichen, ZHANG Tingyu. Spatial Patterns and Evolutionary Characteristics of Ecological and Economic Efficiency in China: An Ecological Priority Perspective [J]. Ecology and Environmental Sciences, 2026, 35(1): 1-14. |
| [2] | HUANG Jixing, LIU Wanyi, YANG Shuqi, ZHU Weihan, ZANG Yuanrui, DAI Yongwu, LIN Jinhuang. Temporal and Spatial Trade-offs between the Production, Livelihood, and Ecological Functions of Cultivated Land from the Perspective of Ecosystem Services [J]. Ecology and Environmental Sciences, 2026, 35(1): 40-53. |
| [3] | LI Yihan, WANG Huogen, XIAO Xiaowei. A Study on Carbon Emission Forecasting and Reduction Pathways in Jiangxi Province Based on System Dynamics [J]. Ecology and Environmental Sciences, 2025, 34(9): 1351-1360. |
| [4] | ZHOU Yixiang, TANG Bin, FU Chengzhong, XU Rongqin, ZHOU Dongjing, WANG Junli, ZHENG Jing. Occurrence and Associated Risk Assessment of Bisphenols and Brominated Flame Retardants in the Water Sources of the Middle and Lower Reaches of the Beijiang River [J]. Ecology and Environmental Sciences, 2025, 34(7): 1007-1019. |
| [5] | CAI Min, ZHOU Li, ZHANG Xu, CUI Naxin, PANG Si, ZOU Guoyan, YUAN Quan, HUANG Weiwei, ZHAO Zhiyong. Effects of Plant Extracts on Phytoplankton Community Structure and Function in Aquaculture Water [J]. Ecology and Environmental Sciences, 2025, 34(7): 1090-1099. |
| [6] | HUANG Yi, LAN Ting, SHENG Jiliang. Changes in Human Activity Intensity on the Spatial and Temporal Distribution of PM2.5 in Chengdu-Chongqing Economic Circle [J]. Ecology and Environmental Sciences, 2025, 34(7): 1111-1120. |
| [7] | LIU Yue, XU Jie, DU Ling, HE Yuping, LIU Xuefeng, YIN Qiang, MENG Yuanfa. Diversity and Molecular Biological Identification of Biological Crust Cyanobacteria and Green Algae Species in Kubuqi Desert [J]. Ecology and Environmental Sciences, 2025, 34(3): 421-431. |
| [8] | LIU Jiayi, ZHANG Jun, ZHANG Fan, ZHANG Hui, WANG Zihan, LIU Juhong, LÜ Shijie. Effects of Enclosure on Interspecific Association of Dominant Species of Stipa breviflora in Desert Steppe [J]. Ecology and Environmental Sciences, 2025, 34(2): 247-255. |
| [9] | NGA Wang norbu, WANG Junwei, ZENG Zhefei, LI Wei, NAO Zengcuo, TAN Xin, LA Qiong. Niche and Interspecific Association of Plant Communities in the Yani Wetland Shoals [J]. Ecology and Environmental Sciences, 2025, 34(10): 1558-1568. |
| [10] | LIU Dongyi, QU Yonghua, FENG Yaowei, QU Ran. Research on Chromium Ion Content Inversion of GF-5 Satellite Images Based on Grid Search Optimization CatBoost Model [J]. Ecology and Environmental Sciences, 2024, 33(9): 1460-1470. |
| [11] | FAN Beibie, DING Shuai, ZHANG Tiantian, ZHANG Shuai, WEI Lulu, CHEN Qing. Simulation Study on Phosphorus Loss Risk with Periodic Flooding-Drying and Straw Incorporation in a Dolomite-Amended Brown Soil [J]. Ecology and Environmental Sciences, 2024, 33(8): 1203-1213. |
| [12] | LU Cong. Removal Effect and Mechanism of DBDPE in Sediments by Biochar-loaded Nano-zero-valent Iron [J]. Ecology and Environmental Sciences, 2024, 33(8): 1279-1288. |
| [13] | LI Yucai, YANG Lei, LIANG Xian, MENG Hongyan, LIU Huanhuan, SHI Hui, REN Yongxiang. Transcriptomics Analysis Reveals the Impact of Humic Acid on the Toxicity of Nano-Cr2O3 to Chlorella sp. [J]. Ecology and Environmental Sciences, 2024, 33(8): 1289-1297. |
| [14] | WANG Zihan, LÜ Shijie, WANG Zhongwu, LIU Hongmei. Effects of Grazing Intensity on Dominant Population and Species Diversity and Their Typical Relationships [J]. Ecology and Environmental Sciences, 2024, 33(6): 869-876. |
| [15] | WEI Daixiao, MEN Yatai, LI Yaojie, XU Mingyi, CAI Wenxiu, SHEN Guofeng. Environmental Health Benefits and Cost Analysis of Using Biomass Pellets for Space Heating [J]. Ecology and Environmental Sciences, 2024, 33(6): 927-934. |
| Viewed | ||||||
|
Full text |
|
|||||
|
Abstract |
|
|||||
Copyright © 2021 Editorial Office of ACTA PETROLEI SINICA
Address:No. 6 Liupukang Street, Xicheng District, Beijing, P.R.China, 510650
Tel: 86-010-62067128, 86-010-62067137, 86-010-62067139
Fax: 86-10-62067130
Email: syxb@cnpc.com.cn
Support byBeijing Magtech Co.ltd, E-mail:support@magtech.com.cn