Ecology and Environment ›› 2024, Vol. 33 ›› Issue (6): 908-918.DOI: 10.16258/j.cnki.1674-5906.2024.06.008
• Research Article [Ecology] • Previous Articles Next Articles
LIAO Hongsheng1,2( ), WEI Wei1,2,3,*(), SHI Yu1,2
Received:2024-03-14
Online:2024-06-18
Published:2024-07-30
Contact:
WEI Wei
廖洪圣1,2(), 卫伟1,2,3,*(), 石宇1,2
通讯作者:
卫伟
作者简介:廖洪圣(1997年生),男,硕士研究生,研究方向为区域生态环境演变监测。E-mail: lhs769160981@163.com
基金资助:CLC Number:
LIAO Hongsheng, WEI Wei, SHI Yu. Characteristics of Spatial and Temporal Evolution of Soil Erosion in Typical Watersheds in Loess Hilly Areas and Its Driving Mechanisms: A Case Study of Zuli River[J]. Ecology and Environment, 2024, 33(6): 908-918.
廖洪圣, 卫伟, 石宇. 黄土丘陵区典型流域土壤侵蚀时空演变特征及其驱动机制:以祖厉河为例[J]. 生态环境学报, 2024, 33(6): 908-918.
Add to citation manager EndNote|Ris|BibTeX
URL: https://www.jeesci.com/EN/10.16258/j.cnki.1674-5906.2024.06.008

Figure 1 Location of the study area
| 因子类型 | 因子名称 | 分辨率 | 单位 | 数据来源 |
|---|---|---|---|---|
| 气候要素 | 气温 | 1 km | ℃ | ERA5气象数据集 ( |
| 降水 | 1 km | mm | CHIRPS气候灾害组红外降水与站数据集 ( | |
| 植被要素 | 植被覆盖度 | 30 m | 国家生态科学数据中心 ( | |
| 土壤要素 | 砂粒含量 | 30 m | % | 世界土壤数据库 (HWSD) 土壤数据集 ( |
| 粉粒含量 | 30 m | % | 世界土壤数据库 (HWSD) 土壤数据集 ( | |
| 粘粒含量 | 30 m | % | 世界土壤数据库 (HWSD) 土壤数据集 ( | |
| 含碳量 | 30 m | % | 世界土壤数据库 (HWSD) 土壤数据集 ( | |
| 地貌地形要素 | 高程 | 30 m | m | 美国航空航天局 ( |
| 坡度 | 30 m | ° | ArcGIS 10.2软件计算生成 | |
| 坡向 | 30 m | ArcGIS 10.2软件计算生成 | ||
| 地貌类型 | 30 m | 中国科学院资源环境与数据中心 ( | ||
| 土地利用要素 | 土地利用类型 | 30 m | 中国科学院资源环境与数据中心 ( | |
| 距离道路距离 | 30 m | m | 中国科学院资源环境与数据中心 ( | |
| 梯田分布密度 | 30 m | 中国黄土高原梯田变化数据 ( | ||
| 社会经济要素 | 人口密度 | 100 m | person∙km−2 | 世界人口分布数据集 ( |
| 夜间灯光 | 1 km | NOAA夜间灯光数据集 ( | ||
| GDP | 1 km | yuan∙person−1 | 地球数据资源云 ( |
Table 1 Data types and sources
| 因子类型 | 因子名称 | 分辨率 | 单位 | 数据来源 |
|---|---|---|---|---|
| 气候要素 | 气温 | 1 km | ℃ | ERA5气象数据集 ( |
| 降水 | 1 km | mm | CHIRPS气候灾害组红外降水与站数据集 ( | |
| 植被要素 | 植被覆盖度 | 30 m | 国家生态科学数据中心 ( | |
| 土壤要素 | 砂粒含量 | 30 m | % | 世界土壤数据库 (HWSD) 土壤数据集 ( |
| 粉粒含量 | 30 m | % | 世界土壤数据库 (HWSD) 土壤数据集 ( | |
| 粘粒含量 | 30 m | % | 世界土壤数据库 (HWSD) 土壤数据集 ( | |
| 含碳量 | 30 m | % | 世界土壤数据库 (HWSD) 土壤数据集 ( | |
| 地貌地形要素 | 高程 | 30 m | m | 美国航空航天局 ( |
| 坡度 | 30 m | ° | ArcGIS 10.2软件计算生成 | |
| 坡向 | 30 m | ArcGIS 10.2软件计算生成 | ||
| 地貌类型 | 30 m | 中国科学院资源环境与数据中心 ( | ||
| 土地利用要素 | 土地利用类型 | 30 m | 中国科学院资源环境与数据中心 ( | |
| 距离道路距离 | 30 m | m | 中国科学院资源环境与数据中心 ( | |
| 梯田分布密度 | 30 m | 中国黄土高原梯田变化数据 ( | ||
| 社会经济要素 | 人口密度 | 100 m | person∙km−2 | 世界人口分布数据集 ( |
| 夜间灯光 | 1 km | NOAA夜间灯光数据集 ( | ||
| GDP | 1 km | yuan∙person−1 | 地球数据资源云 ( |
| 因子名称 | 计算公式 | 参数说明 |
|---|---|---|
| 降水因子R | $R\mathrm{=}17.02\times \sum\limits_{i=1}^{12}{\left( 1.735\times {{10}^{\left( 1.5\times \lg \frac{p_{i}^{2}}{p}-0.8188 \right)}} \right)}$ | R——降水因子; P——年均降水量; Pi ——第i月的月均降水量 |
| 土壤可蚀因子K | $\begin{align} & K\mathrm{=}0.1317\times \left\{ 0.2+0.3\exp \left[ -0.0256{{S}_{\mathrm{a}}}\left( 1-\frac{{{S}_{\mathrm{i}}}}{100} \right) \right] \right\}\times \left( \frac{{{S}_{\mathrm{i}}}}{{{C}_{\mathrm{l}}}+{{S}_{\mathrm{i}}}} \right)\times \\ & \left[ 1-\frac{0.25{{O}_{\mathrm{c}}}}{{{O}_{\mathrm{c}}}+\exp (3.72-2.95{{O}_{\mathrm{c}}})} \right]\times \left[ 1-\frac{0.7{{S}_{\mathrm{n}}}}{{{S}_{\mathrm{n}}}+\exp (22.9{{S}_{\mathrm{n}}}-5.51)} \right] \\ \end{align}$ | K——土壤可蚀因子; Sa——砂粒含量; Si ——粉粒含量; Cl——黏土含量; Oc——土壤有机碳含量; Sn=(1−Sa/100) |
| 地形因子L和S | $\begin{array}{c} S=\left\{\begin{array}{cr} 10.8 \times \sin \theta+0.036 & \theta<5.1428^{\circ} \\ 16.8 \times \sin \theta-0.5 & 5.1428^{\circ} \leq \theta \leq 14.032^{\circ} \\ 21.97 \times \sin \theta-0.96 & \theta \geq 14.0362^{\circ} \end{array}\right. \\ L=\left[\frac{\lambda}{22.13}\right]^{m} \\ m=\frac{\eta}{\eta+1} \\ \eta=\frac{\frac{\sin \theta}{0.0896}}{\left[(3 \times \sin \theta)^{0.8}+0.56\right]} \end{array}$ | S和L——坡度因子和坡长因子; θ——坡度; λ——水平投影长度; m——坡长指数; η——细沟侵蚀度和面蚀侵蚀度的比值 |
| 植被覆盖因子C | $\begin{array}{c} C=\left\{\begin{array}{ll} C=1 &F_{\mathrm{v}}=0 \\ C=0.6508-0.3436 \times \lg F_{\mathrm{v}} & 0<F_{\mathrm{v}}<78.3 \% \\ C=0 & F_{\mathrm{v}} \geq 78.3 \% \end{array}\right. \\ \qquad F_{\mathrm{v}}=\frac{N-N_{\mathrm{s}}}{N_{\mathrm{v}}-N_{\mathrm{s}}} \end{array}$ | C——植被覆盖因子; Fv——植被覆盖度; N——归一化植被指数; Ns——裸土像元归一化植被指数; Nv——全植被覆盖像元归一化植被指数 |
Table 2 Formulas and descriptions of the factors
| 因子名称 | 计算公式 | 参数说明 |
|---|---|---|
| 降水因子R | $R\mathrm{=}17.02\times \sum\limits_{i=1}^{12}{\left( 1.735\times {{10}^{\left( 1.5\times \lg \frac{p_{i}^{2}}{p}-0.8188 \right)}} \right)}$ | R——降水因子; P——年均降水量; Pi ——第i月的月均降水量 |
| 土壤可蚀因子K | $\begin{align} & K\mathrm{=}0.1317\times \left\{ 0.2+0.3\exp \left[ -0.0256{{S}_{\mathrm{a}}}\left( 1-\frac{{{S}_{\mathrm{i}}}}{100} \right) \right] \right\}\times \left( \frac{{{S}_{\mathrm{i}}}}{{{C}_{\mathrm{l}}}+{{S}_{\mathrm{i}}}} \right)\times \\ & \left[ 1-\frac{0.25{{O}_{\mathrm{c}}}}{{{O}_{\mathrm{c}}}+\exp (3.72-2.95{{O}_{\mathrm{c}}})} \right]\times \left[ 1-\frac{0.7{{S}_{\mathrm{n}}}}{{{S}_{\mathrm{n}}}+\exp (22.9{{S}_{\mathrm{n}}}-5.51)} \right] \\ \end{align}$ | K——土壤可蚀因子; Sa——砂粒含量; Si ——粉粒含量; Cl——黏土含量; Oc——土壤有机碳含量; Sn=(1−Sa/100) |
| 地形因子L和S | $\begin{array}{c} S=\left\{\begin{array}{cr} 10.8 \times \sin \theta+0.036 & \theta<5.1428^{\circ} \\ 16.8 \times \sin \theta-0.5 & 5.1428^{\circ} \leq \theta \leq 14.032^{\circ} \\ 21.97 \times \sin \theta-0.96 & \theta \geq 14.0362^{\circ} \end{array}\right. \\ L=\left[\frac{\lambda}{22.13}\right]^{m} \\ m=\frac{\eta}{\eta+1} \\ \eta=\frac{\frac{\sin \theta}{0.0896}}{\left[(3 \times \sin \theta)^{0.8}+0.56\right]} \end{array}$ | S和L——坡度因子和坡长因子; θ——坡度; λ——水平投影长度; m——坡长指数; η——细沟侵蚀度和面蚀侵蚀度的比值 |
| 植被覆盖因子C | $\begin{array}{c} C=\left\{\begin{array}{ll} C=1 &F_{\mathrm{v}}=0 \\ C=0.6508-0.3436 \times \lg F_{\mathrm{v}} & 0<F_{\mathrm{v}}<78.3 \% \\ C=0 & F_{\mathrm{v}} \geq 78.3 \% \end{array}\right. \\ \qquad F_{\mathrm{v}}=\frac{N-N_{\mathrm{s}}}{N_{\mathrm{v}}-N_{\mathrm{s}}} \end{array}$ | C——植被覆盖因子; Fv——植被覆盖度; N——归一化植被指数; Ns——裸土像元归一化植被指数; Nv——全植被覆盖像元归一化植被指数 |
| 因子名称 | 普通耕地 | 梯田耕地 | 林地 | 草地 | 水体 | 建设用地 | 裸地 |
|---|---|---|---|---|---|---|---|
| p值 | 1 | 0.084 | 0.17 | 0.3 | 0 | 0 | 1 |
Table 3 P-factor assignment table
| 因子名称 | 普通耕地 | 梯田耕地 | 林地 | 草地 | 水体 | 建设用地 | 裸地 |
|---|---|---|---|---|---|---|---|
| p值 | 1 | 0.084 | 0.17 | 0.3 | 0 | 0 | 1 |
| 级别 | 平均侵蚀模数/(t∙km−2∙a−1) | 平均流失厚度/(mm∙a−1) |
|---|---|---|
| 无侵蚀 | 0 | 0 |
| 微度侵蚀 | 0‒1000 | 0‒0.74 |
| 轻度侵蚀 | 1000‒2500 | 0.74‒1.9 |
| 中度侵蚀 | 2500‒5000 | 1.9‒3.7 |
| 强烈侵蚀 | 5000‒8000 | 3.7‒5.9 |
| 极强烈侵蚀 | 8000‒15000 | 5.9‒11.1 |
| 剧烈侵蚀 | >15000 | >11.1 |
Table 4 Soil erosion intensity classification table
| 级别 | 平均侵蚀模数/(t∙km−2∙a−1) | 平均流失厚度/(mm∙a−1) |
|---|---|---|
| 无侵蚀 | 0 | 0 |
| 微度侵蚀 | 0‒1000 | 0‒0.74 |
| 轻度侵蚀 | 1000‒2500 | 0.74‒1.9 |
| 中度侵蚀 | 2500‒5000 | 1.9‒3.7 |
| 强烈侵蚀 | 5000‒8000 | 3.7‒5.9 |
| 极强烈侵蚀 | 8000‒15000 | 5.9‒11.1 |
| 剧烈侵蚀 | >15000 | >11.1 |

Figure 2 Changes in the spatial distribution of soil erosion intensity
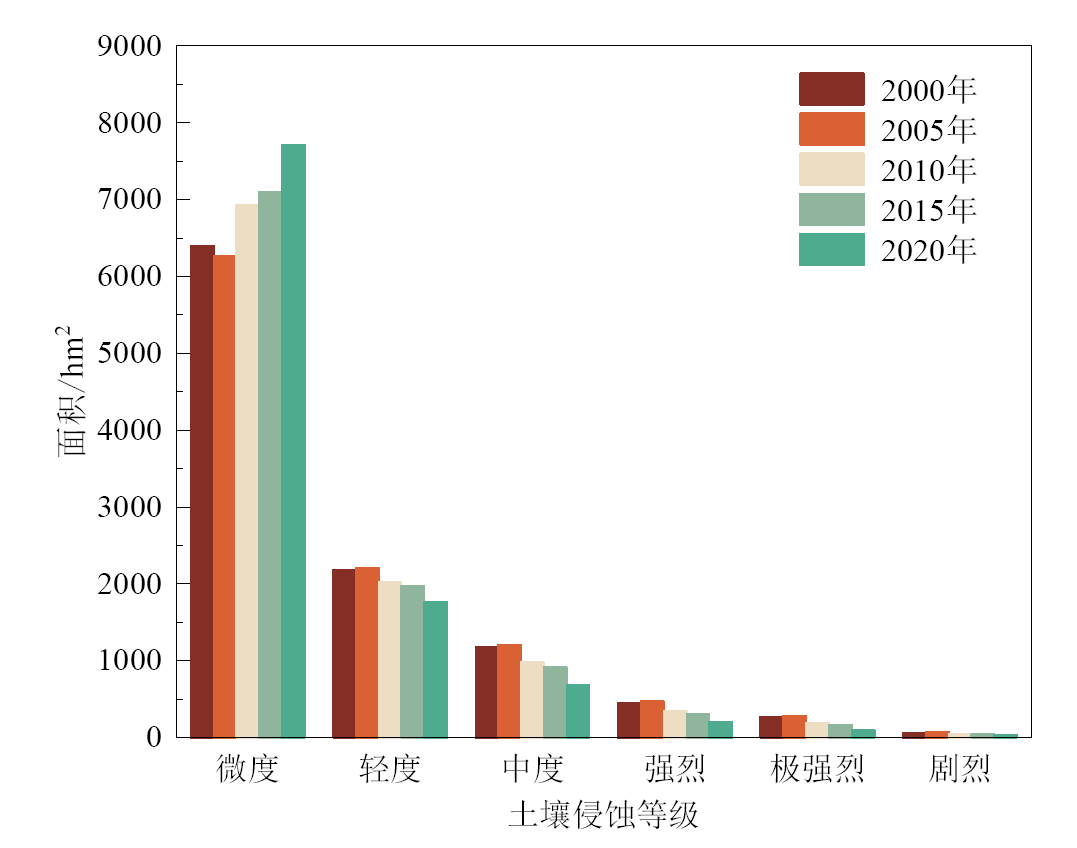
Figure 3 Changes in the temporal distribution of soil erosion intensity
| 2000年 | 2010年 | ||||||||
|---|---|---|---|---|---|---|---|---|---|
| 无侵蚀 | 微度 | 轻度 | 中度 | 强烈 | 极强烈 | 剧烈 | 转出面积 | 转出率/% | |
| 无侵蚀 | 113 | 27.7 | 1.92 | 0.79 | 0.26 | 0.17 | 0.06 | 30.9 | 21.5 |
| 微度 | 45.6 | 5715 | 387 | 144 | 58.4 | 27.8 | 10.2 | 674 | 10.5 |
| 轻度 | 4.35 | 864 | 1188 | 85.8 | 14.7 | 12.7 | 6.92 | 988 | 45.4 |
| 中度 | 1.96 | 199 | 384 | 554 | 24.1 | 7.09 | 1.21 | 617 | 52.7 |
| 强烈 | 0.87 | 69.6 | 37.9 | 167 | 159 | 11.0 | 1.31 | 287 | 64.4 |
| 极强烈 | 0.46 | 42.1 | 13.8 | 23.1 | 80.1 | 107 | 3.24 | 163 | 60.2 |
| 剧烈 | 0.10 | 2.26 | 7.37 | 2.56 | 2.77 | 20.8 | 25.1 | 35.8 | 58.8 |
Table 5 Land erosion intensity transfer matrix 2000 to 2010
| 2000年 | 2010年 | ||||||||
|---|---|---|---|---|---|---|---|---|---|
| 无侵蚀 | 微度 | 轻度 | 中度 | 强烈 | 极强烈 | 剧烈 | 转出面积 | 转出率/% | |
| 无侵蚀 | 113 | 27.7 | 1.92 | 0.79 | 0.26 | 0.17 | 0.06 | 30.9 | 21.5 |
| 微度 | 45.6 | 5715 | 387 | 144 | 58.4 | 27.8 | 10.2 | 674 | 10.5 |
| 轻度 | 4.35 | 864 | 1188 | 85.8 | 14.7 | 12.7 | 6.92 | 988 | 45.4 |
| 中度 | 1.96 | 199 | 384 | 554 | 24.1 | 7.09 | 1.21 | 617 | 52.7 |
| 强烈 | 0.87 | 69.6 | 37.9 | 167 | 159 | 11.0 | 1.31 | 287 | 64.4 |
| 极强烈 | 0.46 | 42.1 | 13.8 | 23.1 | 80.1 | 107 | 3.24 | 163 | 60.2 |
| 剧烈 | 0.10 | 2.26 | 7.37 | 2.56 | 2.77 | 20.8 | 25.1 | 35.8 | 58.8 |
| 2000年 | 2010年 | ||||||||
|---|---|---|---|---|---|---|---|---|---|
| 无侵蚀 | 微度 | 轻度 | 中度 | 强烈 | 极强烈 | 剧烈 | 转出面积 | 转出率/% | |
| 无侵蚀 | 112 | 28.7 | 1.78 | 0.64 | 0.18 | 0.11 | 0.03 | 31.5 | 21.9 |
| 微度 | 61.0 | 5880 | 276 | 101 | 32.5 | 20.6 | 16.7 | 508 | 7.95 |
| 轻度 | 5.52 | 1395 | 700 | 46.3 | 10.8 | 9.16 | 8.82 | 1476 | 67.8 |
| 中度 | 2.48 | 260 | 671 | 220 | 11.2 | 3.41 | 3.21 | 951 | 81.2 |
| 强烈 | 1.09 | 79.6 | 81.1 | 241 | 39.2 | 3.46 | 1.19 | 407 | 91.2 |
| 极强烈 | 0.59 | 42.9 | 23.6 | 71.7 | 99.6 | 30.5 | 1.18 | 240 | 88.7 |
| 剧烈 | 0.12 | 5.82 | 3.82 | 5.13 | 9.44 | 29.1 | 7.45 | 53.4 | 87.8 |
Table 6 Land erosion intensity transfer matrix 2010 to 2020
| 2000年 | 2010年 | ||||||||
|---|---|---|---|---|---|---|---|---|---|
| 无侵蚀 | 微度 | 轻度 | 中度 | 强烈 | 极强烈 | 剧烈 | 转出面积 | 转出率/% | |
| 无侵蚀 | 112 | 28.7 | 1.78 | 0.64 | 0.18 | 0.11 | 0.03 | 31.5 | 21.9 |
| 微度 | 61.0 | 5880 | 276 | 101 | 32.5 | 20.6 | 16.7 | 508 | 7.95 |
| 轻度 | 5.52 | 1395 | 700 | 46.3 | 10.8 | 9.16 | 8.82 | 1476 | 67.8 |
| 中度 | 2.48 | 260 | 671 | 220 | 11.2 | 3.41 | 3.21 | 951 | 81.2 |
| 强烈 | 1.09 | 79.6 | 81.1 | 241 | 39.2 | 3.46 | 1.19 | 407 | 91.2 |
| 极强烈 | 0.59 | 42.9 | 23.6 | 71.7 | 99.6 | 30.5 | 1.18 | 240 | 88.7 |
| 剧烈 | 0.12 | 5.82 | 3.82 | 5.13 | 9.44 | 29.1 | 7.45 | 53.4 | 87.8 |

Figure 4 Soil erosion intensity transfer chord diagram

Figure 5 Spatially aggregated distribution of soil erosion moduli
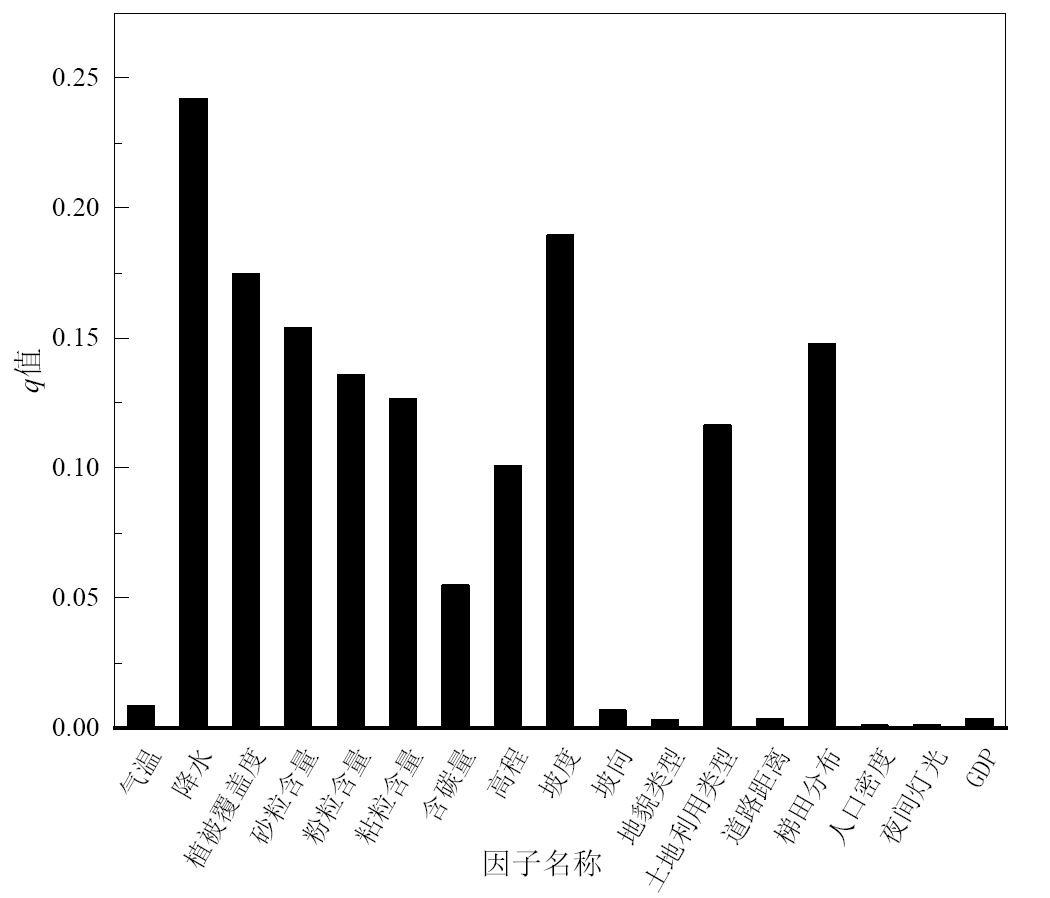
Figure 6 Soil erosion modulus single factor detection results
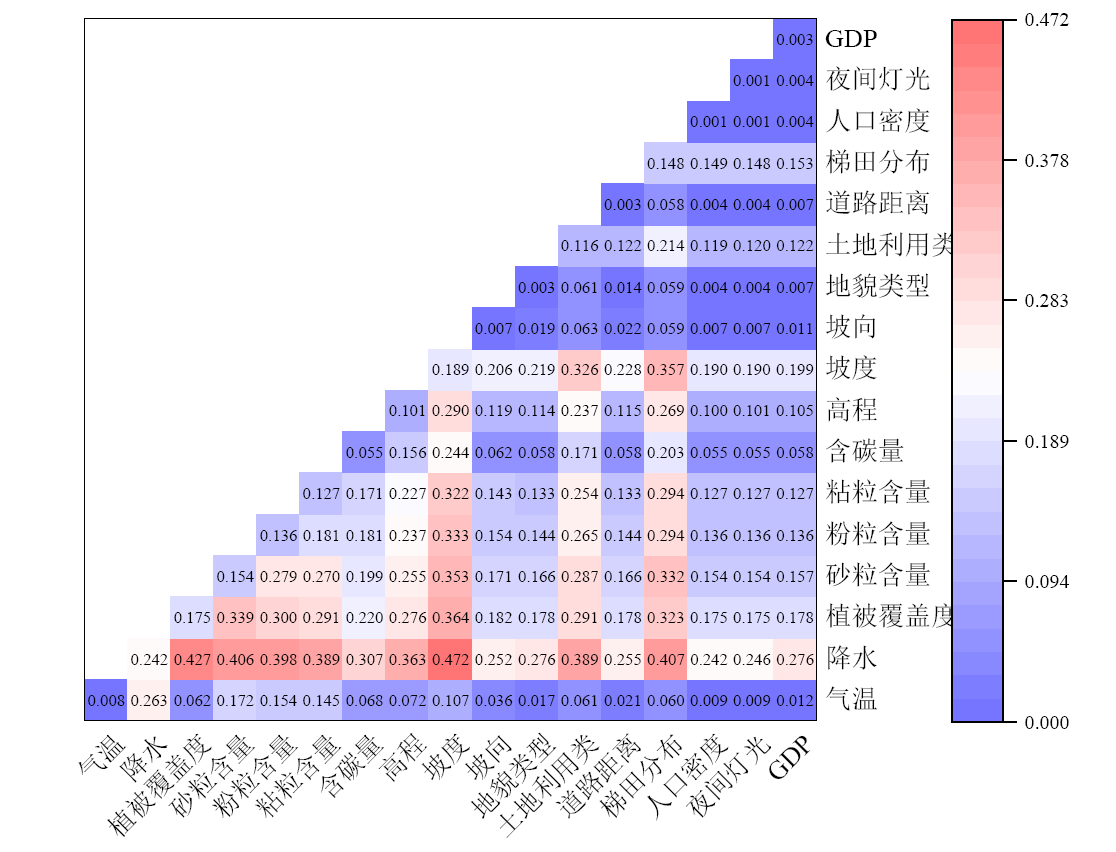
Figure 7 Soil erosion modulus two-factor interaction detection results
| 因子类型 | 因子名称 | 因子类型或分布范围 | 土壤侵蚀模数 |
|---|---|---|---|
| 气候要素 | 气温 | 0‒5 ℃ | 2.536×10³ |
| 降水 | 500—550 mm | 1.783×10³ | |
| 植被要素 | 植被覆盖度 | 低植被覆盖 | 2.639×10³ |
| 土壤要素 | 砂粒含量 | 45%‒76% | 3.029×10³ |
| 粉粒含量 | 43%‒54% | 1.721×10³ | |
| 粘粒含量 | 21%‒23% | 2.419×10³ | |
| 含碳量 | 1%‒1.95% | 5.766×10³ | |
| 地貌地形要素 | 高程 | 1856‒1941 m | 4.07×10³ |
| 坡度 | 33.1°‒40° | 5.322×10³ | |
| 坡向 | 东 | 1.825×10³ | |
| 地貌类型 | 中起伏山 | 1.912×10³ | |
| 土地利用要素 | 土地利用类型 | 裸地 | 2.3×10³ |
| 距离道路距离 | 11000‒13000 m | 1.788×10³ | |
| 梯田分布密度 | 少量梯田分布 | 2.391×10³ | |
| 社会经济要素 | 人口密度 | 10‒20 person∙km−2 | 1.695×10³ |
| 夜间灯光反射值 | 40‒50 | 4.734×10³ | |
| GDP | 2000‒3000 yuan∙a−1 | 2.887×10³ |
Table 7 Driver risk zone detection results
| 因子类型 | 因子名称 | 因子类型或分布范围 | 土壤侵蚀模数 |
|---|---|---|---|
| 气候要素 | 气温 | 0‒5 ℃ | 2.536×10³ |
| 降水 | 500—550 mm | 1.783×10³ | |
| 植被要素 | 植被覆盖度 | 低植被覆盖 | 2.639×10³ |
| 土壤要素 | 砂粒含量 | 45%‒76% | 3.029×10³ |
| 粉粒含量 | 43%‒54% | 1.721×10³ | |
| 粘粒含量 | 21%‒23% | 2.419×10³ | |
| 含碳量 | 1%‒1.95% | 5.766×10³ | |
| 地貌地形要素 | 高程 | 1856‒1941 m | 4.07×10³ |
| 坡度 | 33.1°‒40° | 5.322×10³ | |
| 坡向 | 东 | 1.825×10³ | |
| 地貌类型 | 中起伏山 | 1.912×10³ | |
| 土地利用要素 | 土地利用类型 | 裸地 | 2.3×10³ |
| 距离道路距离 | 11000‒13000 m | 1.788×10³ | |
| 梯田分布密度 | 少量梯田分布 | 2.391×10³ | |
| 社会经济要素 | 人口密度 | 10‒20 person∙km−2 | 1.695×10³ |
| 夜间灯光反射值 | 40‒50 | 4.734×10³ | |
| GDP | 2000‒3000 yuan∙a−1 | 2.887×10³ |
| [1] | ISLAM M R, JAAFAR W Z W, HIN L S, et al., 2020. Development of an erosion model for Langat River Basin, Malaysia, adapting GIS and RS in RUSLE[J]. Applied Water Science, 10(7): 165. |
| [2] | PHINZI K, NGETAR N S, 2019. The assessment of water-borne erosion at catchment level using GIS-based RUSLE and remote sensing: A review[J]. International Soil and Water Conservation Research, 7(1): 27-46. |
| [3] | RENARD K G, FOSTER G R, WEESIES G A, et al., 1991. RUSLE: Revised universal soil loss equation[J]. Journal of Soil and Water Conservation, 46(1): 30-33. |
| [4] | TAGIL S, 2007. Land degradation risk assessment for Tuzla Creek Basin (Biga Peninsula) using a GIS-based RUSLE model[J]. Ekoloji, 17(65): 11-20. |
| [5] | WILLIAMS J, JONES C, KINIRY J, et al., 1989. The EPIC crop growth model[J]. Transactions of the ASAE, 32(2): 497-511. |
| [6] | WISCHMEIER W H, 1984. The USLE - some reflections[J]. Journal of Soil and Water Conservation, 39(2): 105-107. |
| [7] | 蔡崇法, 丁树文, 史志华, 等, 2000. 应用USLE模型与地理信息系统IDRISI预测小流域土壤侵蚀量的研究[J]. 水土保持学报, 14(2): 19-24. |
| CAI C F, DING S W, SHI Z H, et al., 2000. Study of applying USLE and geographical information system IDRISI to predict soil erosion in small watershed[J]. Journal of Soil and Water Conservation, 14(2): 19-24. | |
| [8] | 柴亚昕, 胡彦婷, 张富, 等, 2022. 基于RUSLE的祖厉河上游会师流域土壤侵蚀及敏感性分析[J]. 草原与草坪, 42(6): 128-135. |
| CHAI Y X, HU Y T, ZHANG F, et al., 2022. Soil erosion and sensitivity analysis in Huishi watershed of Zuli River Upper Reaches based on RUSLE[J]. Grassland and Turf, 42(6): 128-135. | |
| [9] | 陈蝶, 卫伟, 陈利顶, 等, 2016. 梯田生态系统服务与管理研究进展[J]. 山地学报, 34(3): 374-384. |
| CHEN D, WEI W, CHEN L D, et al., 2016. Progress of the ecosystem services and management of terraces[J]. Mountain Research, 34(3): 374-384. | |
| [10] | 傅伯杰, 陈利顶, 马克明, 1999. 黄土丘陵区小流域土地利用变化对生态环境的影响——以延安市羊圈沟流域为例[J]. 地理学报, 54(3): 51-56. |
| FU B J, CHEN L D, MA K M, 1999. The effect of land use change on the regional environment in the yangjuangou catchment in the Loess Plateau of China[J]. Acta Geographica Sinica, 54(3): 51-56. | |
| [11] | 巩杰, 陈利顶, 傅伯杰, 等, 2004. 黄土丘陵区小流域土地利用和植被恢复对土壤质量的影响[J]. 应用生态学报, 15(12): 2292-2296. |
| GONG J, CHEN L D, FU B J, et al., 2004. Effects of land use and vegetation restoration on soil quality in a small catchment of the Loess Plateau[J]. Chinese Journal of Applied Ecology, 15(12) :2292-2296. | |
| [12] | 郭佳昊, 李纯斌, 吴静, 2022. 基于InVEST模型的金塔县土壤侵蚀和土壤保持状况评价[J]. 草原与草坪, 42(5): 106-113. |
| GUO J H, LI C B, WU J, 2022. Research on soil erosion and soil conservation status in Jinta County based on InVEST model[J]. Grassland and Turf, 42(5): 106-113. | |
| [13] | 郭旭东, 陈利顶, 傅伯杰, 1999. 土地利用/土地覆被变化对区域生态环境的影响[J]. 环境工程学报, 7(6): 66-75. |
| GUO X D, CHEN L D, FU B J, 1999. Effects of land use/land cover changes on regional ecological environment[J]. Chinese Journal of Environmental Engineering, 7(6): 66-75. | |
| [14] | 焦金鱼, 贵立德, 2016. 基于GIS的祖厉河流域土壤侵蚀治理模式模拟研究[J]. 水土保持学报, 30(5): 95-101. |
| JIAO J Y, GUI L D, 2016. Control Model of Soil Erosion in Zuli River Basin using GIS method[J]. Journal of Soil and Water Conservation, 30(5): 95-101. | |
| [15] | 李娜, 李雷, 白艳萍, 等, 2022. 祖厉河流域水土流失动态变化研究[J]. 中国水土保持, 43(8): 7-9. |
| LI N, LI L, BAI Y P, et al., 2022. Dynamic Changes of soil and water loss in Zuli River Basin[J]. Soil and Water Conservation in China, 43(8): 7-9. | |
| [16] | 李永红, 高照良, 2011. 黄土高原地区水土流失的特点、危害及治理[J]. 生态经济, 27(8): 148-153. |
| LI Y H, GAO Z L, 2011. The loess plateau area the characteristics of soil and water loss, damages and management[J]. Ecological Economy, 27(8): 148-153. | |
| [17] | 吕一河, 傅伯杰, 2001. 生态学中的尺度及尺度转换方法[J]. 生态学报, 21(12): 2096-2105. |
| LÜ Y H, FU B J, 2001. Ecological scale and scaling[J]. Acta Ecologica Sinica, 21(12): 2096-2105. | |
| [18] | 孟斌, 王劲峰, 张文忠, 等, 2005. 基于空间分析方法的中国区域差异研究[J]. 地理科学, 25(4): 393-400. |
|
MENG B, WANG J F, ZHANG W Z, et al., 2005. Evaluation of regional disparity in China based on spatial analysis[J]. Scientia Geographica Sinica, 25(4): 393-400.
DOI |
|
| [19] | 戚继阳, 张富, 赵传燕, 等, 2018. 基于GIS和RS的称钩河流域土壤侵蚀与土地利用关系分析[J]. 甘肃农业大学学报, 53(2): 94-102. |
| QI J Y, ZHANG F, ZHAO C Y, et al., 2018. Analysis on relationship between soil erosion and land use in Chenggou River Basin based on GIS and RS[J]. Journal of Gansu Agricultural University, 53(2): 94-102. | |
| [20] | 秦伟, 朱清科, 张岩, 2009. 基于GIS和RUSLE的黄土高原小流域土壤侵蚀评估[J]. 农业工程学报, 25(8): 157-163. |
| QIN W, ZHU Q K, ZHANG Y, 2009. Soil erosion assessment of small watershed in Loess Plateau based on GIS and RUSLE[J]. Transactions of the Chinese Society of Agricultural Engineering, 25(8): 157-163. | |
| [21] |
王欢, 高江波, 侯文娟, 2018. 基于地理探测器的喀斯特不同地貌形态类型区土壤侵蚀定量归因[J]. 地理学报, 73(9): 1674-1686.
DOI |
|
WANG H, GAO J B, HOU W J, 2018. Quantitative attribution analysis of soil erosion in different morphological types of geomorphology in karst areas: Based on the geographical detector method[J]. Acta Geographica Sinica, 73(9): 1674-1686.
DOI |
|
| [22] |
王劲峰, 徐成东, 2017. 地理探测器: 原理与展望[J]. 地理学报, 72(1): 116-134.
DOI |
|
WANG J F, XU C D, 2017. Geodetector: Principle and prospective[J]. Acta Geographica Sinica, 72(1): 116-134.
DOI |
|
| [23] | 王晓峰, 贾子续, 冯晓明, 等, 2023. 黄土高原土壤保持服务供需平衡及其驱动因素[J]. 生态学报, 43(7): 2722-2733. |
| WANG X F, JIA Z X, FENG X M, et al., 2023. Analysis on supply and demand balance of soil conservation service and its driving factors on the Loess Plateau[J]. Acta Ecologica Sinica, 43(7): 2722-2733. | |
| [24] | 吴成永, 曹广超, 陈克龙, 等, 2022. 黄河上游地区土壤保持服务时空变化及归因[J]. 水土保持学报, 36(4): 143-150. |
| WU C Y, CAO G C, CHEN K L, et al., 2023. Spatio-temporal variation in soil conservation service and its influencing factors in the upper reaches of the Yellow River[J]. Journal of Soil and Water Conservation, 36(4): 143-150. | |
| [25] | 谢怡凡, 姚顺波, 丁振民, 等, 2022. 退耕还林和地理特征对土壤侵蚀的关联影响——以陕西省107个县区为例[J]. 生态学报, 42(1): 301-312. |
| XIE Y F, YAO S B, DING Z M, et al., 2022. The Grain for Green project, geographical features and soil erosion: Taking 107 counties in Shaanxi Province as examples[J]. Acta Ecologica Sinica, 42(1): 301-312. | |
| [26] |
徐超璇, 鲁春霞, 黄绍琳, 2020. 张家口地区生态脆弱性及其影响因素[J]. 自然资源学报, 35(6): 1288-1300.
DOI |
| XU C X, LU C X, HUANG S L, 2020. Study on ecological vulnerability and its influencing factors in Zhangjiakou area[J]. Journal of Natural Resources, 35(6): 1288-1300. | |
| [27] | 徐静, 杨桂山, 许晨, 等, 2023. 湖库水源地流域生态系统服务权衡与多目标优化——以天目湖流域为例[J]. 长江流域资源与环境, 32(1): 62-70. |
| XU J, YANG G S, XU C, et al., 2023. Trade-offs and multi-objective optimization among ecosystem services in headwater catchments: A case study in Tianmu Lake Catchment[J]. Resources and Environment in the Yangtze Basin, 32(1): 62-70. | |
| [28] | 杨严攀, 田培, 沈晨竹, 等, 2024. 基于RUSLE模型和地理探测器的鄂西南土壤侵蚀脆弱性评价[J]. 水土保持学报, 38(1): 91-103. |
| YANG Y P, TIAN P, SHEN C Z, et al., 2024. Vulnerability assessment of soil erosion in southwestern Hubei Province based on RUSLE model and geographic detector[J]. Journal of Soil and Water Conservation, 38(1): 91-103. | |
| [29] | 姚雄, 余坤勇, 刘健, 等, 2016. 南方水土流失严重区的生态脆弱性时空演变[J]. 应用生态学报, 27(3): 735-45. |
| YAO X, YU K Y, LIU J, et al., 2016. Spatial and temporal changes of the ecological vulnerability in a serious soil erosion area, Southern China[J]. Chinese Journal of Applied Ecology, 27(3): 735-45. | |
| [30] | 张光辉, 刘宝元, 何小武, 2005. 黄土区原状土壤分离过程的水动力学机理研究[J]. 水土保持学报, 19(4): 48-52. |
| ZHANG G H, LIU B Y, HE X W, 2005. Study on hydro-dynamic mechanism of natural soil detachment in loess region[J]. Journal of Soil Water Conservation, 19(4): 48-52. | |
| [31] | 张志斌, 潘晶, 达福文, 2012. 西北地区中小城镇滨水空间生态治理与开发——以会宁县祖厉河城区段概念规划为例[J]. 城市问题, 31(7): 44-48. |
| ZHANG Z B, PAN J, DA F W, 2012. Ecological management and comprehensive development of the waterfront space in the northwest small and medium-sized towns: Taking the concept design for Zuli River in Huining County for an example[J]. Urban Problems, 31(7): 44-48. |
| Viewed | ||||||
|
Full text |
|
|||||
|
Abstract |
|
|||||
Website Copyright © 2021 Editorial Office of Ecology and Environmental Sciences
Add: 808# Tianyuan Road, Tianhe District, Guangzhou. 510650.
Institute of Eco-environmental and Soil Sciences, Guangdong Academy of Sciences
Tel/Fax: 020-87024961; E-mail: editor@jeesci.com
Support by Beijing Magtech Co. Ltd., E-mail: support@magtech.com.cn