Ecology and Environment ›› 2024, Vol. 33 ›› Issue (5): 745-756.DOI: 10.16258/j.cnki.1674-5906.2024.05.008
• Research Article [Environmental Science] • Previous Articles Next Articles
CHENG Peng1,*( ), SUN Mingdong2, SONG Xiaowei1
Received:2024-02-04
Online:2024-05-18
Published:2024-06-27
程鹏1,*(), 孙明东2, 宋晓伟1
通讯作者:
*
作者简介:程鹏(1989年生),男,副教授,博士,主要研究方向为流域水环境管理。E-mail: pengcheng@sxufe.edu.cn
基金资助:CLC Number:
CHENG Peng, SUN Mingdong, SONG Xiaowei. Study on the Spatial and Temporal Dynamic Evolution and Driving Factors of Grey Water Footprint in China[J]. Ecology and Environment, 2024, 33(5): 745-756.
程鹏, 孙明东, 宋晓伟. 中国灰水足迹时空动态演进及驱动因素研究[J]. 生态环境学报, 2024, 33(5): 745-756.
Add to citation manager EndNote|Ris|BibTeX
URL: https://www.jeesci.com/EN/10.16258/j.cnki.1674-5906.2024.05.008
| 指标 | 具体含义 |
|---|---|
| Z | 灰水足迹: 衡量用水污染的程度 |
| X1 | 经济规模效应: 为GDP, 代表生产力水平 |
| X2 | 灰水足迹强度效应: 为GWF与GDP的比率, 表明水污染控制的技术水平 |
| X3 | 自然禀赋效应: 为用水量, 代表水资源的消耗 |
| X4 | 技术效应: 为灰水足迹与用水量的比率, 衡量中国生产生活中每单位用水的水污染 |
| X5 | 人口规模效应: 为人口数, 代表常驻居民的规模 |
| X6 | 人均灰水排放效应: 为灰水足迹与人口数的比率, 衡量人均水污染程度 |
| X7 | 经济效率效应: 为GDP与人口数的比率, 代表人均生产力 |
| X8 | 用水强度效应: 为用水量与GDP的比率, 代表节水的技术水平 |
Table1 The index meaning of grey water footprint and its decomposition variables
| 指标 | 具体含义 |
|---|---|
| Z | 灰水足迹: 衡量用水污染的程度 |
| X1 | 经济规模效应: 为GDP, 代表生产力水平 |
| X2 | 灰水足迹强度效应: 为GWF与GDP的比率, 表明水污染控制的技术水平 |
| X3 | 自然禀赋效应: 为用水量, 代表水资源的消耗 |
| X4 | 技术效应: 为灰水足迹与用水量的比率, 衡量中国生产生活中每单位用水的水污染 |
| X5 | 人口规模效应: 为人口数, 代表常驻居民的规模 |
| X6 | 人均灰水排放效应: 为灰水足迹与人口数的比率, 衡量人均水污染程度 |
| X7 | 经济效率效应: 为GDP与人口数的比率, 代表人均生产力 |
| X8 | 用水强度效应: 为用水量与GDP的比率, 代表节水的技术水平 |
| 系数 | 猪 | 牛 | 羊 | 家禽 | ||||
|---|---|---|---|---|---|---|---|---|
| 粪便 | 尿 | 粪便 | 尿 | 粪便 | 粪便 | |||
| 粪便排放系数/ (kg·d−1) | 2.00 | 3.30 | 20.00 | 10.00 | 2.60 | 0.125 | ||
| 粪便中COD质量 分数/(g∙kg−1) | 52.00 | 9.00 | 31.00 | 6.00 | 4.63 | 45.65 | ||
| 入河系数/% | 5.50 | 8.59 | 6.16 | 5.58 | 5.50 | 8.59 | ||
Table 2 Excretion and delivery coefficients of COD load for livestock
| 系数 | 猪 | 牛 | 羊 | 家禽 | ||||
|---|---|---|---|---|---|---|---|---|
| 粪便 | 尿 | 粪便 | 尿 | 粪便 | 粪便 | |||
| 粪便排放系数/ (kg·d−1) | 2.00 | 3.30 | 20.00 | 10.00 | 2.60 | 0.125 | ||
| 粪便中COD质量 分数/(g∙kg−1) | 52.00 | 9.00 | 31.00 | 6.00 | 4.63 | 45.65 | ||
| 入河系数/% | 5.50 | 8.59 | 6.16 | 5.58 | 5.50 | 8.59 | ||
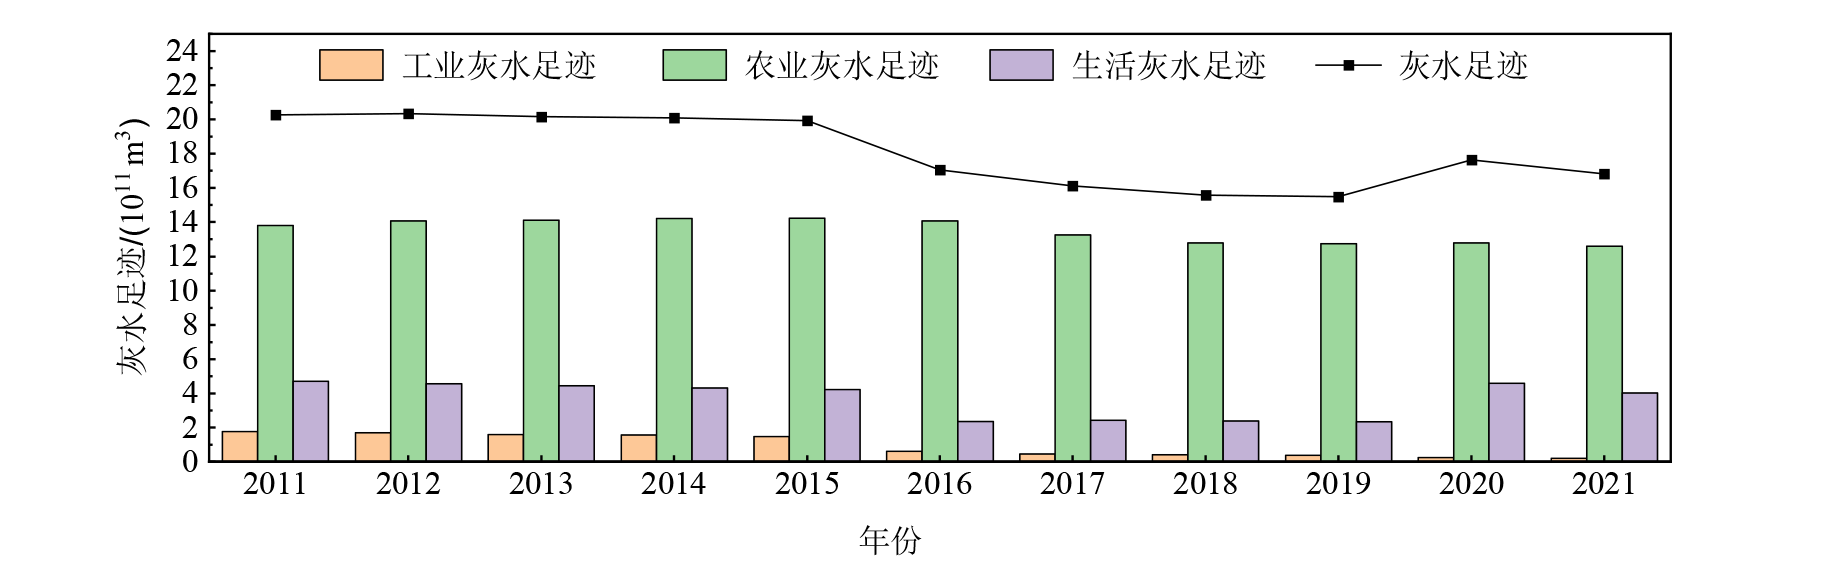
Figure 1 The temporal variation trend of grey water footprint and its components in China from 2011 to 2021
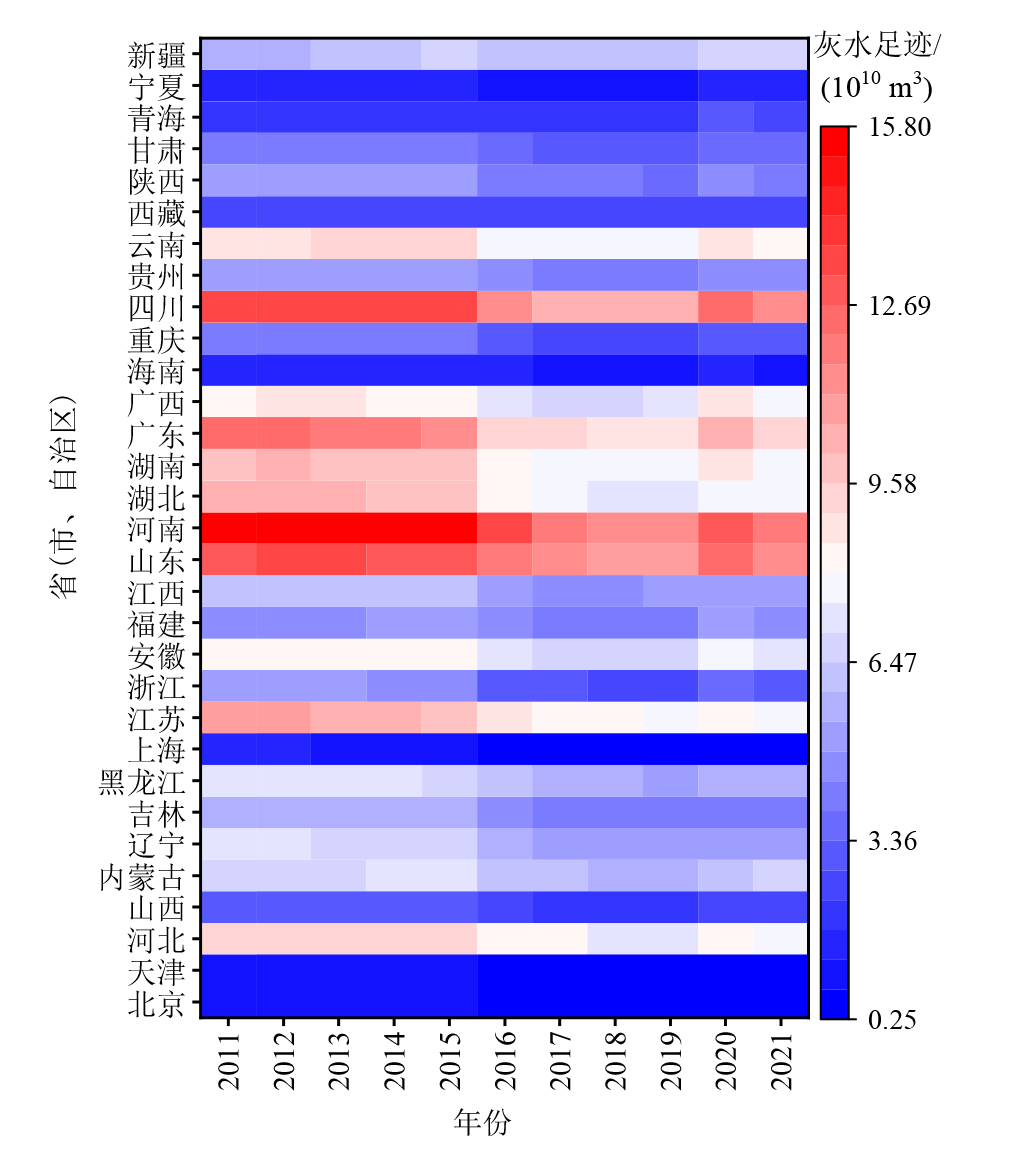
Figure 2 Temporal change trend of grey water footprint of provinces in China (excluding Hong Kong, Macao and Taiwan) from 2011 to 2021
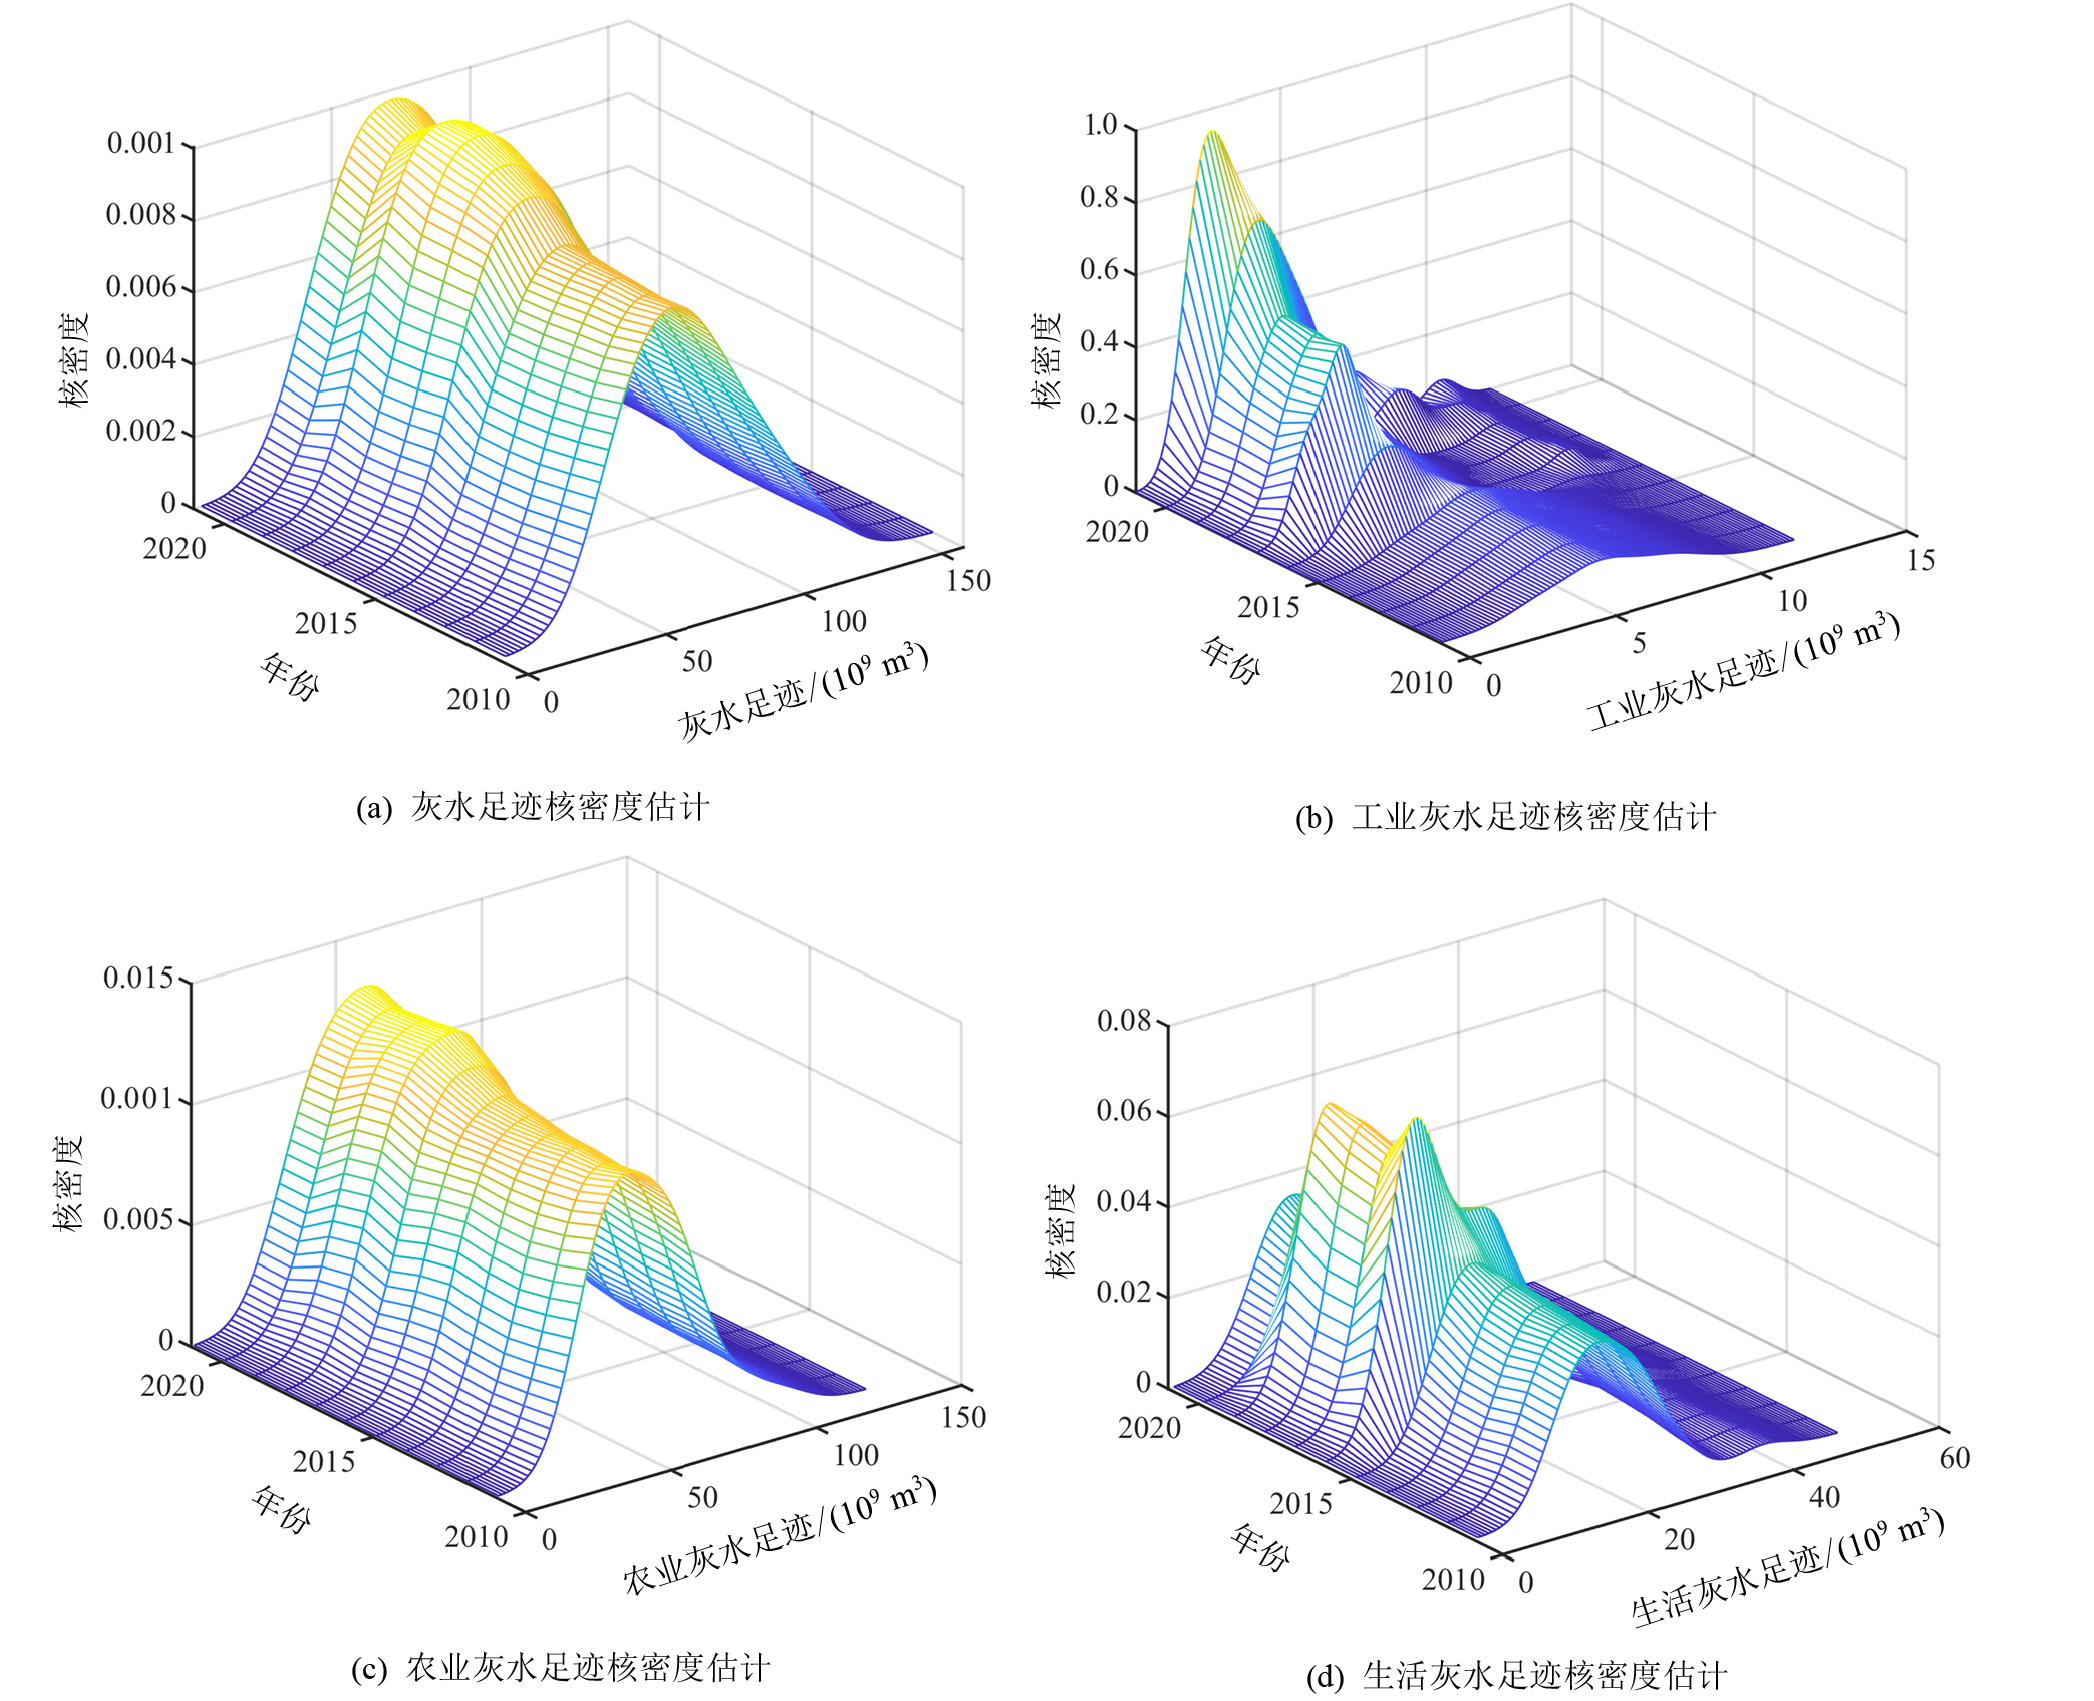
Figure 3 Kernel density estimation of grey water footprint and its composition in China
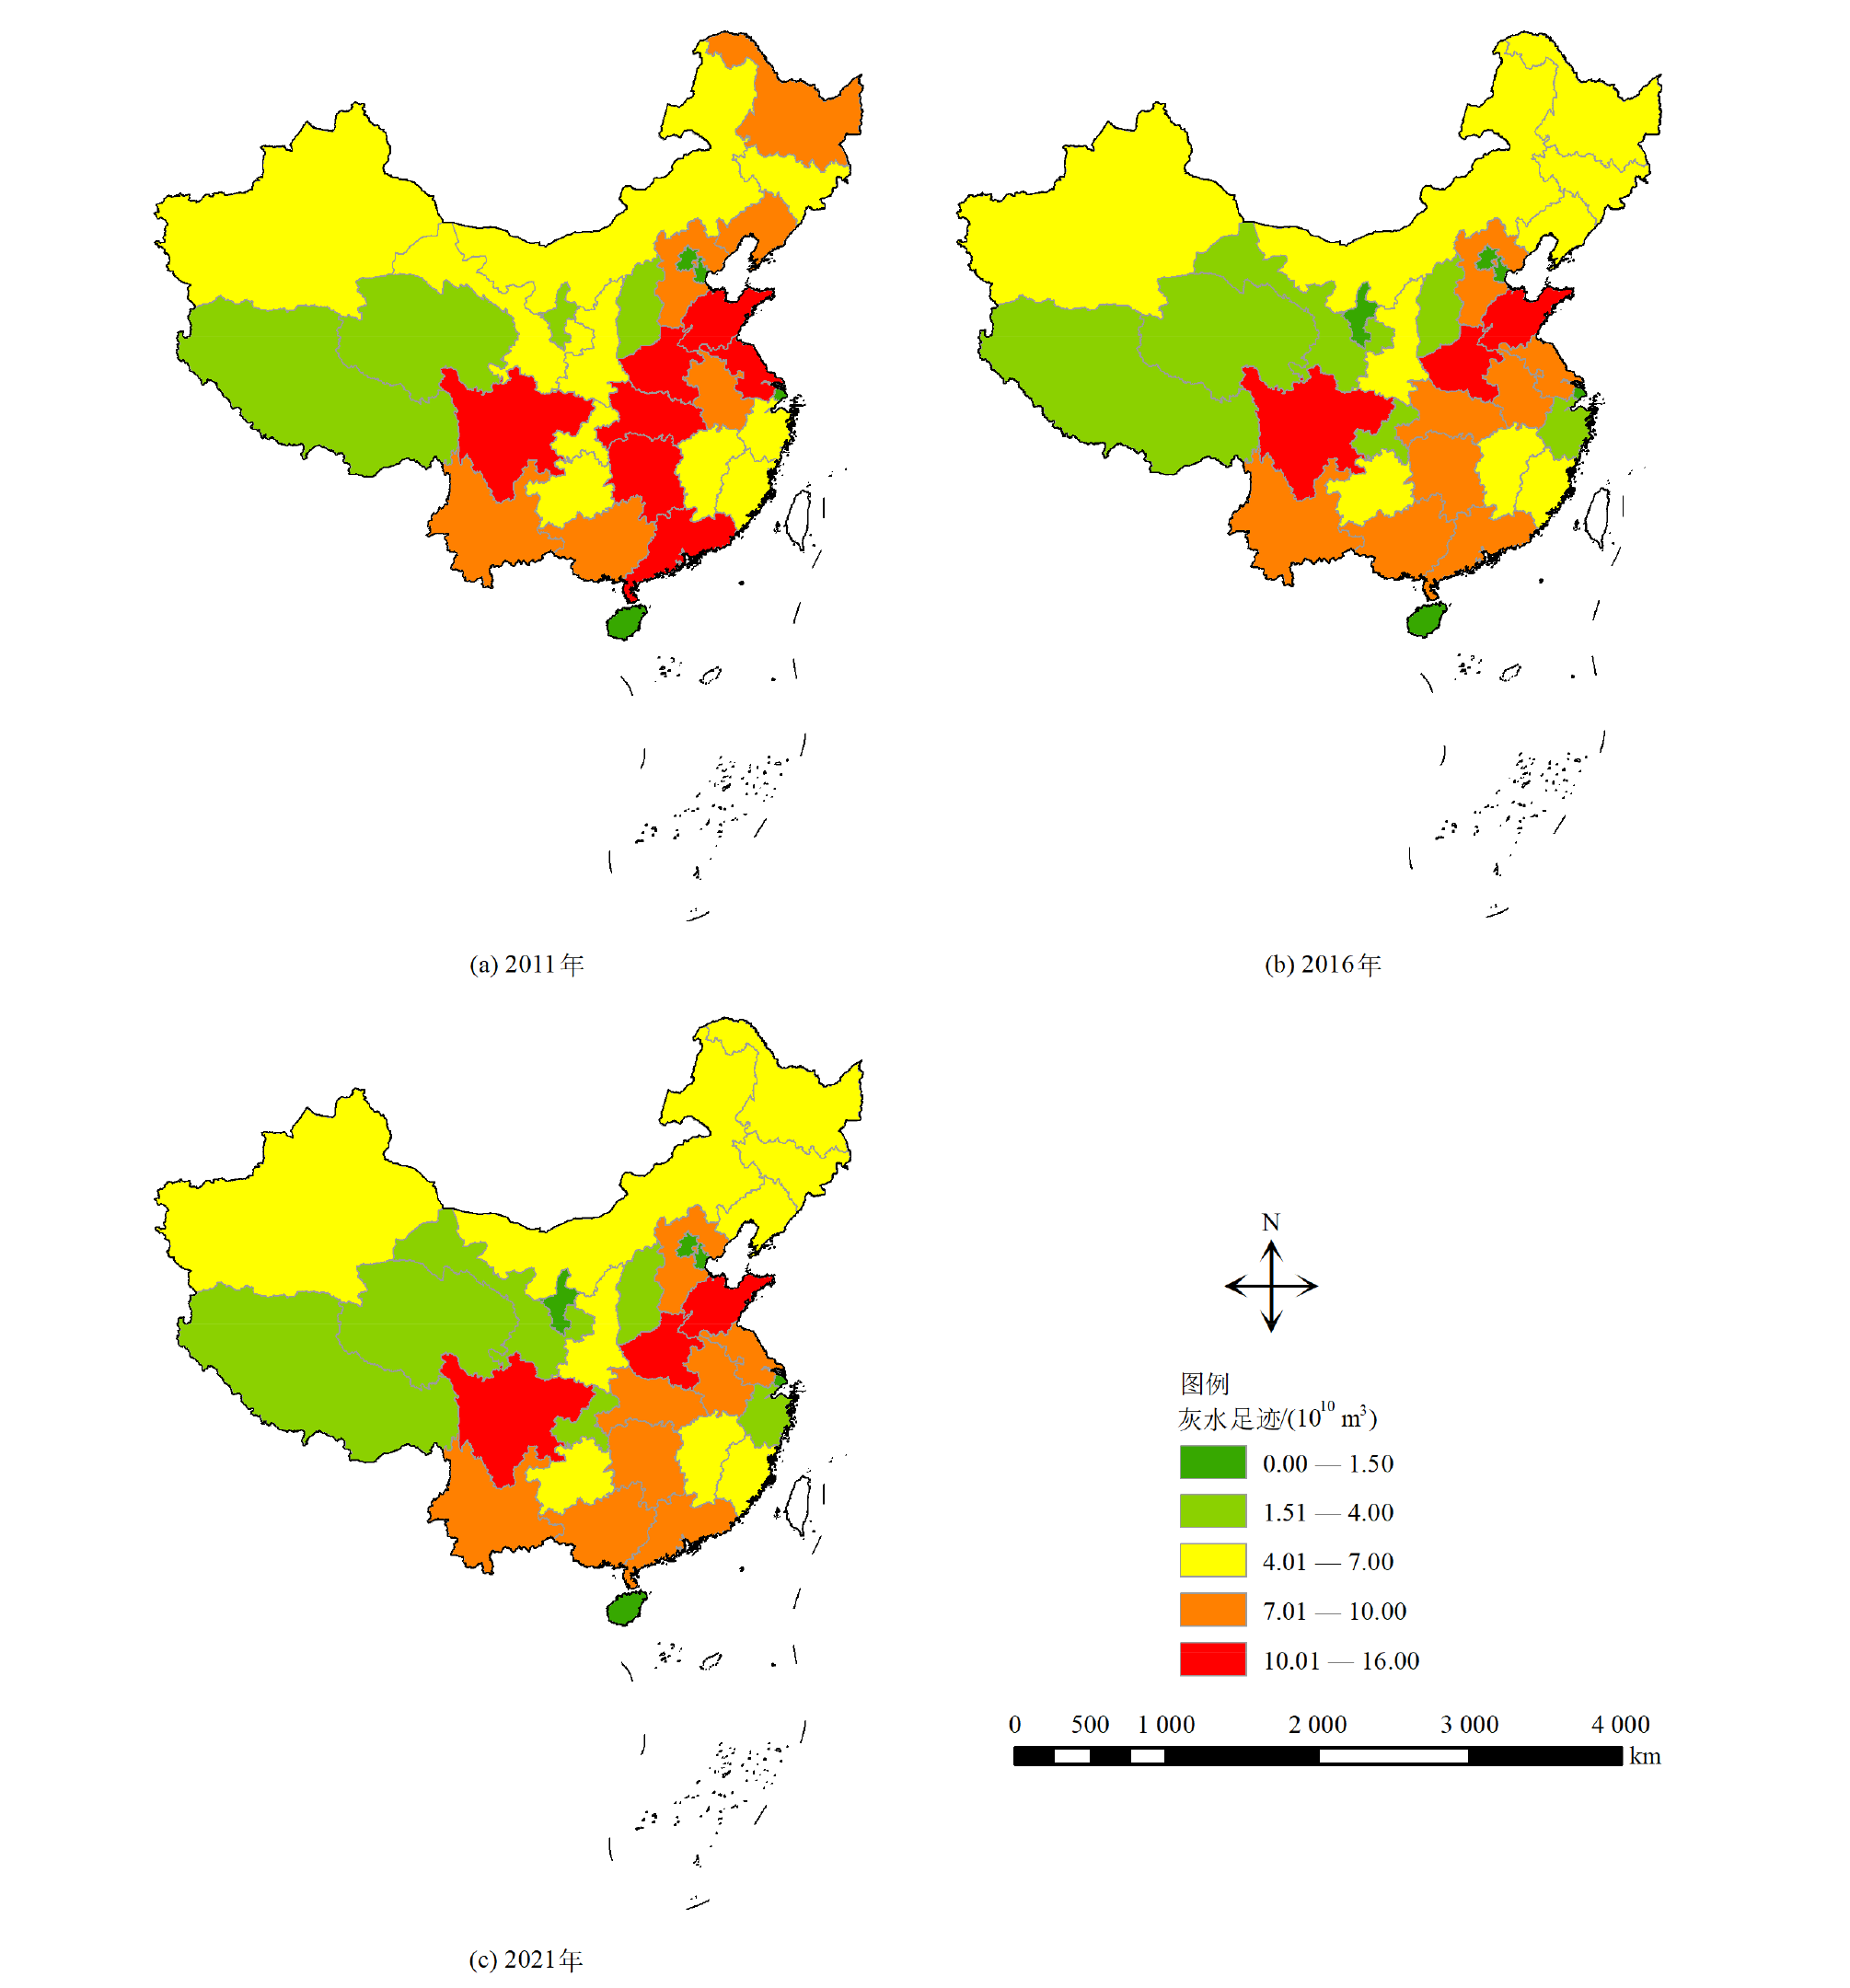
Figure 4 Spatial distribution of grey water footprint in China from 2011 to 2021.
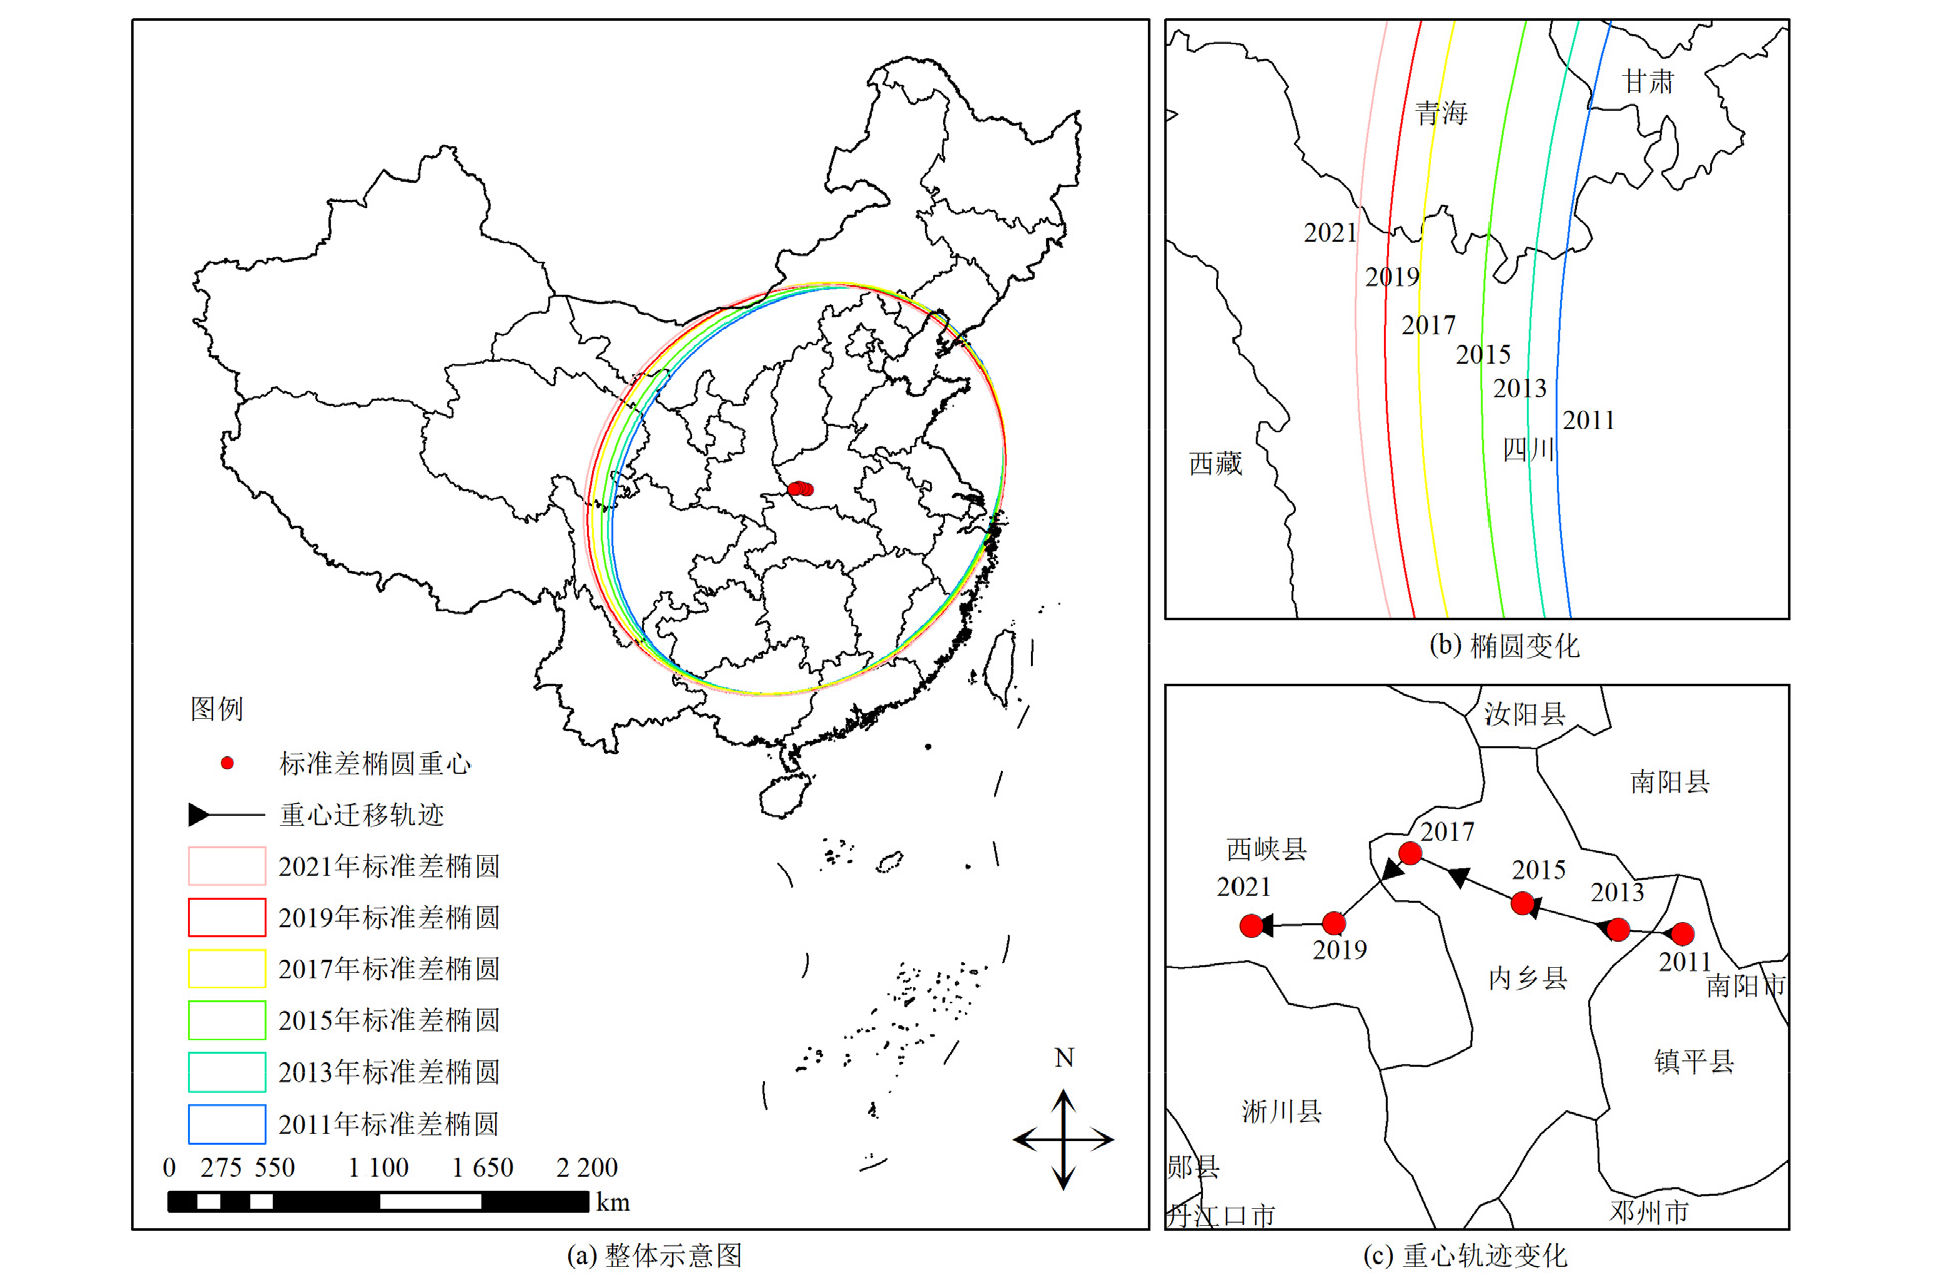
Figure 5 The standard deviation ellipse of grey water footprint and its shift of center of gravity in China from 2011 to 2021
| 年份 | 长半轴/km | 短半轴/km | 旋转角/(°) | 重心经度/(°) | 重心纬度/(°) | 重心地理位置 |
|---|---|---|---|---|---|---|
| 2011 | 1153.94 | 936.28 | 33.57 | 112.349 | 33.570 | 河南省南阳市镇平县 |
| 2013 | 1154.22 | 948.52 | 40.59 | 112.219 | 33.584 | 河南省南阳市内乡县 |
| 2015 | 1158.72 | 970.27 | 42.01 | 112.031 | 33.640 | 河南省南阳市内乡县 |
| 2017 | 1168.32 | 997.30 | 45.48 | 111.815 | 33.732 | 河南省南阳市内乡县 |
| 2019 | 1168.81 | 1010.03 | 47.82 | 111.649 | 33.629 | 河南省南阳市西峡县 |
| 2021 | 1165.12 | 1022.38 | 49.95 | 111.477 | 33.635 | 河南省南阳市西峡县 |
Table 3 Elliptic parameter of standard deviation of grey water footprint in provinces of China
| 年份 | 长半轴/km | 短半轴/km | 旋转角/(°) | 重心经度/(°) | 重心纬度/(°) | 重心地理位置 |
|---|---|---|---|---|---|---|
| 2011 | 1153.94 | 936.28 | 33.57 | 112.349 | 33.570 | 河南省南阳市镇平县 |
| 2013 | 1154.22 | 948.52 | 40.59 | 112.219 | 33.584 | 河南省南阳市内乡县 |
| 2015 | 1158.72 | 970.27 | 42.01 | 112.031 | 33.640 | 河南省南阳市内乡县 |
| 2017 | 1168.32 | 997.30 | 45.48 | 111.815 | 33.732 | 河南省南阳市内乡县 |
| 2019 | 1168.81 | 1010.03 | 47.82 | 111.649 | 33.629 | 河南省南阳市西峡县 |
| 2021 | 1165.12 | 1022.38 | 49.95 | 111.477 | 33.635 | 河南省南阳市西峡县 |
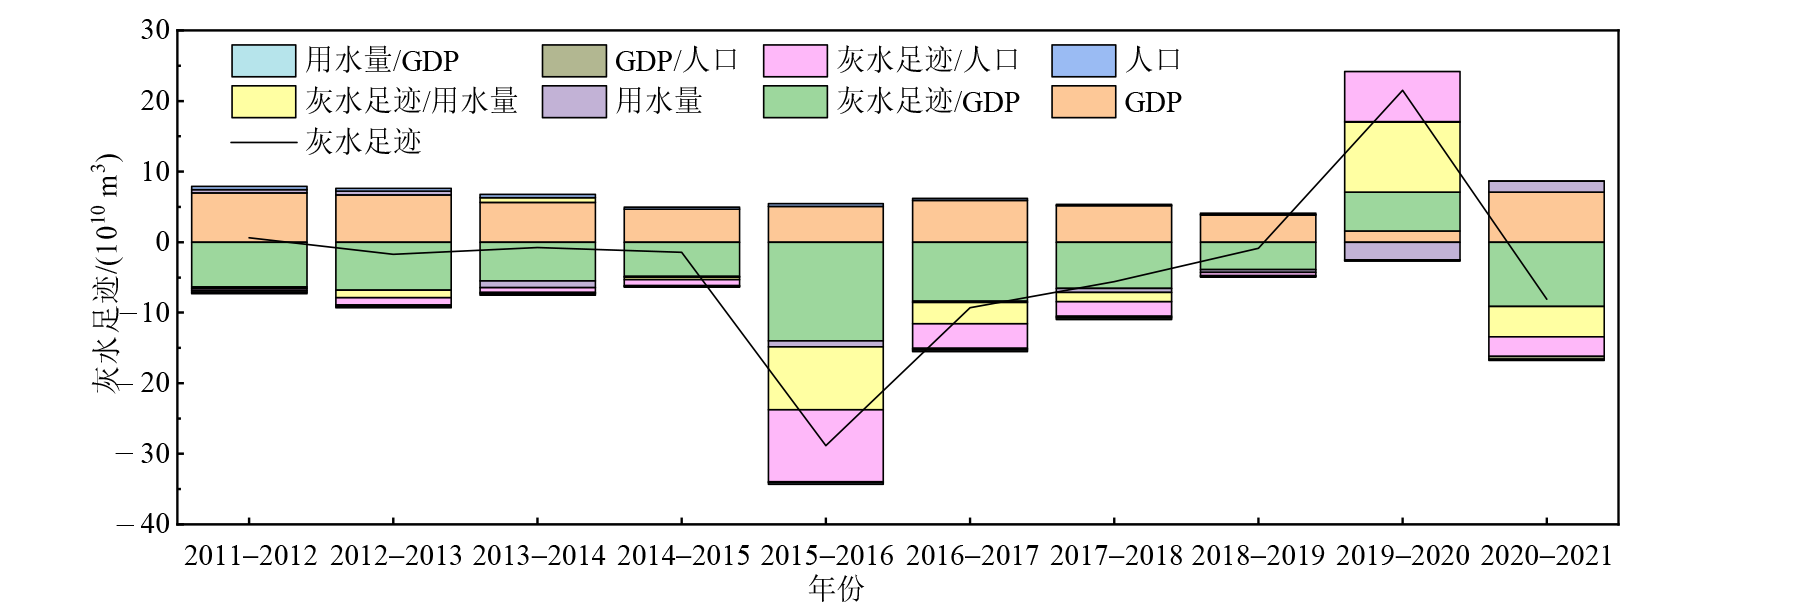
Figure 6 Contribution value of each driving factor of grey water footprint in China from 2011 to 2021
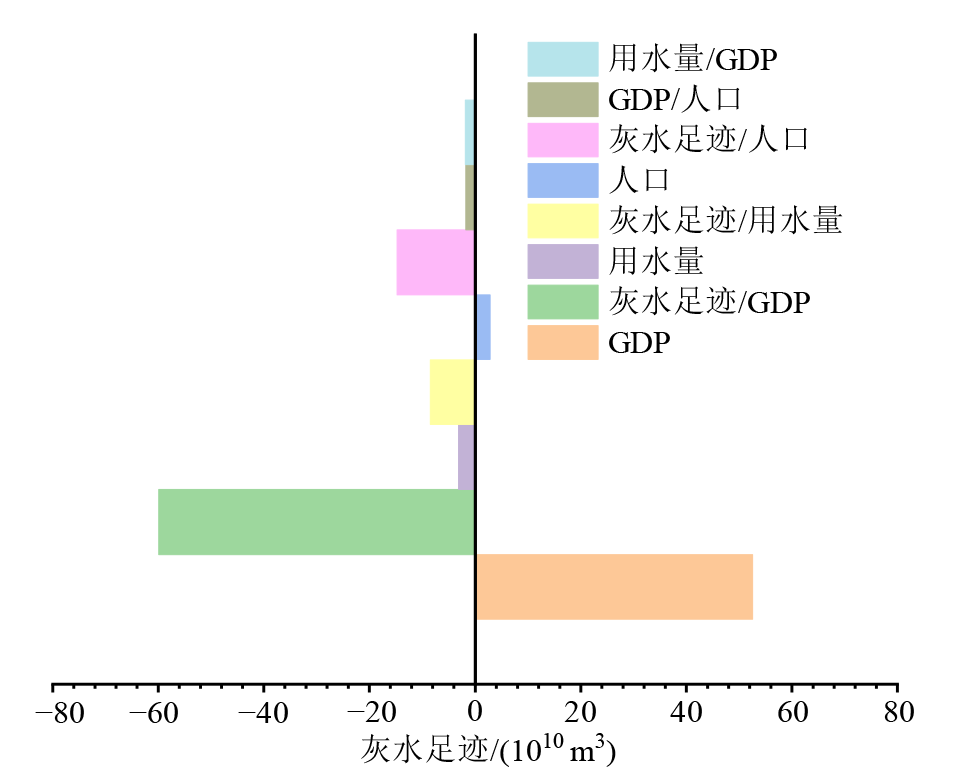
Figure 7 Total contribution value of each driving factor of China’s grey water footprint during 2011-2021
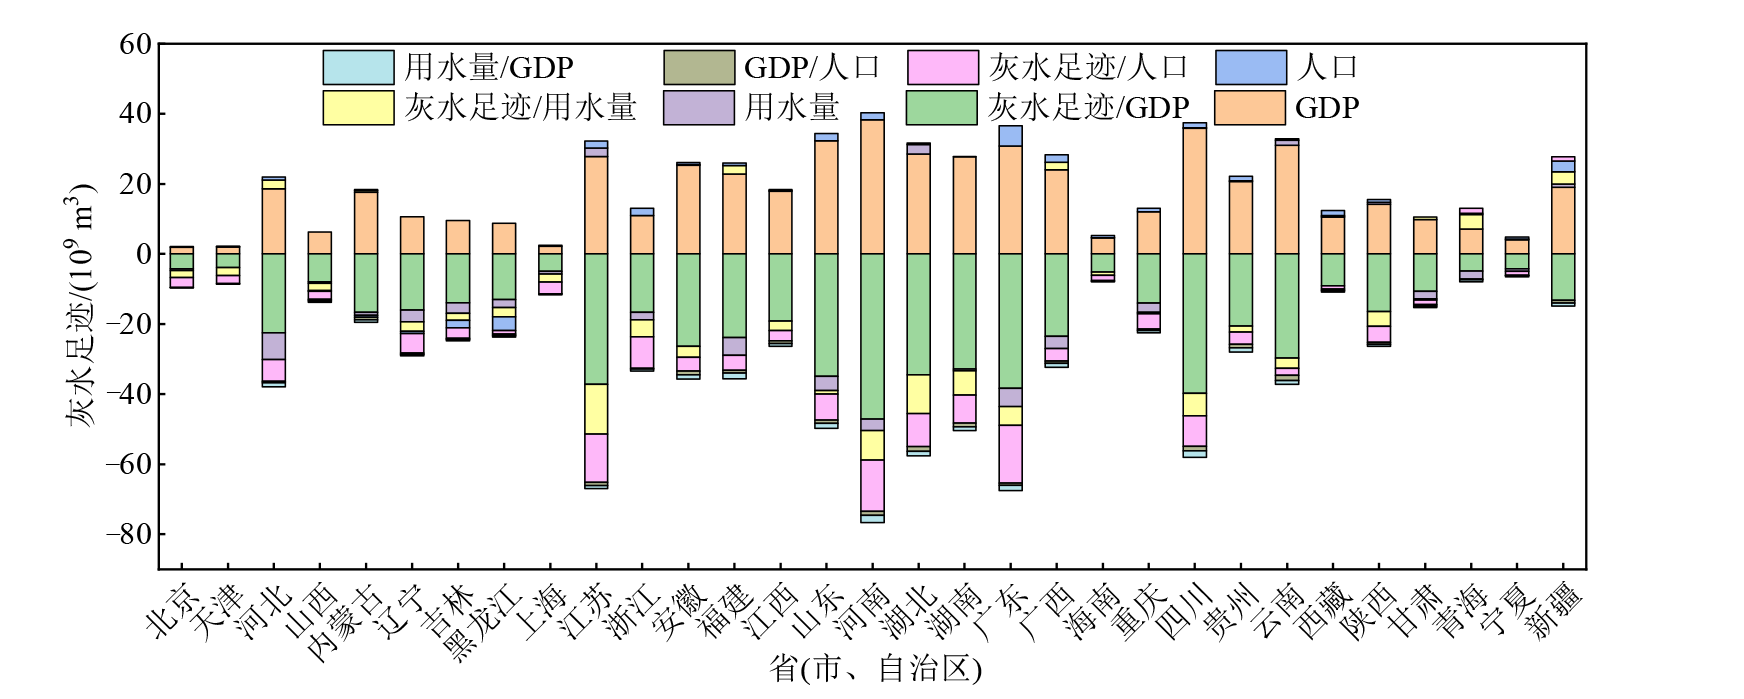
Figure 8 Total contribution value of each driving factor of grey water footprint in China’s provinces (excluding Hong Kong, Macao and Taiwan) during 2011-2021
| 省份 | 灰水足迹 | 农业灰水足迹 | 工业灰水足迹 | 生活灰水足迹 |
|---|---|---|---|---|
| 北京 | 31 | 30 | 30 | 27 |
| 天津 | 29 | 29 | 28 | 28 |
| 河北 | 8 | 5 | 6 | 13 |
| 山西 | 24 | 26 | 22 | 19 |
| 内蒙古 | 12 | 10 | 16 | 23 |
| 辽宁 | 15 | 15 | 14 | 16 |
| 吉林 | 17 | 16 | 23 | 22 |
| 黑龙江 | 13 | 14 | 17 | 14 |
| 上海 | 30 | 31 | 27 | 24 |
| 江苏 | 5 | 8 | 1 | 3 |
| 浙江 | 21 | 25 | 3 | 12 |
| 安徽 | 11 | 12 | 18 | 5 |
| 福建 | 18 | 21 | 15 | 11 |
| 江西 | 16 | 18 | 11 | 10 |
| 山东 | 2 | 2 | 7 | 8 |
| 河南 | 1 | 1 | 8 | 7 |
| 湖北 | 7 | 6 | 13 | 6 |
| 湖南 | 6 | 7 | 9 | 4 |
| 广东 | 4 | 9 | 2 | 1 |
| 广西 | 10 | 11 | 5 | 9 |
| 海南 | 28 | 27 | 29 | 26 |
| 重庆 | 23 | 22 | 25 | 21 |
| 四川 | 3 | 3 | 12 | 2 |
| 贵州 | 19 | 17 | 24 | 17 |
| 云南 | 9 | 4 | 10 | 15 |
| 西藏 | 25 | 23 | 31 | 31 |
| 陕西 | 20 | 19 | 19 | 18 |
| 甘肃 | 22 | 20 | 21 | 25 |
| 青海 | 26 | 24 | 26 | 29 |
| 宁夏 | 27 | 28 | 20 | 30 |
| 新疆 | 14 | 13 | 4 | 20 |
Table 4 The mean ranking of grey water footprint and composition of provinces in China (excluding Hong Kong, Macao and Taiwan) from 2011 to 2021
| 省份 | 灰水足迹 | 农业灰水足迹 | 工业灰水足迹 | 生活灰水足迹 |
|---|---|---|---|---|
| 北京 | 31 | 30 | 30 | 27 |
| 天津 | 29 | 29 | 28 | 28 |
| 河北 | 8 | 5 | 6 | 13 |
| 山西 | 24 | 26 | 22 | 19 |
| 内蒙古 | 12 | 10 | 16 | 23 |
| 辽宁 | 15 | 15 | 14 | 16 |
| 吉林 | 17 | 16 | 23 | 22 |
| 黑龙江 | 13 | 14 | 17 | 14 |
| 上海 | 30 | 31 | 27 | 24 |
| 江苏 | 5 | 8 | 1 | 3 |
| 浙江 | 21 | 25 | 3 | 12 |
| 安徽 | 11 | 12 | 18 | 5 |
| 福建 | 18 | 21 | 15 | 11 |
| 江西 | 16 | 18 | 11 | 10 |
| 山东 | 2 | 2 | 7 | 8 |
| 河南 | 1 | 1 | 8 | 7 |
| 湖北 | 7 | 6 | 13 | 6 |
| 湖南 | 6 | 7 | 9 | 4 |
| 广东 | 4 | 9 | 2 | 1 |
| 广西 | 10 | 11 | 5 | 9 |
| 海南 | 28 | 27 | 29 | 26 |
| 重庆 | 23 | 22 | 25 | 21 |
| 四川 | 3 | 3 | 12 | 2 |
| 贵州 | 19 | 17 | 24 | 17 |
| 云南 | 9 | 4 | 10 | 15 |
| 西藏 | 25 | 23 | 31 | 31 |
| 陕西 | 20 | 19 | 19 | 18 |
| 甘肃 | 22 | 20 | 21 | 25 |
| 青海 | 26 | 24 | 26 | 29 |
| 宁夏 | 27 | 28 | 20 | 30 |
| 新疆 | 14 | 13 | 4 | 20 |
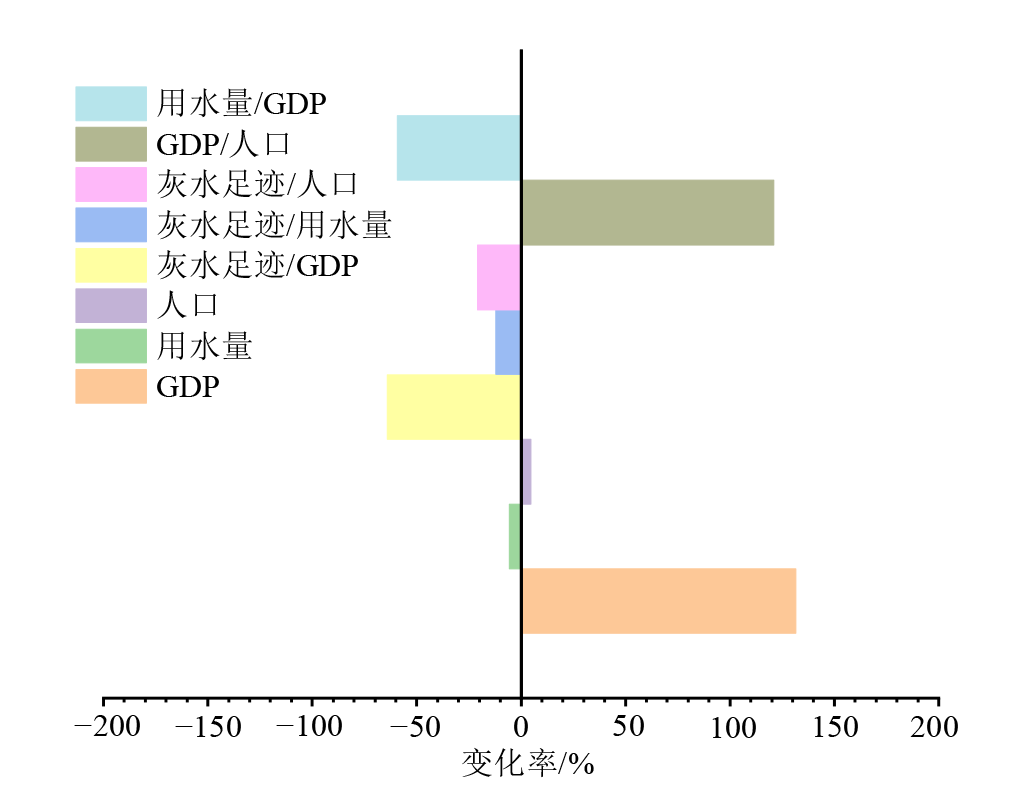
Figure 9 Overall change rate of each driving factor of China’s grey water footprint in 2011-2021
| [1] | CCME, 2001. Canadian water quality guidelines for the protection of aquatic life[R]. Winnipeg: Canadian Council of Ministers of the Environment. |
| [2] | CHEN L M, MA M D, XIANG X W, 2023. Decarbonizing or illusion? How carbon emissions of commercial building operations change worldwide[J]. Sustainable Cities and Society, 96: 104654. |
| [3] | CHEN Q J, WANG Q W, ZHOU D Q, et al., 2023. Drivers and evolution of low-carbon development in China's transportation industry: An integrated analytical approach[J]. Energy, 262(Part B): 125614. |
| [4] | CHENG P, SUN M D, 2022. Calculation of seasonal agricultural grey water footprint in monsoon region based on river reference conditions[J]. Ecological Indicators, 145: 109638. |
| [5] | CHINI C M, LOGAN L H, STILLWELL A S, 2020. Grey water footprints of US thermoelectric power plants from 2010-2016[J]. Advances in Water Resources, 145: 103733. |
| [6] | CHUKALLA A D, KROL M S, HOEKSTRA A Y, 2018. Grey water footprint reduction in irrigated crop production: effect of nitrogen application rate, nitrogen form, tillage practice and irrigation strategy[J]. Hydrology and Earth System Sciences, 22(6): 3245-3259. |
| [7] | CUI S B, DONG H J, WILSON J, 2020. Grey water footprint evaluation and driving force analysis of eight economic regions in China[J]. Environmental Science and Pollution Research, 27(16): 20380-20391. |
| [8] | D'AMBROSIO E, DE GIROLAMO A M, RULLI M C, 2018. Assessing sustainability of agriculture through water footprint analysis and in-stream monitoring activities[J]. Journal of Cleaner Production, 200: 454-470. |
| [9] |
DOLAN F, LAMONTAGNE J, LINK R, et al., 2021. Evaluating the economic impact of water scarcity in a changing world[J]. Nature Communications, 12(1): 1915.
DOI PMID |
| [10] | DUMAN Z, MAO X Q, CAI B F, et al., 2023. Exploring the spatiotemporal pattern evolution of carbon emissions and air pollution in Chinese cities[J]. Journal of Environmental Management, 345: 118870. |
| [11] | FALLAHI A, TAHERIYOUN M, 2023. Developing a sustainable water and wastewater management plan based on water footprint in a part of a steel industry: A case of iron pellet production factory in southeastern Iran[J]. Environment, Development and Sustainability: 1-20. |
| [12] | FENG H Y, SUN F Y, LIU Y Y, et al., 2021. Mapping multiple water pollutants across China using the grey water footprint[J]. Science of The Total Environment, 785: 147255. |
| [13] | FU T B, XU C X, YANG L H, et al., 2022. Measurement and driving factors of grey water footprint efficiency in Yangtze River Basin[J]. Science of the Total Environment, 802: 149587. |
| [14] | HOEKSTRA A Y, CHAPAGAIN A K, 2008. Globalization of water: Sharing the planet’s freshwater resources[M]. Oxford: Blackwell Publishing: 56. |
| [15] | HOEKSTRA A Y, CHAPAGAIN A K, ALDAYA M M, et al., 2011. The water footprint assessment manual: Setting the global standard[M]. London: Earthscan:30-40. |
| [16] | KONG Y, HE W J, YUAN L, et al., 2021. Decoupling economic growth from water consumption in the Yangtze River Economic Belt, China[J]. Ecological Indicators, 123: 107344. |
| [17] | KONG Y, HE W J, ZHANG Z F, et al., 2022. Spatial-temporal variation and driving factors decomposition of agricultural grey water footprint in China[J]. Journal of Environmental Management, 318: 115601. |
| [18] | KUMAR P S, PRASANTH S, HARISH S, et al., 2021. Industrial water footprint: Case study on textile industries[J]. Water Footprint: Assessment and Case Studies: 35-60. |
| [19] | LI W K, WEN H X, NIE P Y, 2023. Prediction of China’s industrial carbon peak: Based on GDIM-MC model and LSTM-NN model[J]. Energy Strategy Reviews, 50(1): 101240. |
| [20] | LIU C H, CAI W, ZHAI M Y, et al., 2021. Decoupling of wastewater eco-environmental damage and China's economic development[J]. Science of The Total Environment, 789(4): 147980. |
| [21] | LIU W F, ANTONELLI M, LIU X C, et al., 2017. Towards improvement of grey water footprint assessment: With an illustration for global maize cultivation[J]. Journal of Cleaner Production, 147: 1-9. |
| [22] | LIU Y, GAN L, CAI W G, et al., 2024. Decomposition and decoupling analysis of carbon emissions in China's construction industry using the generalized Divisia index method[J]. Environmental Impact Assessment Review, 104: 107321. |
| [23] | MARTÍNEZ-ALCALÁ I, PELLICER-MARTÍNEZ F, FERNÁNDEZ-LÓPEZ C, 2018. Pharmaceutical grey water footprint: Accounting, influence of wastewater treatment plants and implications of the reuse[J]. Water Research, 135: 278-287. |
| [24] | MEKONNEN M M, HOEKSTRA A Y, 2015. Global gray water footprint and water pollution levels related to anthropogenic nitrogen loads to fresh water[J]. Environmental Science & Technology, 49(21): 12860-12868. |
| [25] | MEKONNEN M M, HOEKSTRA A Y, 2018. Global anthropogenic phosphorus loads to freshwater and associated grey water footprints and water pollution levels: A high‐resolution global study[J]. Water Resources Research, 54(1): 345-358. |
| [26] | RAO Y C, WANG X L, LI H K, et al., 2024. How can the Pearl River Delta urban agglomeration achieve the carbon peak target: Based on the perspective of an optimal stable economic growth path[J]. Journal of Cleaner Production, 439: 140879. |
| [27] | TAPIO P, 2005. Towards a theory of decoupling: degrees of decoupling in the EU and the case of road traffic in Finland between 1970 and 2001[J]. Transport Policy, 12(2): 137-151. |
| [28] | VANINSKY A, 2014. Factorial decomposition of CO2 emissions: A generalized Divisia index approach[J]. Energy Economics, 45: 389-400. |
| [29] | WANG Z, CHEN S T, CUI C, et al., 2019. Industry relocation or emission relocation? Visualizing and decomposing the dislocation between China's economy and carbon emissions[J]. Journal of Cleaner Production, 208: 1109-1119. |
| [30] | WU Q S, ZUO Q T, MA J X, et al., 2021. Evolution analysis of water consumption and economic growth based on Decomposition-Decoupling Two-stage Method: A case study of Xinjiang Uygur Autonomous Region, China[J]. Sustainable Cities and Society, 75: 103337. |
| [31] | XING H H, XIE Y, LI B M, et al., 2023. Water footprint of animal breeding industry and driving forces at provincial level in China[J]. Water, 15(24): 4264. |
| [32] | XU C X, LIU Y, FU T B, 2022. Spatial-temporal evolution and driving factors of grey water footprint efficiency in the Yangtze River Economic Belt[J]. Science of the Total Environment, 844: 156930. |
| [33] | YOU K R, YU Y H, CAI W G, et al., 2023. The change in temporal trend and spatial distribution of CO2 emissions of China’s public and commercial buildings[J]. Building and Environment, 229: 109956. |
| [34] | ZHANG L, DONG H J, GENG Y, et al., 2019. China’s provincial grey water footprint characteristic and driving forces[J]. Science of The Total Environment, 677: 427-435. |
| [35] | ZHAO X, LIAO X W, CHEN B, et al., 2019. Accounting global grey water footprint from both consumption and production perspectives[J]. Journal of Cleaner Production, 225(Part 2): 963-971. |
| [36] | 白天骄, 孙才志, 2018. 中国人均灰水足迹区域差异及因素分解[J]. 生态学报, 38(17): 6314-6325. |
| BAI T J, SUN C Z, 2018. Regional inequality and factor decomposition of the per capita grey water footprint in China[J]. Acta Ecologica Sinica, 38(17): 6314-6325. | |
| [37] | 程鹏, 李叙勇, 孙明东, 2020. 基于河流参照状态的季风区域季节性农业灰水足迹核算方法与例证[J]. 环境科学学报, 40(9): 3453-3462. |
| CHENG P, LI X Y, SUN M D, 2020. Calculation method and illustration of seasonal agricultural grey water footprint in monsoon region based on river reference conditions[J]. Acta Scientiae Circumstantiae, 40(9): 3453-3462. | |
| [38] | 国家环境保护总局, 2002. 地表水环境质量标准: GB 3838—2002[S]. 北京: 中国环境科学出版社: 2-3. |
| State Environment Protection Agency, 2002. Environmental quality standards for surface water: GB 3838—2002[S]. Beijing: China Environmental Science Press: 2-3. | |
| [39] | 韩传峰, 宋府霖, 滕敏敏, 2022. 长三角地区碳排放时空特征、空间聚类与治理策略[J]. 华东经济管理, 36(5): 24-33. |
| HAN C F, SONG F L, TENG M M, 2022. Temporal and spatial dynamic characteristics, spatial clustering and governance strategies of carbon emissions in the Yangtze River Delta[J]. East China Economic Management, 36(5): 24-33. | |
| [40] | 贺志文, 向平安, 2018. 湖南省灰水足迹变化特征及其驱动因子分析[J]. 中国农村水利水电 (10): 19-26. |
| HE Z W, XIANG P A, 2018. An analysis of the variations and driving factors of grey water footprint in Hunan province[J]. China Rural Water and Hydropower (10): 19-26. | |
| [41] | 李胜楠, 王远, 罗进, 等, 2020. 福建省灰水足迹时空变化及驱动因素[J]. 生态学报, 40(21): 7952-7965. |
| LI S N, WANG Y, LUO J, et al., 2020. Spatio-temporal variations and driving factors of grey water footprint in Fujian Province[J]. Acta Ecologica Sinica, 40(21): 7952-7965. | |
| [42] | 刘俊国, 赵丹丹, 2020. “量-质-生” 三维水资源短缺评价:评述及展望[J]. 科学通报, 65(36): 4251-4261. |
| LIU J G, ZHAO D D, 2020. Three-dimensional water scarcity assessment by considering water quantity, water quality, and environmental flow requirements: Review and prospect[J]. Chinese Science Bulletin, 65(36): 4251-4261. | |
| [43] | 孙才志, 韩琴, 郑德凤, 2016. 中国省际灰水足迹测度及荷载系数的空间关联分析[J]. 生态学报, 36(1): 86-97. |
| SUN C Z, HAN Q, ZHENG D F, 2016. The spatial correlation of the provincial grey water footprint and its loading coefficient in China[J]. Aeta Ecologica Sinica, 36(1): 86-97. | |
| [44] | 孙亚南, 张桂文, 郭玉福, 2019. 城乡二元经济转型中产业结构演变的规律与趋势研究——基于跨期国际比较的视角[J]. 经济问题探索 (1): 177-182. |
| SUN Y N, ZHANG G W, GUO Y F, 2019. Research on the laws and trends of industrial structure evolution in the transformation of urban-rural dual economy: Based on the perspective of cross-period international comparison[J]. Inquiry into Economic Issues (1): 177-182. | |
| [45] | 孙玉环, 2022. 长江经济带灰水足迹时空格局演变与驱动因素研究[J]. 兰州财经大学学报, 38(3): 1-15. |
| SUN Y H, 2022. Research on the spatial and temporal pattern evolution and driving factors of gray water footprint in Yangtze River Economic Belt[J]. Journal of Lanzhou University of Finance and Economics, 38(3): 1-15. | |
| [46] | 尹明财, 朱豪, 胡圆昭, 等, 2023. 甘肃省灰水足迹变化特征及驱动因素[J]. 干旱区研究, 39(6): 1810-1818. |
| YIN M C, ZHU H, HU Y Z, et al., 2023. Analysis of various characteristics and driving factors of gray water footprint in Gansu Province[J]. Arid Zone Research, 39(6): 1810-1818. | |
| [47] | 张俊, 汪辉, 2023. 黄河流域灰水足迹评价及灰水效率驱动因素研究[J]. 太原理工大学学报(社会科学版), 41(2): 86-94. |
| ZHANG J, WANG H, 2023. Grey water footprint evaluation and grey water efficiency driving factors in Yellow river basin[J]. Journal of Taiyuan University of Technology (Social Science Edition), 41(2): 86-94. | |
| [48] | 张藤丽, 焉莉, 韦大明, 2020. 基于全国耕地消纳的畜禽粪便特征分布与环境承载力预警分析[J]. 中国生态农业学报, 28(5): 745-755. |
| ZHANG T L, YAN L, WEI D M, 2020. Characteristic distribution of livestock manure and warning analysis of environmental carrying capacity based on the consumption of cultivated land in China[J]. Chinese Journal of Eco-Agriculture, 28(5): 745-755. | |
| [49] | 张鑫, 李磊, 甄志磊, 等, 2019. 时空与效率视角下汾河流域农业灰水足迹分析[J]. 中国环境科学, 39(4): 1502-1510. |
| ZHANG X, LI L, ZHEN Z L, et al., 2019. Analysis of agricultural grey water footprint in Fenhe River basin based on the perspective of space-time and efficiency[J]. China Environmental Science, 39(4): 1502-1510. | |
| [50] | 张智雄, 孙才志, 2018. 中国人均灰水生态足迹变化驱动效应测度及时空分异[J]. 生态学报, 38(13): 4596-4608. |
| ZHANG Z X, SUN C Z, 2018. Driving effect measurements and spatial-temporal variation of the per capita gray water ecological footprint in China[J]. Acta Ecologica Sinica, 38(13): 4596-4608. | |
| [51] | 朱梅, 吴敬学, 张希三, 2010. 海河流域畜禽养殖污染负荷研究[J]. 农业环境科学学报, 29(8): 1558-1565. |
| ZHU M, WU J X, ZHANG X S, 2010. Pollutants loads of livestock and poultry breeding in Hai Basin, China[J]. Journal of Agro-Environment Science, 29(8): 1558-1565. |
| [1] | LI Xia, CHEN Yonghao, CHEN Zhe, ZHANG Guozhuang, TANG Mengya. Analysis of Spatio-temporal Changes and Driving Vegetation NDVI in Coastal Areas of China [J]. Ecology and Environment, 2024, 33(2): 180-191. |
| [2] | SU Yongsong, SONG Song, CHEN Ye, YE Ziqiang, ZHONG Runfei, WANG Zhaoyao. Temporal and Spatial Characteristics of Net Anthropogenic Nitrogen Input and Its Influencing Factors in the Pearl River Delta [J]. Ecology and Environment, 2022, 31(8): 1599-1609. |
| [3] | LI Menghua, HAN Yingjuan, ZHAO Hui, WANG Yunxia. Analysis on Spatial-temporal Variation Characteristics and Driving Factors of Fractional Vegetation Cover in Ningxia Based on Geographical Detector [J]. Ecology and Environment, 2022, 31(7): 1317-1325. |
| [4] | GAO Siqi, DONG Guotao, JIANG Xiaohui, NIE Tong, GUO Xinwei, DANG Suzhen, LI Xinyu, LI Haoyang. Analysis of Vegetation Coverage Changes and Natural Driving Forces of Spatial Distribution in the Source Region of the Yellow River [J]. Ecology and Environment, 2022, 31(3): 429-439. |
| [5] | NIE Tong, DONG Guotao, JIANG Xiaohui, GUO Xinwei, DANG Suzhen, ZHENG Jiahao, LI Lichan, WANG Jiang. Spatio-temporal Variations and Influencing Factors of Vegetation in Yulin [J]. Ecology and Environment, 2022, 31(1): 26-36. |
| Viewed | ||||||
|
Full text |
|
|||||
|
Abstract |
|
|||||
Copyright © 2021 Editorial Office of ACTA PETROLEI SINICA
Address:No. 6 Liupukang Street, Xicheng District, Beijing, P.R.China, 510650
Tel: 86-010-62067128, 86-010-62067137, 86-010-62067139
Fax: 86-10-62067130
Email: syxb@cnpc.com.cn
Support byBeijing Magtech Co.ltd, E-mail:support@magtech.com.cn