Ecology and Environment ›› 2022, Vol. 31 ›› Issue (8): 1599-1609.DOI: 10.16258/j.cnki.1674-5906.2022.08.012
• Research Articles • Previous Articles Next Articles
SU Yongsong1( ), SONG Song1,2,*(), CHEN Ye3, YE Ziqiang1, ZHONG Runfei1, WANG Zhaoyao1
Received:2021-10-28
Online:2022-08-18
Published:2022-10-10
Contact:
SONG Song
苏泳松1(), 宋松1,2,*(), 陈叶3, 叶子强1, 钟润菲1, 王昭尧1
通讯作者:
宋松
作者简介:苏泳松(1997年生),男,硕士研究生,研究方向为变化环境下的生态环境响应。E-mail: 2111901028@e.gzhu.edu.cn
基金资助:CLC Number:
SU Yongsong, SONG Song, CHEN Ye, YE Ziqiang, ZHONG Runfei, WANG Zhaoyao. Temporal and Spatial Characteristics of Net Anthropogenic Nitrogen Input and Its Influencing Factors in the Pearl River Delta[J]. Ecology and Environment, 2022, 31(8): 1599-1609.
苏泳松, 宋松, 陈叶, 叶子强, 钟润菲, 王昭尧. 珠江三角洲人类活动净氮输入时空特征及其影响因素[J]. 生态环境学报, 2022, 31(8): 1599-1609.
Add to citation manager EndNote|Ris|BibTeX
URL: https://www.jeesci.com/EN/10.16258/j.cnki.1674-5906.2022.08.012

Figure 1 Geographical location of the Pearl River Delta and its land use in 2020 The map of China is drawn according to the standard base map of the Ministry of Natural Resources (review Map No. GS (2016) 1589)
| 输入项 Input item | 计算方法 Method of calculation | 公式说明 Formula description | 计量单位 Unit |
|---|---|---|---|
| 人类活动净氮输入 Net anthropogenic nitrogen input (NNANI) | NNANI=NFe+NH/L+NDe+NNF | NFe——化肥施用氮量; NH/L——食物/饲料输入氮量; NDe——大气氮沉降输入氮量; NNF——作物固氮输入氮量 | kg∙km-2∙a-1 |
| 化肥施用氮 Input nitrogen for fertilizer application (NFe) | NFe=100%×NNf+32.2% (张卫峰等, | NNf——氮肥施用量 (折纯); NCf——复合肥施用量 (折纯) | kg∙km-2∙a-1 |
| 食物/饲料输入氮 Food/feed input nitrogen (NH/L) | NH/L=NHu+NLi-NLiP-NCP 式中: NHu——常住人口数×4.39 (武淑霞, NLi——禽畜养殖存栏量/出栏量×不同禽畜个体摄入饲料氮量; NLiP (NCP)——90% (Van Horn, | NHu——人类摄入食物氮量; NLi——禽畜摄入饲料氮量; NLiP——禽畜产品产氮量; NCP——作物产品产氮量; 当NH/L>0时,为净输入,反之为净输出 | kg∙km-2∙a-1 |
Table 1 Net anthropogenic nitrogen input model
| 输入项 Input item | 计算方法 Method of calculation | 公式说明 Formula description | 计量单位 Unit |
|---|---|---|---|
| 人类活动净氮输入 Net anthropogenic nitrogen input (NNANI) | NNANI=NFe+NH/L+NDe+NNF | NFe——化肥施用氮量; NH/L——食物/饲料输入氮量; NDe——大气氮沉降输入氮量; NNF——作物固氮输入氮量 | kg∙km-2∙a-1 |
| 化肥施用氮 Input nitrogen for fertilizer application (NFe) | NFe=100%×NNf+32.2% (张卫峰等, | NNf——氮肥施用量 (折纯); NCf——复合肥施用量 (折纯) | kg∙km-2∙a-1 |
| 食物/饲料输入氮 Food/feed input nitrogen (NH/L) | NH/L=NHu+NLi-NLiP-NCP 式中: NHu——常住人口数×4.39 (武淑霞, NLi——禽畜养殖存栏量/出栏量×不同禽畜个体摄入饲料氮量; NLiP (NCP)——90% (Van Horn, | NHu——人类摄入食物氮量; NLi——禽畜摄入饲料氮量; NLiP——禽畜产品产氮量; NCP——作物产品产氮量; 当NH/L>0时,为净输入,反之为净输出 | kg∙km-2∙a-1 |
| 养殖禽畜类型 Livestock type | 氮产品消耗量 Nitrogen product consumption/ (kg∙a-1) | 排泄系数 Excretion coefficient/ % | 氮产品消耗总量 Total consumption of nitrogen products/ (kg∙a-1) |
|---|---|---|---|
| 猪 Pig | 11.51 | 69 | 16.68 |
| 牛 Cattle | 48.79 | 89 | 54.82 |
| 羊 Goat | 5.75 | 84 | 6.85 |
| 家禽 Poultry | 0.40 | 68 | 0.59 |
Table 2 Feed nitrogen intake of different livestock
| 养殖禽畜类型 Livestock type | 氮产品消耗量 Nitrogen product consumption/ (kg∙a-1) | 排泄系数 Excretion coefficient/ % | 氮产品消耗总量 Total consumption of nitrogen products/ (kg∙a-1) |
|---|---|---|---|
| 猪 Pig | 11.51 | 69 | 16.68 |
| 牛 Cattle | 48.79 | 89 | 54.82 |
| 羊 Goat | 5.75 | 84 | 6.85 |
| 家禽 Poultry | 0.40 | 68 | 0.59 |
| 禽畜产品类型 Livestock products | 含氮量 Nitrogen content/% | 作物产品类型 Crop | 含氮量 Nitrogen content/% |
|---|---|---|---|
| 猪肉 Pork | 2.13 | 大豆 Soybean | 5.52 |
| 牛肉 Beef | 2.89 | 甘蔗 sugarcane | 0.06 |
| 羊肉 Mutton | 3.01 | 柑桔橙 Orange | 0.17 |
| 家禽肉 Domestic poultry meat | 2.78 | 花生 Peanut | 1.93 |
| 禽蛋类 Poultry and eggs | 1.98 | 荔枝 Litchi chinensis | 0.14 |
| 奶类 Dairy | 0.49 | 薯类 Tubers | 0.20 |
| 水产品 Aquatic product | 2.65 | 蔬菜 Vegetables | 0.35 |
| 水稻 Rice | 1.19 | ||
| 香蕉 Banana | 0.22 |
Table 3 Nitrogen content of different livestock products and crop products
| 禽畜产品类型 Livestock products | 含氮量 Nitrogen content/% | 作物产品类型 Crop | 含氮量 Nitrogen content/% |
|---|---|---|---|
| 猪肉 Pork | 2.13 | 大豆 Soybean | 5.52 |
| 牛肉 Beef | 2.89 | 甘蔗 sugarcane | 0.06 |
| 羊肉 Mutton | 3.01 | 柑桔橙 Orange | 0.17 |
| 家禽肉 Domestic poultry meat | 2.78 | 花生 Peanut | 1.93 |
| 禽蛋类 Poultry and eggs | 1.98 | 荔枝 Litchi chinensis | 0.14 |
| 奶类 Dairy | 0.49 | 薯类 Tubers | 0.20 |
| 水产品 Aquatic product | 2.65 | 蔬菜 Vegetables | 0.35 |
| 水稻 Rice | 1.19 | ||
| 香蕉 Banana | 0.22 |
| 作物类型 Crop | 固氮系数 Nitrogen fixation coefficient/(kg∙km-2∙a-1) |
|---|---|
| 大豆 Soybean | 9600 |
| 花生 Peanut | 8000 |
| 水稻 Rice | 3000 |
| 薯类 Tubers | 1500 |
Table 4 Nitrogen fixation coefficient of different crops
| 作物类型 Crop | 固氮系数 Nitrogen fixation coefficient/(kg∙km-2∙a-1) |
|---|---|
| 大豆 Soybean | 9600 |
| 花生 Peanut | 8000 |
| 水稻 Rice | 3000 |
| 薯类 Tubers | 1500 |
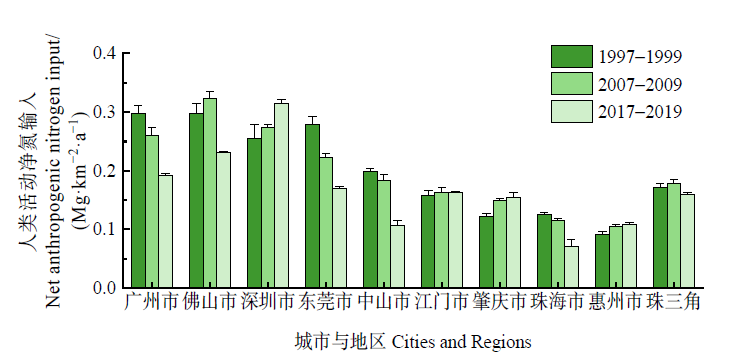
Figure 2 Temporal changes of net anthropogenic nitrogen input in recent 20 years n=3
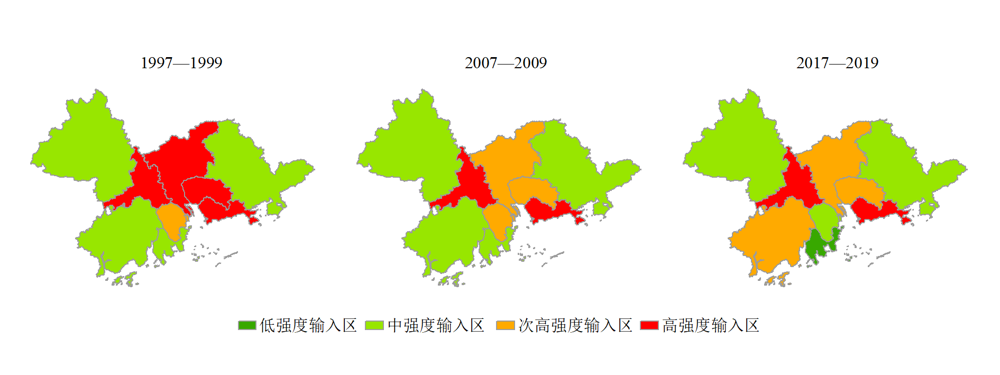
Figure 3 Spatial distribution of net anthropogenic nitrogen input in recent 20 years
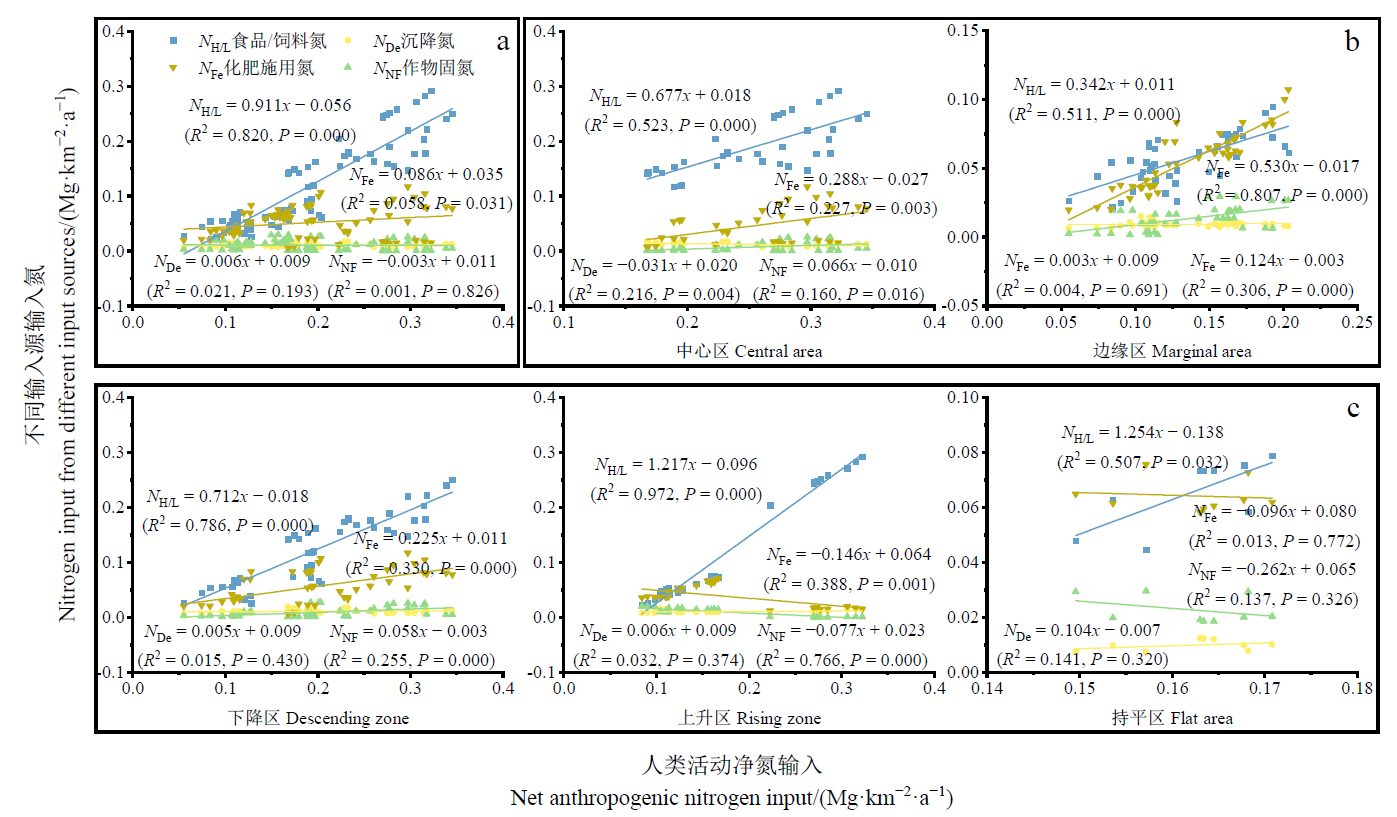
Figure 4 Relationship between different input sources and net anthropogenic nitrogen input in the Pearl River Delta Central area (Guangzhou, Foshan, Dongguan, Shenzhen), Marginal area (Zhaoqing, Jiangmen, Zhongshan, Zhuhai, Huizhou)
| 城市 City | 人均NANI Per capita net anthropogenic nitrogen input/(kg∙person-1∙a-1) | 人口密度 Population density/ (person∙km-2) | |||||
|---|---|---|---|---|---|---|---|
| 1997-1999 | 2007-2009 | 2017-2019 | 1997-1999 | 2007-2009 | 2017-2019 | ||
| 广州Guangzhou | 23.77 | 15.59 | 9.38 | 1254.64 | 1542.83 | 2055.78 | |
| 深圳Shenzhen | 8.79 | 5.81 | 4.87 | 2904.74 | 4775.47 | 6466.43 | |
| 珠海Zhuhai | 20.08 | 12.64 | 6.57 | 624.87 | 869.09 | 1090.38 | |
| 佛山Foshan | 23.57 | 19.25 | 11.11 | 1263.06 | 1733.13 | 2082.04 | |
| 惠州Huizhou | 34.24 | 29.64 | 25.49 | 265.44 | 369.13 | 425.56 | |
| 东莞Dongguan | 13.77 | 6.17 | 4.98 | 2031.55 | 3053.69 | 3414.41 | |
| 中山Zhongshan | 17.10 | 11.66 | 5.76 | 1168.00 | 1583.18 | 1859.46 | |
| 江门Jiangmen | 39.05 | 36.36 | 33.84 | 405.36 | 451.05 | 483.51 | |
| 肇庆Zhaoqing | 54.19 | 63.14 | 55.58 | 224.07 | 255.79 | 278.78 | |
Table 5 Per capita net anthropogenic nitrogen input and population density in the Pearl River Delta in recent 20 years
| 城市 City | 人均NANI Per capita net anthropogenic nitrogen input/(kg∙person-1∙a-1) | 人口密度 Population density/ (person∙km-2) | |||||
|---|---|---|---|---|---|---|---|
| 1997-1999 | 2007-2009 | 2017-2019 | 1997-1999 | 2007-2009 | 2017-2019 | ||
| 广州Guangzhou | 23.77 | 15.59 | 9.38 | 1254.64 | 1542.83 | 2055.78 | |
| 深圳Shenzhen | 8.79 | 5.81 | 4.87 | 2904.74 | 4775.47 | 6466.43 | |
| 珠海Zhuhai | 20.08 | 12.64 | 6.57 | 624.87 | 869.09 | 1090.38 | |
| 佛山Foshan | 23.57 | 19.25 | 11.11 | 1263.06 | 1733.13 | 2082.04 | |
| 惠州Huizhou | 34.24 | 29.64 | 25.49 | 265.44 | 369.13 | 425.56 | |
| 东莞Dongguan | 13.77 | 6.17 | 4.98 | 2031.55 | 3053.69 | 3414.41 | |
| 中山Zhongshan | 17.10 | 11.66 | 5.76 | 1168.00 | 1583.18 | 1859.46 | |
| 江门Jiangmen | 39.05 | 36.36 | 33.84 | 405.36 | 451.05 | 483.51 | |
| 肇庆Zhaoqing | 54.19 | 63.14 | 55.58 | 224.07 | 255.79 | 278.78 | |
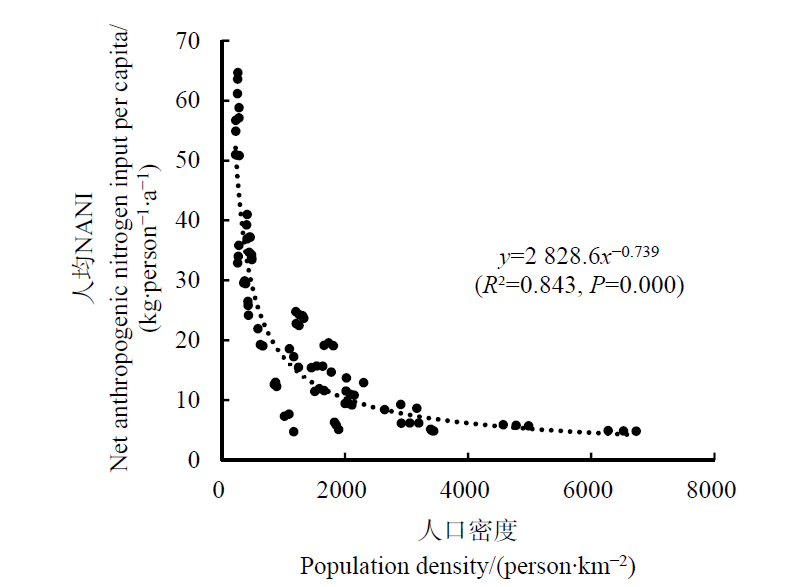
Figure 5 Relationship between population density and per capita net anthropogenic nitrogen input
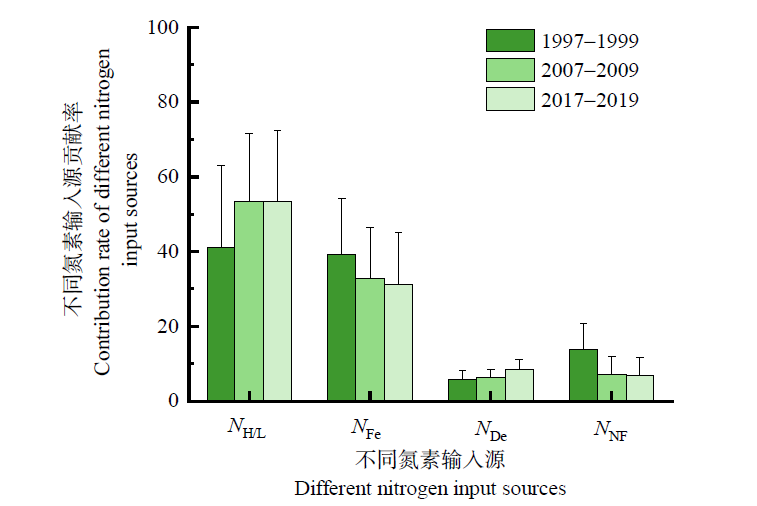
Figure 6 Different input sources and its contribution rates in the Pearl River Delta n=9
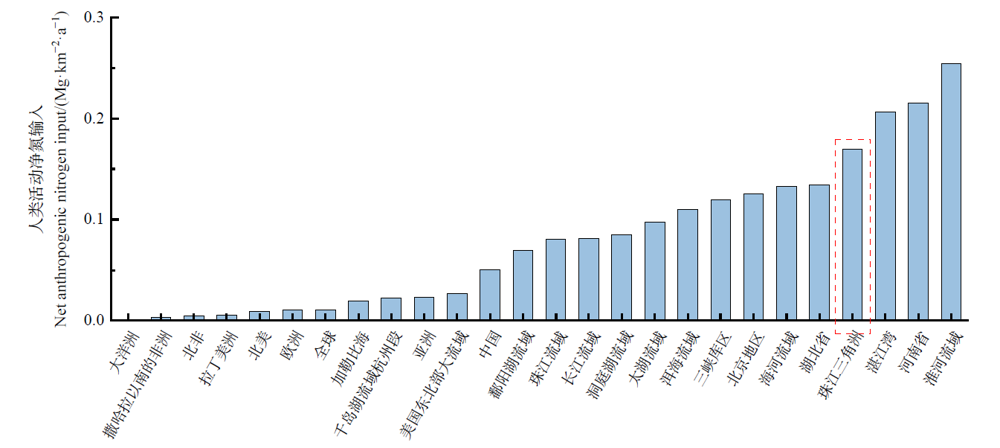
Figure 7 Comparison of net anthropogenic nitrogen input between Pearl River Delta and other regions Oceania, Sub Saharan Africa, North Africa, Latin America, North America, Europe, Global, Caribbean, Asia (1990-2009) (Han et al., 2020); Hangzhou section of Qiandao Lake Basin (Miu et al., 2021); Northeastern United States (Howarth et al., 2006); China (2009) (Han et al., 2014); Poyang Lake Basin (Gao et al., 2016); Pearl River Basin (2015) (Cui et al., 2020); Yangtze River Basin (2012) (Chen et al., 2016); Dongting Lake Basin (Liu et al., 2019); Taihu Lake Basin (2010) (Lian et al., 2018); Erhai Basin (2014) (Li et al., 2018); Three Gorges Reservoir Area (2016) (Ding et al., 2020); Beijing (2007) (Han et al., 2011); Haihe River Basin (Chen et al., 2016); Hubei province (2018) (Xv et al., 2021); Pearl River Delta (1997-2019) (Current Study); Zhanjiang Bay Area (2018) (Zhou et al., 2021); Henan province (Pei et al., 2021); Huaihe River Basin (Zhang et al., 2015)
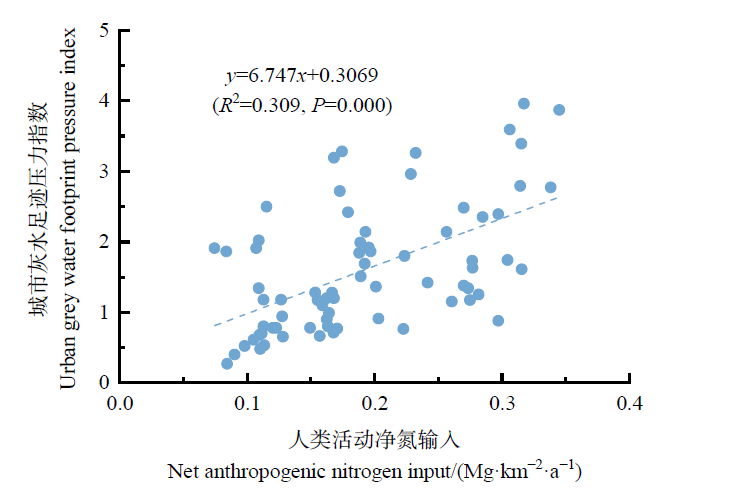
Figure 8 Relationship between net anthropogenic nitrogen input and urban grey water footprint pressure index in various cities
| 类别 Category | 影响因子 Impact factors | 单位 Unit | q值 q value | q值排序 q-value sorting | |
|---|---|---|---|---|---|
| 社会经济因素 Socio-economic Factors | X1 | 人口密度 | person∙km-2 | 0.408** | 2 |
| X2 | 粮食作物产量 | t∙km-2 | 0.222* | 6 | |
| X3 | 单位农业产值 | 108 yuan∙km-2 | 0.029 | 10 | |
| X4 | 化肥施用强度 | t∙km-2 | 0.364** | 3 | |
| X5 | 水果产量 | t∙km-2 | 0.079 | 9 | |
| X6 | 城镇化率 | % | 0.356** | 4 | |
| 土地利用因素 Land use factors | X7 | 耕地面积占比 | % | 0.116 | 8 |
| X8 | 林地面积占比 | % | 0.484** | 1 | |
| X9 | 草地面积占比 | % | 0.281** | 5 | |
| X10 | 居民、工矿、城市用地面积占比 | % | 0.208* | 7 | |
Table 6 Selection of net anthropogenic nitrogen input impact factors and factor detection results
| 类别 Category | 影响因子 Impact factors | 单位 Unit | q值 q value | q值排序 q-value sorting | |
|---|---|---|---|---|---|
| 社会经济因素 Socio-economic Factors | X1 | 人口密度 | person∙km-2 | 0.408** | 2 |
| X2 | 粮食作物产量 | t∙km-2 | 0.222* | 6 | |
| X3 | 单位农业产值 | 108 yuan∙km-2 | 0.029 | 10 | |
| X4 | 化肥施用强度 | t∙km-2 | 0.364** | 3 | |
| X5 | 水果产量 | t∙km-2 | 0.079 | 9 | |
| X6 | 城镇化率 | % | 0.356** | 4 | |
| 土地利用因素 Land use factors | X7 | 耕地面积占比 | % | 0.116 | 8 |
| X8 | 林地面积占比 | % | 0.484** | 1 | |
| X9 | 草地面积占比 | % | 0.281** | 5 | |
| X10 | 居民、工矿、城市用地面积占比 | % | 0.208* | 7 | |
| [1] |
CHEN F, HOU L J, LIU M, et al., 2016. Net anthropogenic nitrogen inputs (NANI) into the Yangtze River basin and the relationship with riverine nitrogen export: NANI in the Yangtze River Basin[J]. Journal of Geophysical Research: Biogeosciences, 121(2): 451-465.
DOI URL |
| [2] | CUI X, HUANG C Z, WU J P, et al., 2020. Temporal and spatial variations of net anthropogenic nitrogen inputs (NANI) in the Pearl River Basin of China from 1986 to 2015 [J]. PLOS ONE, 15(2): 1-14. |
| [3] |
GROFFMAN P M, GOLD A J, ADDY K, 2000. Nitrous oxide production in riparian zones and its importance to national emission Inventories[J]. Chemosphere-Global Change Science, 2(3-4): 291-299.
DOI URL |
| [4] |
GU B J, LEACH A M, MA L, et al., 2013. Nitrogen footprint in China: Food, energy, and nonfood goods[J]. Environmental Science & Technology, 47(16): 9217-9224.
DOI URL |
| [5] |
HAN Y, FAN Y, YANG P, et al., 2014. Net anthropogenic nitrogen inputs (NANI) index application in Mainland China[J]. Geoderma, 213: 87-94.
DOI URL |
| [6] |
HAN Y G, FENG G, SWANEY D P, et al., 2020. Global and regional estimation of net anthropogenic nitrogen inputs (NANI)[J]. Geoderma, DOI: 10.1016/j.geoderma.2019.114066.
DOI |
| [7] |
HONG B, SWANEY D P, MÖRTH C-M, et al., 2012. Evaluating regional variation of net anthropogenic nitrogen and phosphorus inputs (NANI/NAPI), major drivers, nutrient retention pattern and management implications in the multinational areas of Baltic Sea Basin[J]. Ecological Modelling, 227: 117-135.
DOI URL |
| [8] |
HOWARTH R W, SWANEY D P, BOYER E W, et al., 2006. The influence of climate on average nitrogen export from large watersheds in the Northeastern United States[J]. Biogeochemistry, 79(1-2): 163-186.
DOI URL |
| [9] | HOWARTH R W., BILLEN G, SWANEY D, et al., 1996. Nitrogen cycling in the North Atlantic Ocean and its watersheds[M]. Dordrecht: Kluwer Academic Publishers: 75-139. |
| [10] |
HOWARTH R, SWANEY D, BILLEN G, et al., 2012. Nitrogen fluxes from the landscape are controlled by net anthropogenic nitrogen inputs and by Climate[J]. Frontiers in Ecology and the Environment, 10(1): 37-43.
DOI URL |
| [11] |
JORDAN T E, WELLER D E, 1996. Human contributions to terrestrial nitrogen flux[J]. BioScience, 46(9): 655-664.
DOI URL |
| [12] |
LEACH A M, GALLOWAY J N, BLEEKER A, et al., 2012. A nitrogen footprint model to help consumers understand their role in nitrogen losses to the environment[J]. Environmental Development, 1(1): 40-66.
DOI URL |
| [13] |
LIAN H S, LEI Q L, ZHANG X Y, et al., 2018. Effects of anthropogenic activities on long-term changes of nitrogen budget in a plain river network region: A case study in the Taihu Basin[J]. Science of The Total Environment, 645: 1212-1220.
DOI URL |
| [14] |
SWANEY D P, HONG B, TI C, et al., 2012. Net anthropogenic nitrogen inputs to watersheds and riverine N export to coastal waters: A brief overview[J]. Current Opinion in Environmental Sustainability, 4(2): 203-211.
DOI URL |
| [15] | VAN HORN H H, 1998. Factors affecting manure quantity, quality, and use[C]// Texas Animal Nutrition Council. Proceedings of the Mid-South Ruminant Nutrition Conference. Dallas-Ft: Texas Animal Nutrition Council publication: 9-19. |
| [16] |
WEDIN D A, TILMAN D, 1996. Influence of nitrogen loading and species composition on the carbon balance of grasslands[J]. Science, 274(5293): 1720-1723.
PMID |
| [17] |
XV H L, XING W M, YANG P L, et al., 2021. Regional estimation of net anthropogenic nitrogen inputs (NANI) and the relationships with socioeconomic factors[J]. Environmental Science and Pollution Research, 28(9): 11170-11182.
DOI URL |
| [18] |
YU C Q, HUANG X, CHEN H, et al., 2019. Managing nitrogen to restore water quality in China[J]. Nature, 567(7749): 516-520.
DOI URL |
| [19] |
ZHANG W S, LI X Y, SWANEY D P, et al., 2016. Does food demand and rapid urbanization growth accelerate regional nitrogen Inputs?[J]. Journal of Cleaner Production, 112: 1401-1409.
DOI URL |
| [20] |
ZHOU X, CHEN C Q, CHEN F J, et al., 2021. Changes in net anthropogenic nitrogen input in the watershed region of Zhanjiang Bay in south China from 1978 to 2018 [J]. Environment, Development and Sustainability, 23(6): 17201-17219.
DOI URL |
| [21] | 陈飞, 2016. 长江流域人类活动净氮输入及其生态环境效应浅析[D]. 上海: 华东师范大学: 14-17. |
| CHEN F, 2016. Net anthropogenic nitrogen inputs (NANI) into the Yangtze River basin and analyses on eco-environmental impacts[D]. Shanghai: East China Normal University: 14-17. | |
| [22] | 陈松林, 王天星, 2009. 等间距法和均值标准差法界定城市热岛的对比研究[J]. 地球信息科学学报, 11(2): 145-150. |
|
CHEN S L, WANG T X, 2009. Comparison analyses of equal interval method and mean-standard deviation method used to delimitate urban heat island[J]. Journal of Geo-Information Science, 11(2): 145-150.
DOI URL |
|
| [23] | 陈岩, 高伟, 王东, 等, 2016. 缺水地区人类活动净氮输入与河流响应特征--以海河流域为例[J]. 环境科学学报, 36(10): 3600-3606. |
| CHEN Y, GAO W, WANG D, et al., 2016. Net anthropogenic nitrogen inputs (NANI) and riverine response in water shortage region: A case study of Haihe River watershed[J]. Acta Scientiae Circumstantiae, 36(10): 3600-3606. | |
| [24] | 丁雪坤, 王云琦, 韩玉国, 等, 2020. 三峡库区人类活动净氮输入量估算及其影响因素[J]. 中国环境科学, 40(1): 206-216. |
| DING X K, WANG Y Q, HAN Y G, et al., 2020. Evaluating of net anthropogenic nitrogen inputs and its influencing factors in the Three Gorges Reservoir Area[J]. China Environmental Science, 40(1): 206-216. | |
| [25] | 高伟, 白辉, 严长安, 等, 2019. 1952-2016年长江经济带天然与人为氮输入时空演变趋势[J]. 环境科学学报, 39(9): 3134-3143. |
| GAO W, BAI H, YAN C A, et al., 2019. Spatiotemporal evolution of natural and anthropogenic nitrogen inputs to Yangtze River Economic Belt from 1952 to 2016 [J]. Acta Scientiae Circumstantiae, 39(9): 3134-3143. | |
| [26] | 高伟, 高波, 严长安, 等, 2016. 鄱阳湖流域人为氮磷输入演变及湖泊水环境响应[J]. 环境科学学报, 36(9): 3137-3145. |
| GAO W, GAO B, YAN C A, et al., 2016. Evolution of anthropogenic nitrogen and phosphorus inputs to Lake Poyang Basin and its’ effect on water quality of lake[J]. Acta Scientiae Circumstantiae, 36(9): 3137-3145. | |
| [27] | 高伟, 郭怀成, 后希康, 2014. 中国大陆市域人类活动净氮输入量 (NANI) 评估[J]. 北京大学学报(自然科学版), 50(5): 951-959. |
| GAO W, GUO H C, HOU X K, 2014. Evaluating city-scale net anthropogenic nitrogen input (NANI) in Mainland China[J]. Acta Scientiarum Naturalium Universitatis Pekinensis, 50(5): 951-959. | |
| [28] |
郭群, 2019. 氮添加对内蒙古温带典型草原土壤的酸化效应及水分的影响[J]. 应用生态学报, 30(10): 3285-3291.
DOI |
|
GUO Q, 2019. Soil acidification induced by nitrogen addition and its responses to water addition in Inner Mongolia temperate steppe, China[J]. Chinese Journal of Applied Ecology, 30(10): 3285-3291.
DOI |
|
| [29] | 韩玉国, 李叙勇, 南哲, 等, 2011. 北京地区2003-2007年人类活动氮累积状况研究[J]. 环境科学, 32(6): 1537-1545. |
| HAN Y G, LI X Y, NAN Z, et al., 2011. Net anthropogenic nitrogen accumulation in the Beijing metropolitan region in 2003 to 2007 [J]. Environmental Science, 32(6): 1537-1545. | |
| [30] | 贾彦龙, 王秋凤, 朱剑兴, 等, 2019. 1996-2015年中国大气无机氮湿沉降时空格局数据集[J]. 中国科学数据(中英文网络版), 4(1): 8-17. |
| JIA Y L, WANG Q F, ZHU J X, et al., 2019. A spatial and temporal dataset of atmospheric inorganic nitrogen wet deposition in China (1996-2015)[J]. China Scientific Data, 4(1): 8-17. | |
| [31] | 李丽, 吕颂辉, 2009. 近30年广东沿海赤潮灾害的特征及成因分析[J]. 安全与环境学报, 9(3): 83-86. |
| LI L, LÜ S H, 2009. A 30-year retrospective analysis over the detrimental algal blooms in Guangdong coastal areas[J]. Journal of Safety and Environment, 9(3): 83-86. | |
| [32] | 李晓虹, 刘宏斌, 雷秋良, 等, 2019. 人类活动净氮输入时空变化特征及其影响因素--以香溪河流域为例[J]. 中国环境科学, 39(2): 366-371. |
| LI X H, LIU H B, LEI Q L, et al., 2019. Spatio-temporal characteristics and influential factors of net anthropogenic nitrogen input: A case study of Xiangxi river watershed[J]. China Environmental Science, 39(2): 366-371. | |
| [33] | 李影, 刘宏斌, 雷秋良, 等, 2018. 洱海流域乡镇尺度上人类活动对净氮输入量的影响[J]. 环境科学, 39(9): 4189-4198. |
|
LI Y, LIU H B, LEI Q L, et al., 2018. Impact of human activities on net anthropogenic nitrogen inputs (NANI) at township scale in Erhai Lake basin[J]. Environmental Science, 39(9): 4189-4198.
DOI URL |
|
| [34] | 李允洁, 2017. 杭州市灰水足迹研究[D]. 金华: 浙江师范大学: 18-26. |
| LI Y J, 2017. Study on the Grey Water Footprint of Hangzhou[D]. Jinhua: Zhejiang Normal University: 18-26. | |
| [35] | 刘爱萍, 李来胜, 任秀文, 等, 2013. 珠三角地区大气氮磷干湿沉降通量及其组成特征[C]// 中国环境科学学会. 中国环境科学学会学术年会论文集(第五卷). 昆明: 2013中国环境科学学会学术年会: 4649-4655. |
| LIU A P, LI L S, REN X W, et al., 2013. Atmospheric nitrogen and phosphorus dry and wet deposition flux and its composition in the Pearl River Delta[C]// Chinese Society for Environmental Sciences. Proceedings of the annual academic meeting of the Chinese Society for Environmental Sciences (Volume V). Kunming: 2013 academic annual meeting of Chinese Society for Environmental Sciences: 4649-4655. | |
| [36] | 刘艳萍, 2019. 洞庭湖流域人类活动净氮/磷输入(NANI/NAPI)时空分布评估[D]. 北京: 北京林业大学: 20-33. |
| LIU Y P, 2019. Spatio-temporal variations of the net anthropogenic nitrogen and phosphorus inputs (NANI/NAPI) into the Dongting Lake basin[D]. Beijing: Beijing Forestry University: 20-33. | |
| [37] | 缪今典, 张晓明, 魏天兴, 等, 2021. 千岛湖流域杭州段人类活动净氮、净磷输入时空分布[J]. 中国环境科学, 41(6): 2831-2842. |
| MIU J D, ZHANG X M, WEI T X, et al., 2021. Temporal and spatial distribution characteristics of net nitrogen and phosphorus input from human activity: A case study of Hangzhou section of Qiandao Lake Basin[J]. China Environmental Science, 41(6): 2831-2842. | |
| [38] | 裴玮, 杜新忠, 雷秋良, 等, 2021. 县级尺度人类活动净氮输入量时空变化特征与参数影响研究--以河南省为例[J/OL]. 中国环境科学, [2021-10-08]. https://doi.org/10.19674/j.cnki.issn1000-6923.20210517.003. |
| PEI W, DU X Z, LEI Q L, et al., 2021. Spatiotemporal variation of net anthropogenic nitrogen input at county level and the impacts from parameters: A case study of Henan Province[J/OL]. China Environmental Science, [2021-10-08]. https://doi.org/10.19674/j.cnki.issn1000-6923.20210517.003. | |
| [39] | 孙才志, 韩琴, 郑德凤, 2016. 中国省际灰水足迹测度及荷载系数的空间关联分析[J]. 生态学报, 36(1): 86-97. |
| SUN C Z, HAN Q, ZHENG D F, 2016. The spatial correlation of the provincial grey water footprint and its loading coefficient in China[J]. Acta Ecologica Sinica, 36(1): 86-97. | |
| [40] | 苏瑀, 张小飞, 谢苗苗, 等, 2019. 基于人类活动氮输入探讨深圳市的城市生态风险 (2000-2014年)[J]. 北京大学学报: 自然科学版, 55(5): 925-933. |
| SU Y, ZHANG X F, XIE M M, et al., 2019. Urban ecological risk analysis based on anthropogenic nitrogen inputs in Shenzhen (2000-2014)[J]. Acta Scientiarum Naturalium Universitatis Pekinensis, 55(5): 925-933. | |
| [41] |
王劲峰, 徐成东, 2017. 地理探测器: 原理与展望[J]. 地理学报, 72(1): 116-134.
DOI |
|
WANG J F, XU C D, 2017. Geodetector: Principle and prospective[J]. Acta Geographica Sinica, 72(1): 116-134.
DOI |
|
| [42] | 王敬国, 林杉, 李保国, 2016. 氮循环与中国农业氮管理[J]. 中国农业科学, 49(3): 503-517. |
| WANG J G, LIN B, LI B G, 2016. Nitrogen cycling and management strategies in Chinese agriculture[J]. Scientia Agricultura Sinica, 49(3): 503-517. | |
| [43] | 吴雅丽, 许海, 杨桂军, 等, 2014. 太湖水体氮素污染状况研究进展[J]. 湖泊科学, 26(1): 19-28. |
|
WU Y L, XU H, YANG G J, et al., 2014. Progress in nitrogen pollution research in Lake Taihu[J]. Journal of Lake Sciences, 26(1): 19-28.
DOI URL |
|
| [44] | 武淑霞, 2005. 我国农村畜禽养殖业氮磷排放变化特征及其对农业面源污染的影响[D]. 北京: 中国农业科学院: 27-31. |
| WU S X, 2005. The spatial and temporal change of nitrogen and phosphorus produced by livestock and poultry & their effects on agricultural non-point pollution in China[D]. Beijing: Chinese Academy of Agricultural Sciences: 27-31. | |
| [45] | 冼超凡, 潘雪莲, 甄泉, 等, 2019. 城市生态系统污染氮足迹与灰水足迹综合评价[J]. 环境科学学报, 39(3): 985-995. |
| XIAN C F, PAN X L, ZHEN Q, et al., 2019. Integrated assessments of nitrogen pollution footprints and grey water footprints in the urban ecosystem[J]. Acta Scientiae Circumstantiae, 39(3): 985-995. | |
| [46] | 徐浩林, 杨培岭, 邢伟民, 等, 2020. 湖北省2008-2017年人类活动净氮输入状况[J]. 中国环境科学, 40(9): 4017-4028. |
| XU H L, YANG P L, XING W M, et al., 2020. Net anthropogenic nitrogen accumulation in Hubei province from 2008 to 2017 [J]. China Environmental Science, 40(9): 4017-4028. | |
| [47] | 杨新洪, 赵云城, 2020. 广东省统计年鉴[M]. 北京: 中国统计出版社:111-231. |
| YANG X H, ZHAO Y C, 2020. Guangdong Statistical Yearbook[M]. Beijing: China Statistics Press: 111-231. | |
| [48] | 杨月欣, 2018. 中国食物成分表标准版 (第一册)[M]. 第6版. 北京: 北京大学医学出版社: 95-113. |
| YANG Y X, 2018. China Food Composition Tables Standard Edition (Volume I)[M]. Sixth Edition. Beijing: Peking University Medical Press: 95-113. | |
| [49] | 张卫峰, 李亮科, 陈新平, 等, 2009. 我国复合肥发展现状及存在的问题[J]. 磷肥与复肥, 24(2): 14-16. |
| ZHANG W F, LI L K, CHEN X P, et al., 2009. The present status and existing problems in China’s compound fertilizer development[J]. Phosphate & Compound Fertilizer, 24(2): 14-16. | |
| [50] | 张汪寿, 李叙勇, 杜新忠, 等, 2014a. 流域人类活动净氮输入量的估算、不确定性及影响因素[J]. 生态学报, 34(24): 7454-7464. |
| ZHANG W S, LI X Y, DU X Z, et al., 2014a. Accounting methods,uncertainties and influential factors of net anthropogenic nitrogen input (NANI)[J]. Acta Ecologica Sinica, 34(24): 7454-7464. | |
| [51] | 张汪寿, 李叙勇, 苏静君, 2014b. 河流氮输出对流域人类活动净氮输入的响应研究综述[J]. 应用生态学报, 25(1): 272-278. |
| ZHANG W S, LI X Y, SU J J, et al., 2014b. Responses of riverine nitrogen export to net anthropogenic nitrogen inputs: A review[J]. Chinese Journal of Applied Ecology, 25(1): 272-278. | |
| [52] | 张汪寿, 苏静君, 杜新忠, 等, 2015. 1990-2010年淮河流域人类活动净氮输入[J]. 应用生态学报, 26(6): 1831-1839. |
| ZHANG W S, SU J J, DU X Z, et al., 2015. Net anthropogenic nitrogen input to Huaihe River basin,China during 1990-2010 [J]. Chinese Journal of Applied Ecology, 26(6): 1831-1839. | |
| [53] |
张玉兰, 康世昌, 史贵涛, 等, 2021. 青藏高原冰川氮记录研究进展[J]. 冰川冻土, 43(1): 135-144.
DOI |
|
ZHANG Y L, KANG S C, SHI G T, et al., 2021. Research progress on nitrogen records from glaciers in the Tibetan Plateau[J]. Journal of Glaciology and Geocryology, 43(1): 135-144.
DOI |
|
| [54] | 周涛, 王云鹏, 王芳, 等, 2014. 广东省农业氮足迹分析[J]. 中国环境科学, 34(9): 2430-2438. |
| ZHOU T, WANG Y P, WANG F, et al., 2014. Analysis of the nitrogen footprint of agriculture in Guangdong[J]. China Environmental Science, 34(9): 2430-2438. |
| [1] | LI Jianhui, DANG Zheng, CHEN Lin. Spatial-temporal Characteristics of PM2.5 and Its Influencing Factors in the Yellow River Jiziwan Metropolitan Area [J]. Ecology and Environment, 2023, 32(4): 697-705. |
| [2] | ZHANG Lin, QI Shi, ZHOU Piao, WU Bingchen, ZHANG Dai, ZHANG Yan. Study on Influencing Factors of Soil Organic Carbon Content in Mixed Broad-leaved and Coniferous Forests Land in Beijing Mountainous Areas [J]. Ecology and Environment, 2023, 32(3): 450-458. |
| [3] | HE Yanhu, GONG Zhenjie, WU Haibin, CAI Yanpeng, YANG Zhifeng, CHEN Xiaohong. Spatiotemporal Evolution of Urban Eco-efficiency and Its Influencing Factors in Guangdong-Hong Kong-Macao Greater Bay Area [J]. Ecology and Environment, 2023, 32(3): 469-480. |
| [4] | HAO Jinhu, WEI Wei, LI Shengnan, MA Muyuan, LI Xiaoxia, YANG Hongguo, JIANG Qiyu, CHAI Peidong. GEE Based Evaluation of the Spatial-temporal Pattern and Drivers of Long-term Water Body in Beijing-Tianjin-Hebei [J]. Ecology and Environment, 2023, 32(3): 556-566. |
| [5] | ZHANG Li, LI Cheng, TAN Haoze, WEI Jiayi, CHENG Jiong, PENG Guixiang. Reduction Effect and Influencing Factors of Typical Urban Woodlands on Atmospheric Particulate Matter in Guangzhou [J]. Ecology and Environment, 2023, 32(2): 341-350. |
| [6] | YUAN Linjiang, LI Mengbo, LENG Gang, ZHONG Bingbing, XIA Dapeng, WANG Jinghua. Synergistic Effect of Sulfate Reduction and Ammonia Oxidation in Anaerobic Environment [J]. Ecology and Environment, 2023, 32(1): 207-214. |
| [7] | JIANG Peng, QIN Mei’ou, LI Rongping, MENG Ying, YANG Feiyun, WEN Rihong, SUN Pei, FANG Yuan. Seasonal Variability of GPP and Its Influencing Factors in the Typical Ecosystems in China [J]. Ecology and Environment, 2022, 31(4): 643-651. |
| [8] | ZHAO Anzhou, TIAN Xinle. Spatiotemporal Evolution and Influencing Factors of Vegetation Coverage in the Loess Plateau from 1986 to 2021 Based on GEE Platform [J]. Ecology and Environment, 2022, 31(11): 2124-2133. |
| [9] | LI Liangliang, DAI Liangyu, GAO Weichang, ZHANG Shuyi, LIU Taoze. The Occurrence Characteristics and Influencing Factors of Residual Mulching Film of Typical Farmland with Plastic Film in Guizhou Province [J]. Ecology and Environment, 2022, 31(11): 2189-2197. |
| [10] | LI Shengzeng, HAO Saimei, TAN Luyao, ZHANG Huaicheng, XU Biao, GU Shumao, PAN Guang, WANG Shuyan, YAN Huaizhong, ZHANG Guiqin. Characteristics of Spatiotemporal Variation, and Factors Influencing Secondary Components in PM2.5 in Ji'nan [J]. Ecology and Environment, 2022, 31(1): 100-109. |
| [11] | LI Shaoning, TAO Xueying, LI Xiuhong, ZHAO Na, XU Xiaotian, LU Shaowei. Research Progress of Beneficial Biogenic Volatile Organic Compounds Released from Plants [J]. Ecology and Environment, 2022, 31(1): 187-195. |
| [12] | CAI Yang, LI Wei, ZUO Xueyan, CUI Lijuan, LEI Yinru, ZHAO Xinsheng, ZHAI Xiajie, LI Jing, PAN Xu. Distribution Characteristics and Influencing Factors of PAHs in Yancheng Coastal Wetland Soil [J]. Ecology and Environment, 2021, 30(6): 1249-1259. |
| [13] | TIAN Yichao, YANG Tang, XU Xin. Temporal and Spatial Distribution Characteristics and Influencing Factors of Net Primary Productivity of Vegetation in Typical Basin Entering the Sea in Beibu Gulf [J]. Ecology and Environment, 2021, 30(5): 938-948. |
| Viewed | ||||||
|
Full text |
|
|||||
|
Abstract |
|
|||||
Copyright © 2021 Editorial Office of ACTA PETROLEI SINICA
Address:No. 6 Liupukang Street, Xicheng District, Beijing, P.R.China, 510650
Tel: 86-010-62067128, 86-010-62067137, 86-010-62067139
Fax: 86-10-62067130
Email: syxb@cnpc.com.cn
Support byBeijing Magtech Co.ltd, E-mail:support@magtech.com.cn