
生态环境学报 ›› 2026, Vol. 35 ›› Issue (9): 1342-1355.DOI: 10.16258/j.cnki.1674-5906.2026.09.002
张继1( ), 杨世琦1,*(), 张天宇2, 刘志强1, 敖杨3
收稿日期:2025-12-31
修回日期:2026-08-16
接受日期:2026-09-07
出版日期:2026-09-18
发布日期:2026-09-16
通讯作者:
杨世琦, E-mail: 作者简介:张继(1993年生),男,工程师,硕士,主要从事地理信息系统与遥感。E-mail: zhangji0324@163.com
基金资助:
Zhang Ji1(), Yang Shiqi1,*(), Zhang Tianyu2, Liu Zhiqiang1, Ao Yang3
Received:2025-12-31
Revised:2026-08-16
Accepted:2026-09-07
Online:2026-09-18
Published:2026-09-16
摘要:
【目的】揭示重庆市净生态系统生产力(NEP)的时空演变特征及驱动因素,为该区差异化生态补偿和国土空间低碳优化提供依据。【方法】基于遥感和气象数据,采用CASA-GSMSR耦合模型估算250 m NEP,并与3种NEP产品对比评估;运用Theil-Sen趋势分析、Mann-Kendall检验、标准差椭圆、重心迁移模型及地理探测器等方法,分析NEP时空动态、演变轨迹及驱动因素。【结果】估算的NEP年际变化与3种产品一致,量级与ZENG、FLUXCOM相当。2003-2023年NEP总体呈波动上升趋势,2015年前后由快速增长转为稳中略降。重庆市多年平均NEP为213.49 g·m−2·a−1,碳源和碳汇面积占比分别为20.65%和79.35%,碳汇核心区位于渝东北、渝东南高海拔山区,碳源区集中在渝西、中心城区及长江沿岸。空间格局呈“源退汇进”演变,碳源区向中心城区收缩集聚,碳汇区持续巩固并向外围扩张。植被类型、气温和DEM是主导NEP空间分异的自然因子,而人口密度等人文因子独立解释力有限,但与DEM交互后解释力明显提升。【结论】重庆市以碳汇为主,碳汇功能总体增强。NEP空间分异由自然因子主导,人文因子与DEM的交互作用揭示了山地地形对人类活动的约束是维持区域碳汇功能的关键。
中图分类号:
张继, 杨世琦, 张天宇, 刘志强, 敖杨. 基于CASA-GSMSR模型的重庆市NEP时空演变特征及驱动因素分析[J]. 生态环境学报, 2026, 35(9): 1342-1355.
Zhang Ji, Yang Shiqi, Zhang Tianyu, Liu Zhiqiang, Ao Yang. Spatiotemporal Evolution and Driving Factors of Net Ecosystem Productivity in Chongqing Based on the CASA-GSMSR Model[J]. Ecology and Environmental Sciences, 2026, 35(9): 1342-1355.
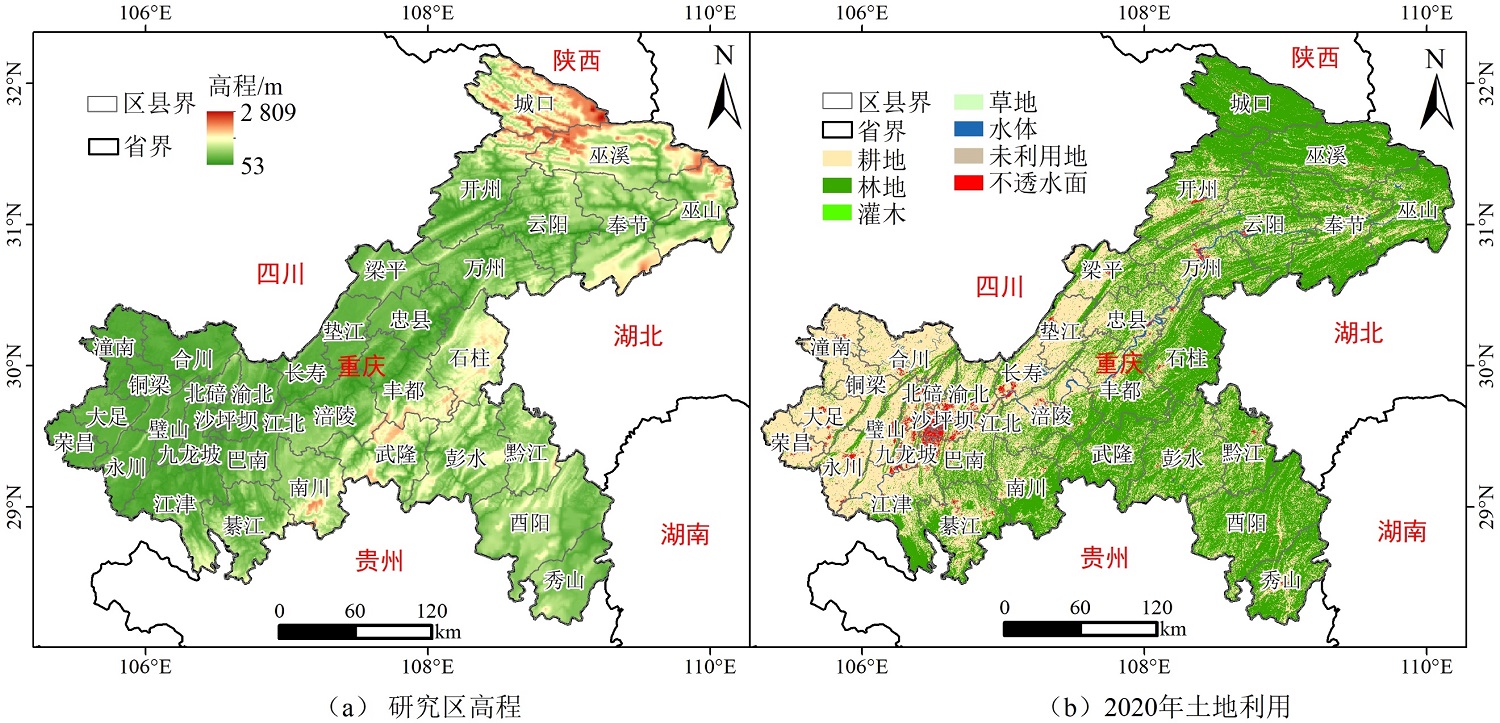
图1 研究区概况
Figure 1 Overview of the study area
| 数据类别 | 数据名称 | 时间范围 | 空间分辨率 | 数据来源 |
|---|---|---|---|---|
| NEP估算所需数据 | NDVI | 2003-2023 | 250 m | https://lpdaac.usgs.gov/products/mcd19a3dv061/ |
| 植被类型 | 2003-2023 | 500 m | https://lpdaac.usgs.gov/products/mcd12q1v061/ | |
| 太阳总辐射 | 2003-2023 | 1° | https://ceres.larc.nasa.gov/data/ | |
| 气温、降水 | 2003-2023 | - | http://cq.cma.gov.cn/ | |
| 影响因子数据 | DEM | - | 30 m | https://lpdaac.usgs.gov/products/nasadem_shhpv001/ |
| 土壤有机碳密度 | - | 250 m | https://soilgrids.org/ | |
| 坡度、坡向 | - | 30 m | https://lpdaac.usgs.gov/products/nasadem_shhpv001/ | |
| 岩溶类型 | - | - | https://www.karst.cgs.gov.cn/ | |
| 土壤类型 | - | - | https://www.resdc.cn/ | |
| 土地利用类型 | 2003-2023 | 30 m | https://zenodo.org/records/15853565 | |
| 人口密度 | 2003-2023 | 1 km | https://landscan.ornl.gov/ | |
| 夜间灯光 | 2003-2023 | 1 km | https://zenodo.org/records/17013414 | |
| 对比验证数据 | ZENG NEP | 2003-2019 | 0.1° | https://doi.org/10.17595/20200227.001 |
| FLUXCOM NEP | 2003-2015 | 0.0833° | https://www.bgc-jena.mpg.de/ | |
| BESS NEP | 2003-2022 | 0.05° | https://www.environment.snu.ac.kr/bessv2 |
表1 数据来源
Table 1 Data sources
| 数据类别 | 数据名称 | 时间范围 | 空间分辨率 | 数据来源 |
|---|---|---|---|---|
| NEP估算所需数据 | NDVI | 2003-2023 | 250 m | https://lpdaac.usgs.gov/products/mcd19a3dv061/ |
| 植被类型 | 2003-2023 | 500 m | https://lpdaac.usgs.gov/products/mcd12q1v061/ | |
| 太阳总辐射 | 2003-2023 | 1° | https://ceres.larc.nasa.gov/data/ | |
| 气温、降水 | 2003-2023 | - | http://cq.cma.gov.cn/ | |
| 影响因子数据 | DEM | - | 30 m | https://lpdaac.usgs.gov/products/nasadem_shhpv001/ |
| 土壤有机碳密度 | - | 250 m | https://soilgrids.org/ | |
| 坡度、坡向 | - | 30 m | https://lpdaac.usgs.gov/products/nasadem_shhpv001/ | |
| 岩溶类型 | - | - | https://www.karst.cgs.gov.cn/ | |
| 土壤类型 | - | - | https://www.resdc.cn/ | |
| 土地利用类型 | 2003-2023 | 30 m | https://zenodo.org/records/15853565 | |
| 人口密度 | 2003-2023 | 1 km | https://landscan.ornl.gov/ | |
| 夜间灯光 | 2003-2023 | 1 km | https://zenodo.org/records/17013414 | |
| 对比验证数据 | ZENG NEP | 2003-2019 | 0.1° | https://doi.org/10.17595/20200227.001 |
| FLUXCOM NEP | 2003-2015 | 0.0833° | https://www.bgc-jena.mpg.de/ | |
| BESS NEP | 2003-2022 | 0.05° | https://www.environment.snu.ac.kr/bessv2 |
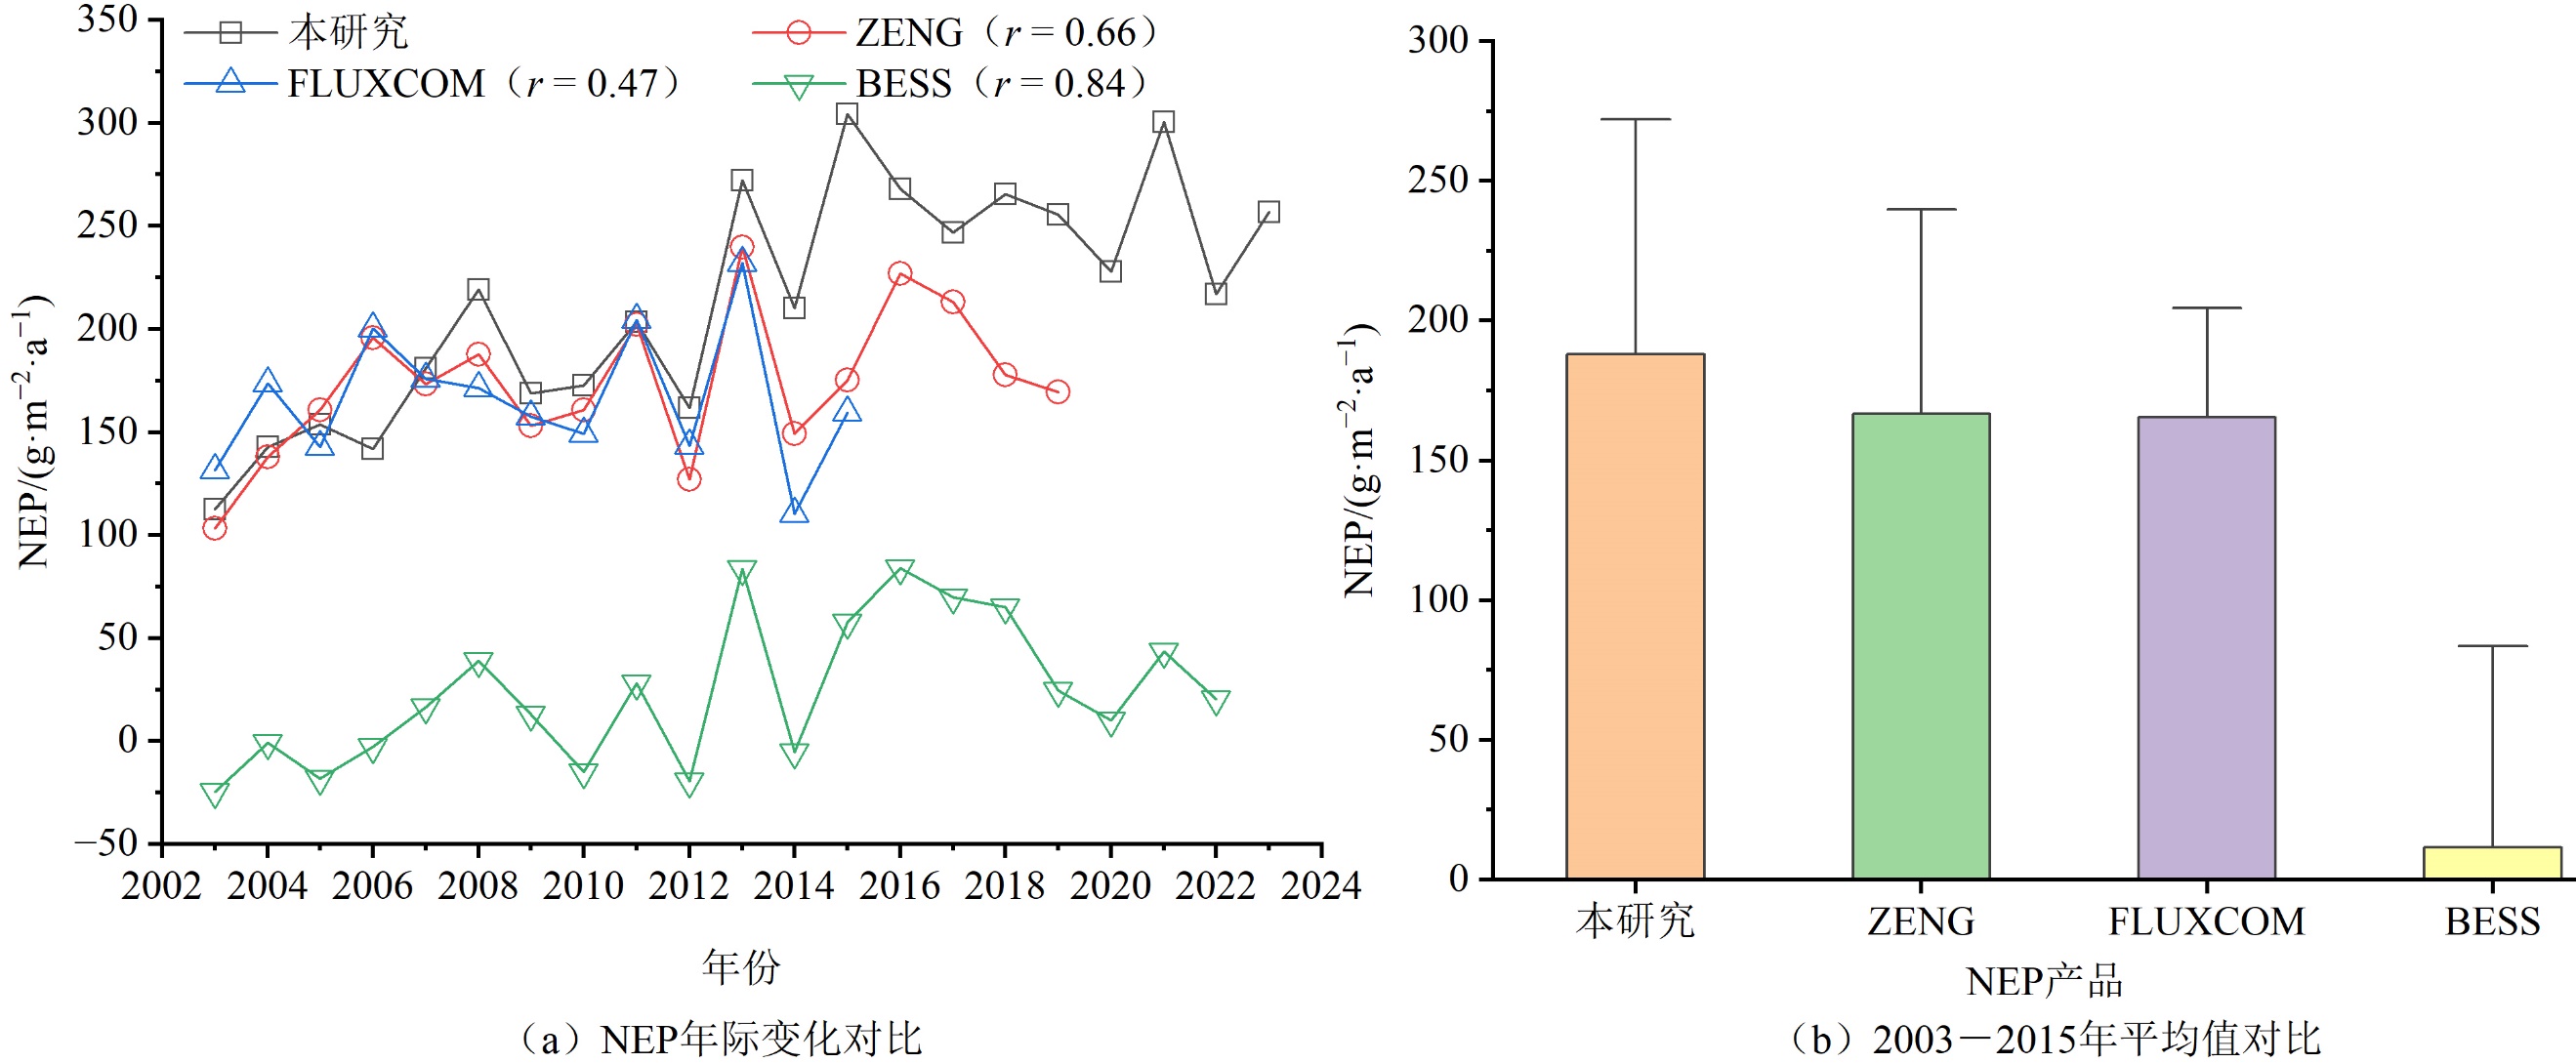
图2 4种NEP产品的年际变化和平均值对比
Figure 2 Comparison of interannual variations and multi-year mean values among the four NEP datasets
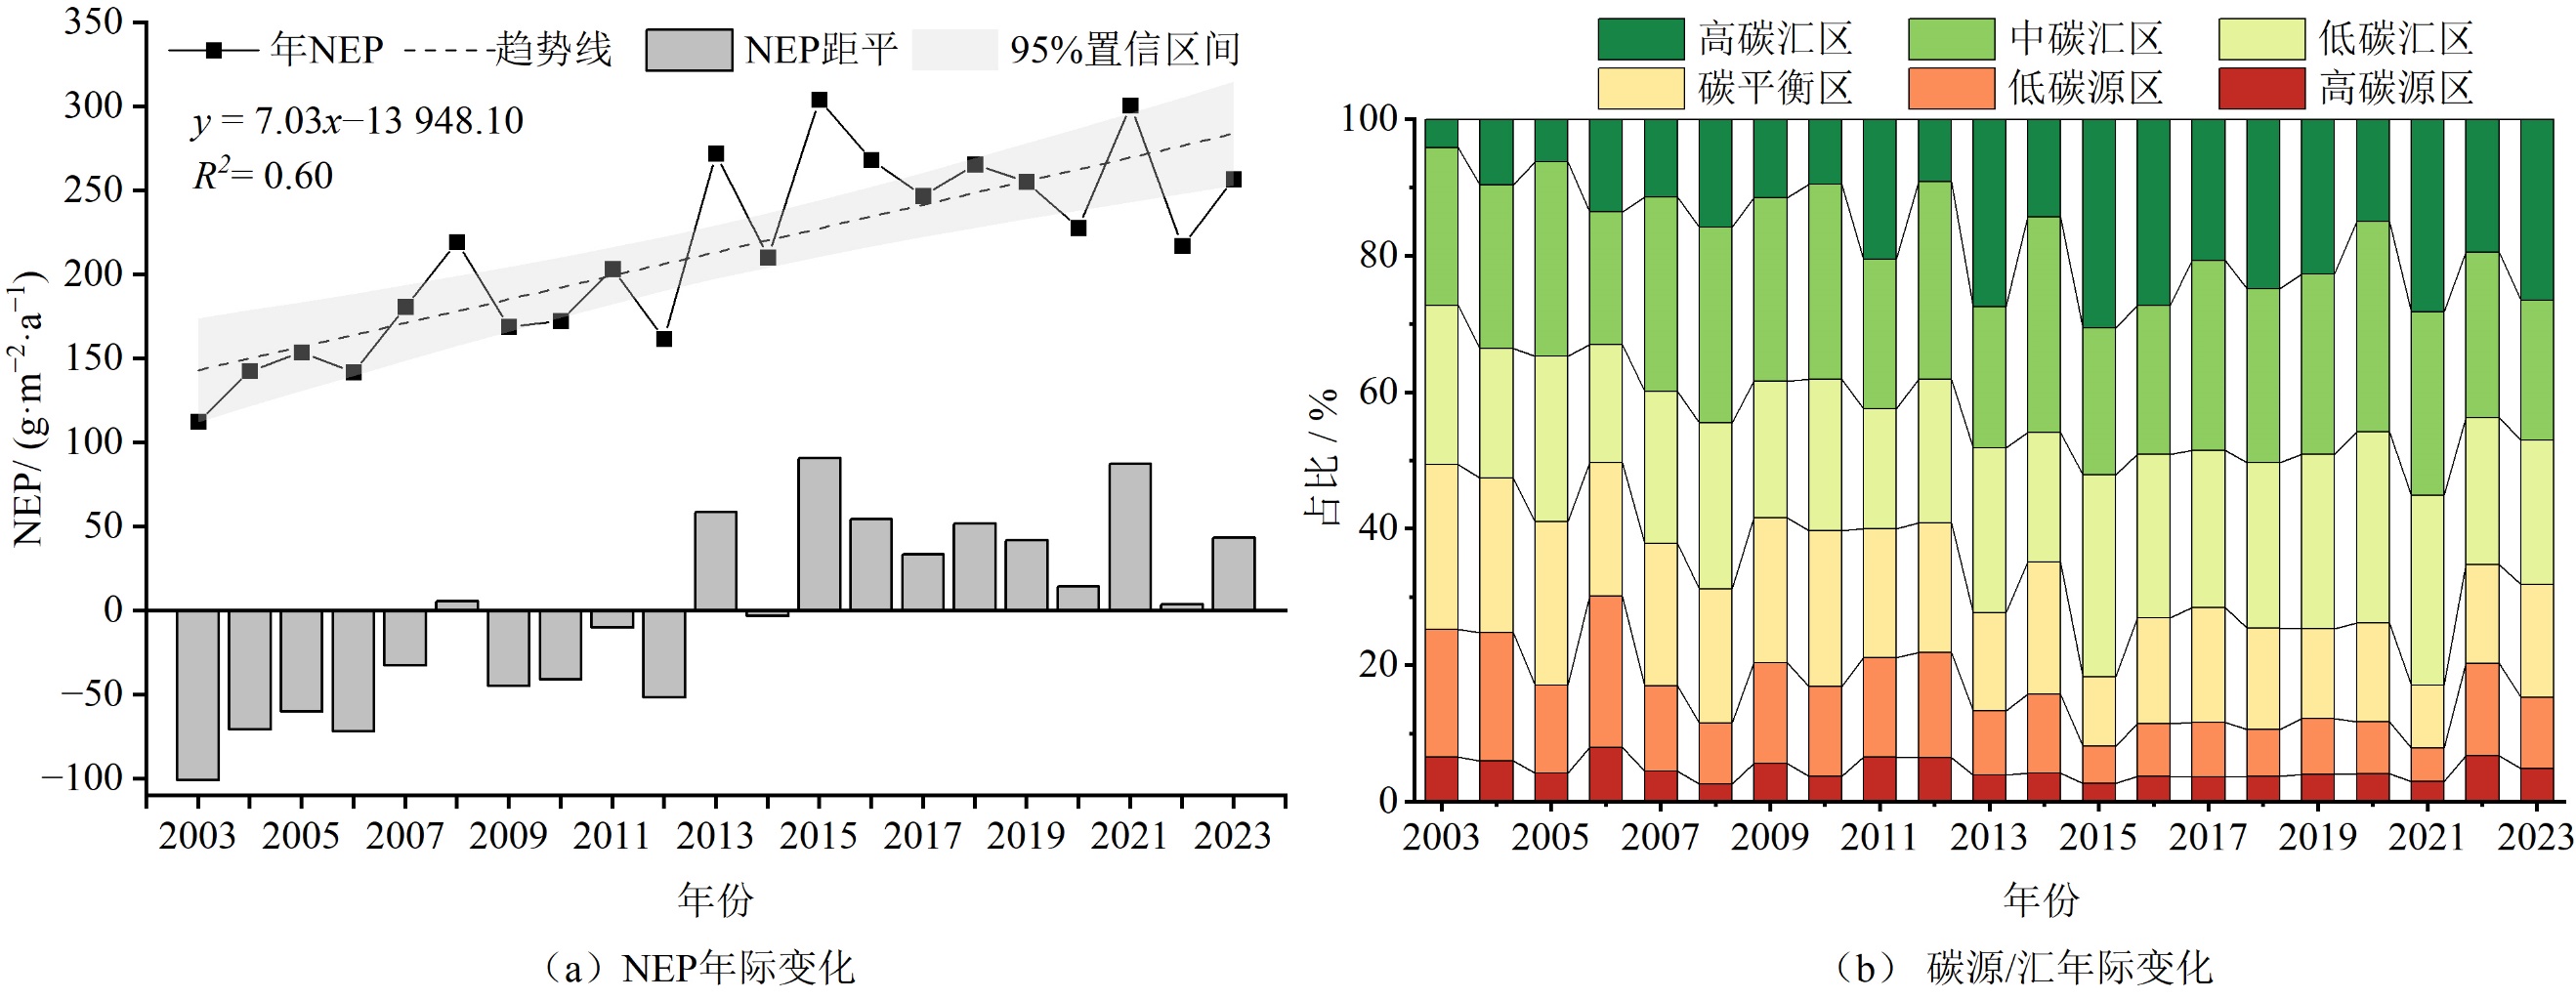
图3 重庆市NEP及碳源/汇年际变化
Figure 3 Interannual changes in NEP and carbon sources/sinks in Chongqing
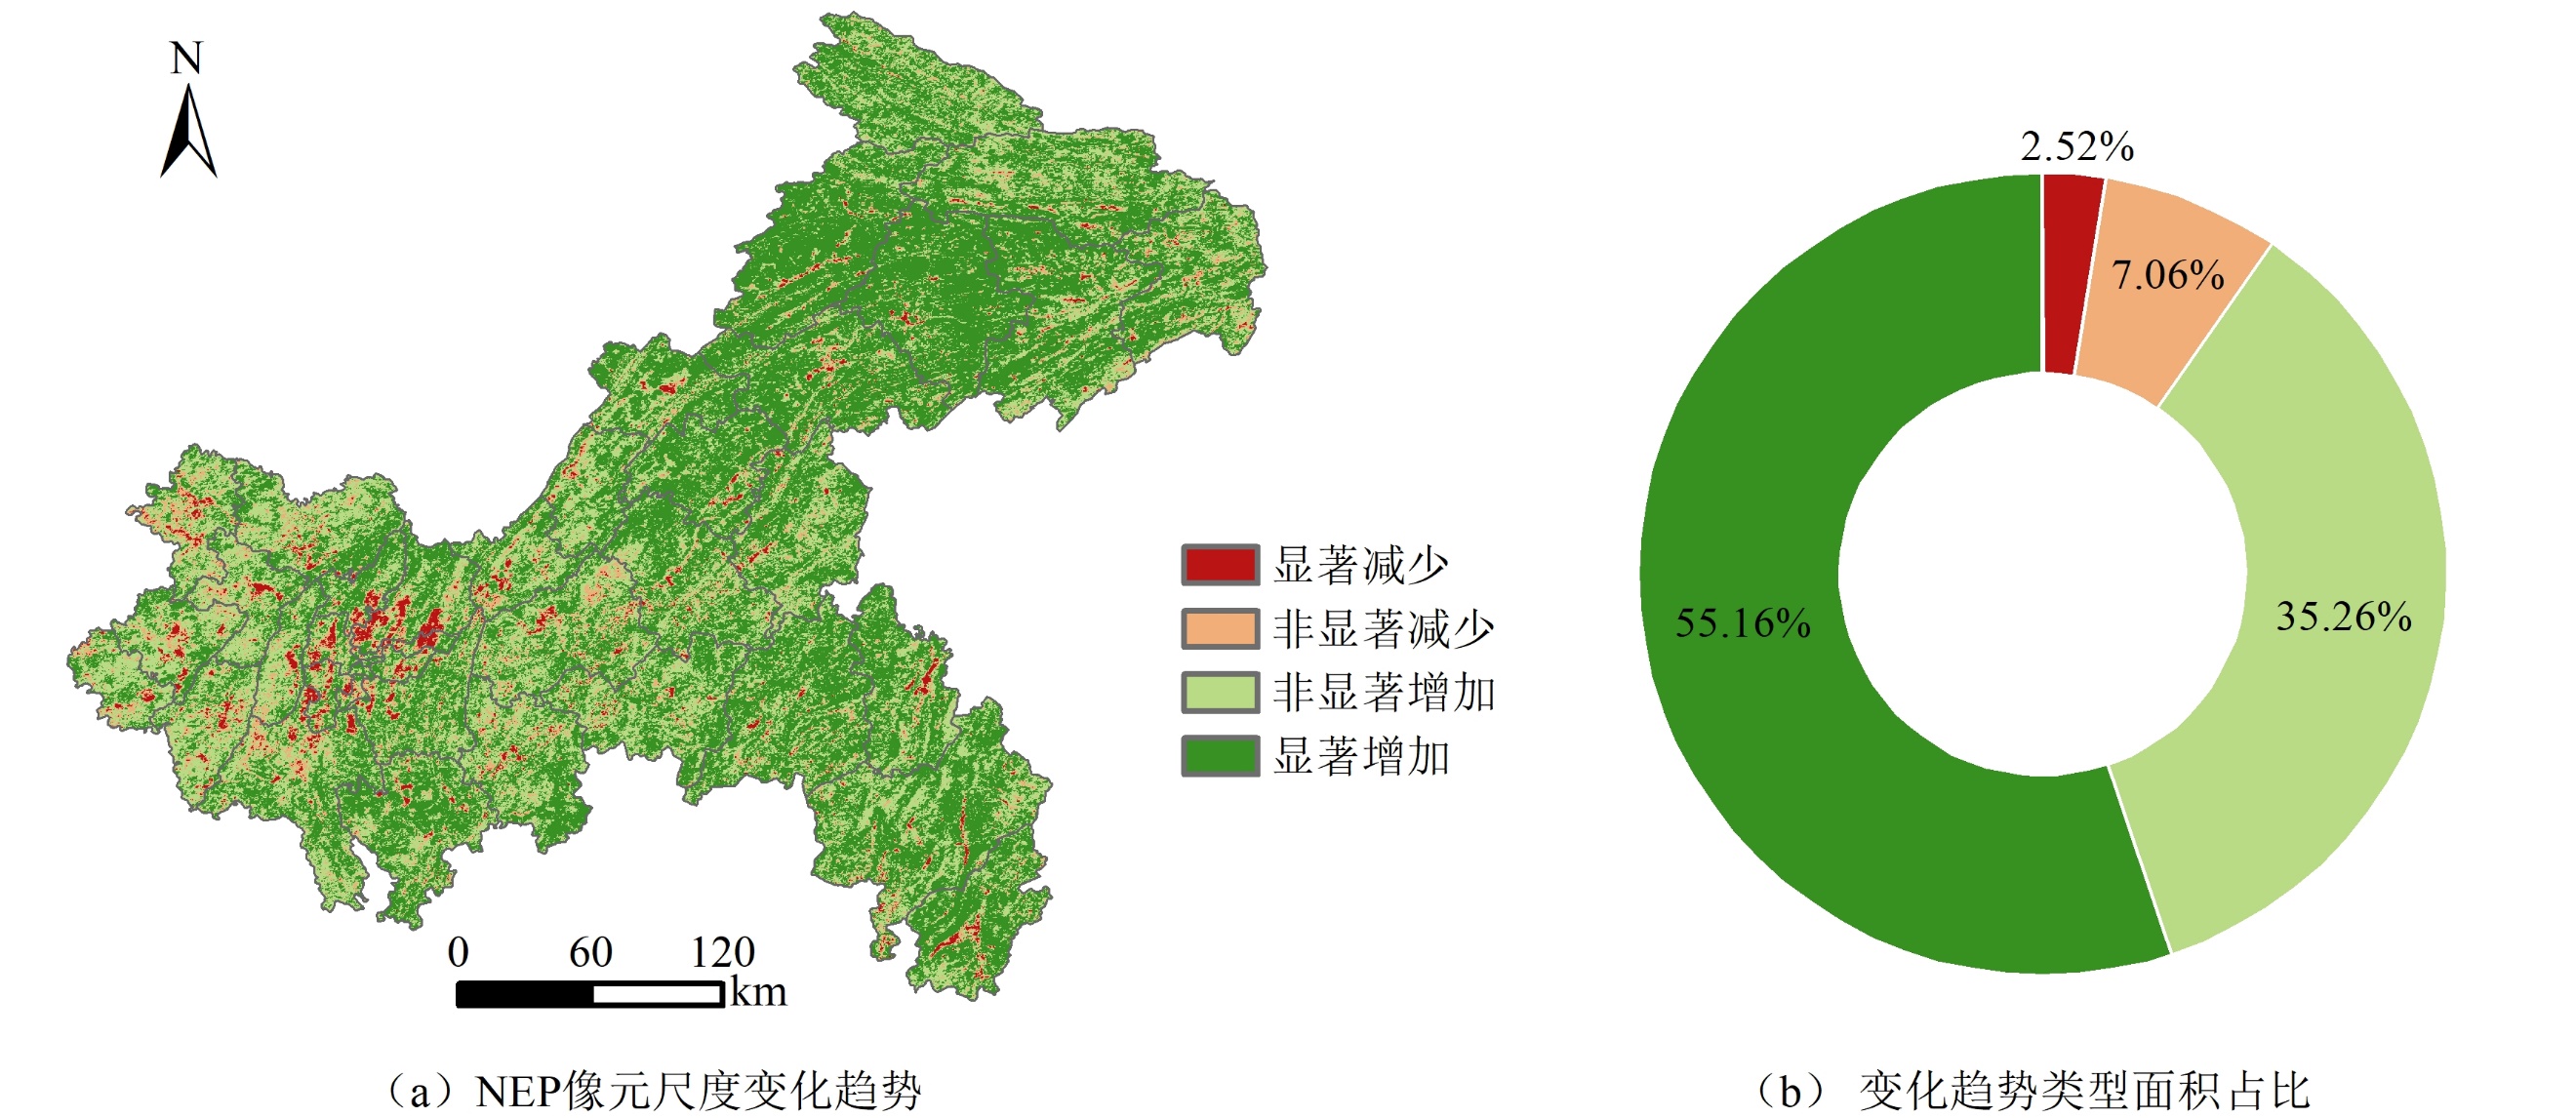
图4 重庆市NEP像元尺度的年际变化趋势及面积占比
Figure 4 Interannual variation trends of NEP at the pixel scale and area proportions in Chongqing

图5 2003-2023年重庆市多年平均NEP空间分布及分级占比统计
Figure 5 Spatial distribution of multi-year average NEP and statistics of classification proportions in Chongqing from 2003 to 2023
| 碳源/汇分级 | 2003年 | 2023年 | |||||||
|---|---|---|---|---|---|---|---|---|---|
| X轴/km | Y轴/km | 方位角/(°) | 面积/km2 | X轴/km | Y轴/km | 方位角/(°) | 面积/km2 | ||
| 高碳源区 | 176.84 | 95.62 | 54.71 | 53121.30 | 165.05 | 79.95 | 62.92 | 41455.50 | |
| 低碳源区 | 175.63 | 91.37 | 59.56 | 50414.70 | 171.34 | 90.13 | 63.52 | 48511.80 | |
| 碳平衡区 | 161.12 | 90.33 | 59.87 | 45720.40 | 160.63 | 83.56 | 60.35 | 42163.90 | |
| 低碳汇区 | 111.09 | 146.89 | 40.53 | 51264.00 | 161.31 | 101.27 | 58.22 | 51318.70 | |
| 中碳汇区 | 81.16 | 185.09 | 23.63 | 47189.40 | 97.05 | 156.90 | 28.47 | 47834.90 | |
| 高碳汇区 | 72.34 | 178.10 | 29.76 | 40471.50 | 82.27 | 187.20 | 21.70 | 48378.50 | |
表2 重庆市碳源/汇空间分布的标准差椭圆参数
Table 2 Parameters of standard deviational ellipses for the spatial distribution of carbon sources and sinks in Chongqing
| 碳源/汇分级 | 2003年 | 2023年 | |||||||
|---|---|---|---|---|---|---|---|---|---|
| X轴/km | Y轴/km | 方位角/(°) | 面积/km2 | X轴/km | Y轴/km | 方位角/(°) | 面积/km2 | ||
| 高碳源区 | 176.84 | 95.62 | 54.71 | 53121.30 | 165.05 | 79.95 | 62.92 | 41455.50 | |
| 低碳源区 | 175.63 | 91.37 | 59.56 | 50414.70 | 171.34 | 90.13 | 63.52 | 48511.80 | |
| 碳平衡区 | 161.12 | 90.33 | 59.87 | 45720.40 | 160.63 | 83.56 | 60.35 | 42163.90 | |
| 低碳汇区 | 111.09 | 146.89 | 40.53 | 51264.00 | 161.31 | 101.27 | 58.22 | 51318.70 | |
| 中碳汇区 | 81.16 | 185.09 | 23.63 | 47189.40 | 97.05 | 156.90 | 28.47 | 47834.90 | |
| 高碳汇区 | 72.34 | 178.10 | 29.76 | 40471.50 | 82.27 | 187.20 | 21.70 | 48378.50 | |
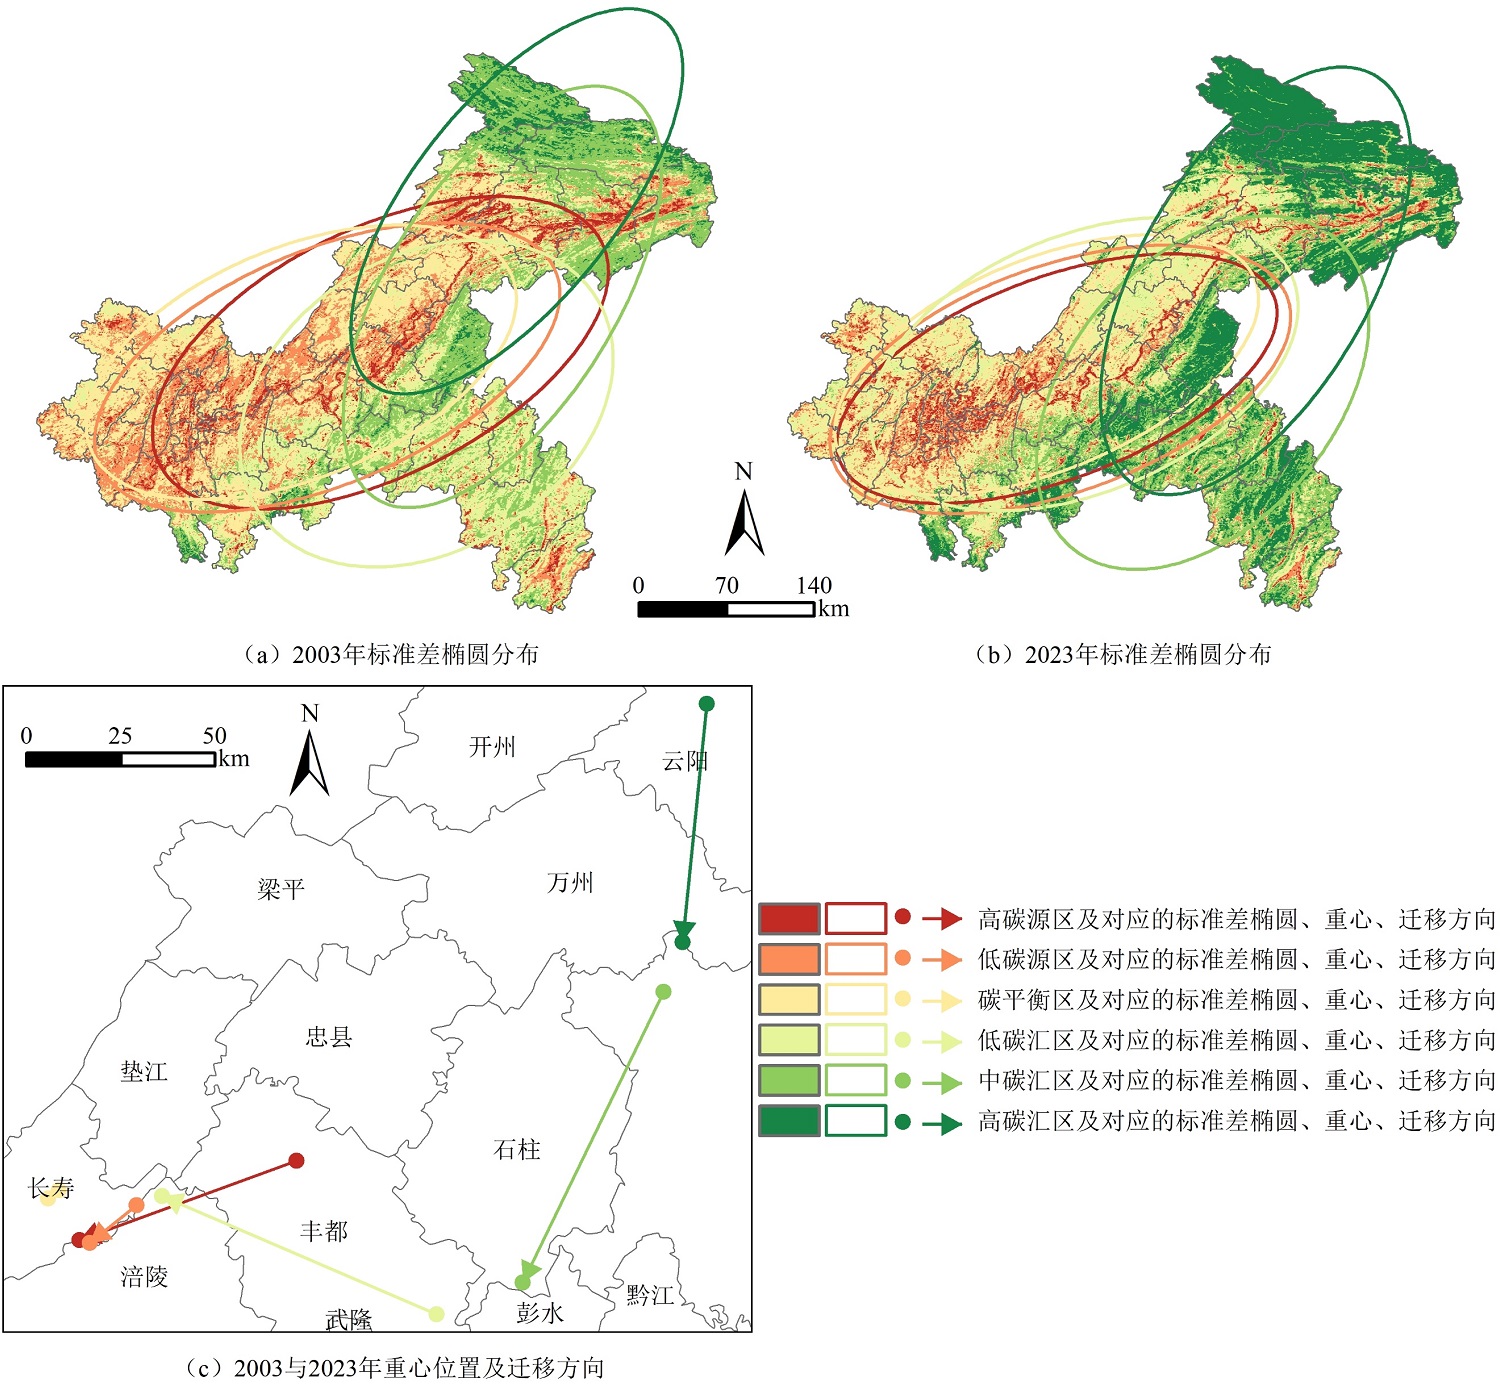
图6 重庆市碳源/汇标准差椭圆分布及重心迁移方向
Figure 6 Distribution of standard deviational ellipses and migration directions of the gravity centers of carbon sources and sinks in Chongqing
| 因子类别 | 变量名称 | q值 | 适宜范围或类型 | NEP/(g·m−2·a−1) |
|---|---|---|---|---|
| 自然因子 | NDVI | 0.57 | 0.76-0.87 | 514.51 |
| 植被类型 | 0.75 | 常绿阔叶林 | 592.34 | |
| 太阳总辐射 | 0.37 | 3910-4050 MJ·m−2 | 528.87 | |
| 气温 | 0.72 | 5.12-12.10 ℃ | 561.28 | |
| 降水 | 0.41 | 1620-1790 mm | 596.80 | |
| DEM | 0.71 | 1380-2610 m | 555.66 | |
| 坡度 | 0.30 | 11.50°-31.80° | 452.60 | |
| 坡向 | 0.01 | 北坡 | 286.64 | |
| 岩溶类型 | 0.19 | 岩溶区 | 354.31 | |
| 土壤类型 | 0.38 | 黄褐土 | 579.27 | |
| 土壤有机碳密度 | 0.42 | 5.64-6.72 kg·m−2 | 570.75 | |
| 人文因子 | 土地利用类型 | 0.29 | 林地 | 469.46 |
| 人口密度 | 0.44 | 0.03-14.30 person·km−2 | 492.26 | |
| 夜间灯光 | 0.13 | 0 | 259.33 |
表3 重庆市NEP空间分异的影响因子q值及其适宜区间
Table 3 q values and optimal ranges of factors influencing the spatial differentiation of NEP in Chongqing
| 因子类别 | 变量名称 | q值 | 适宜范围或类型 | NEP/(g·m−2·a−1) |
|---|---|---|---|---|
| 自然因子 | NDVI | 0.57 | 0.76-0.87 | 514.51 |
| 植被类型 | 0.75 | 常绿阔叶林 | 592.34 | |
| 太阳总辐射 | 0.37 | 3910-4050 MJ·m−2 | 528.87 | |
| 气温 | 0.72 | 5.12-12.10 ℃ | 561.28 | |
| 降水 | 0.41 | 1620-1790 mm | 596.80 | |
| DEM | 0.71 | 1380-2610 m | 555.66 | |
| 坡度 | 0.30 | 11.50°-31.80° | 452.60 | |
| 坡向 | 0.01 | 北坡 | 286.64 | |
| 岩溶类型 | 0.19 | 岩溶区 | 354.31 | |
| 土壤类型 | 0.38 | 黄褐土 | 579.27 | |
| 土壤有机碳密度 | 0.42 | 5.64-6.72 kg·m−2 | 570.75 | |
| 人文因子 | 土地利用类型 | 0.29 | 林地 | 469.46 |
| 人口密度 | 0.44 | 0.03-14.30 person·km−2 | 492.26 | |
| 夜间灯光 | 0.13 | 0 | 259.33 |
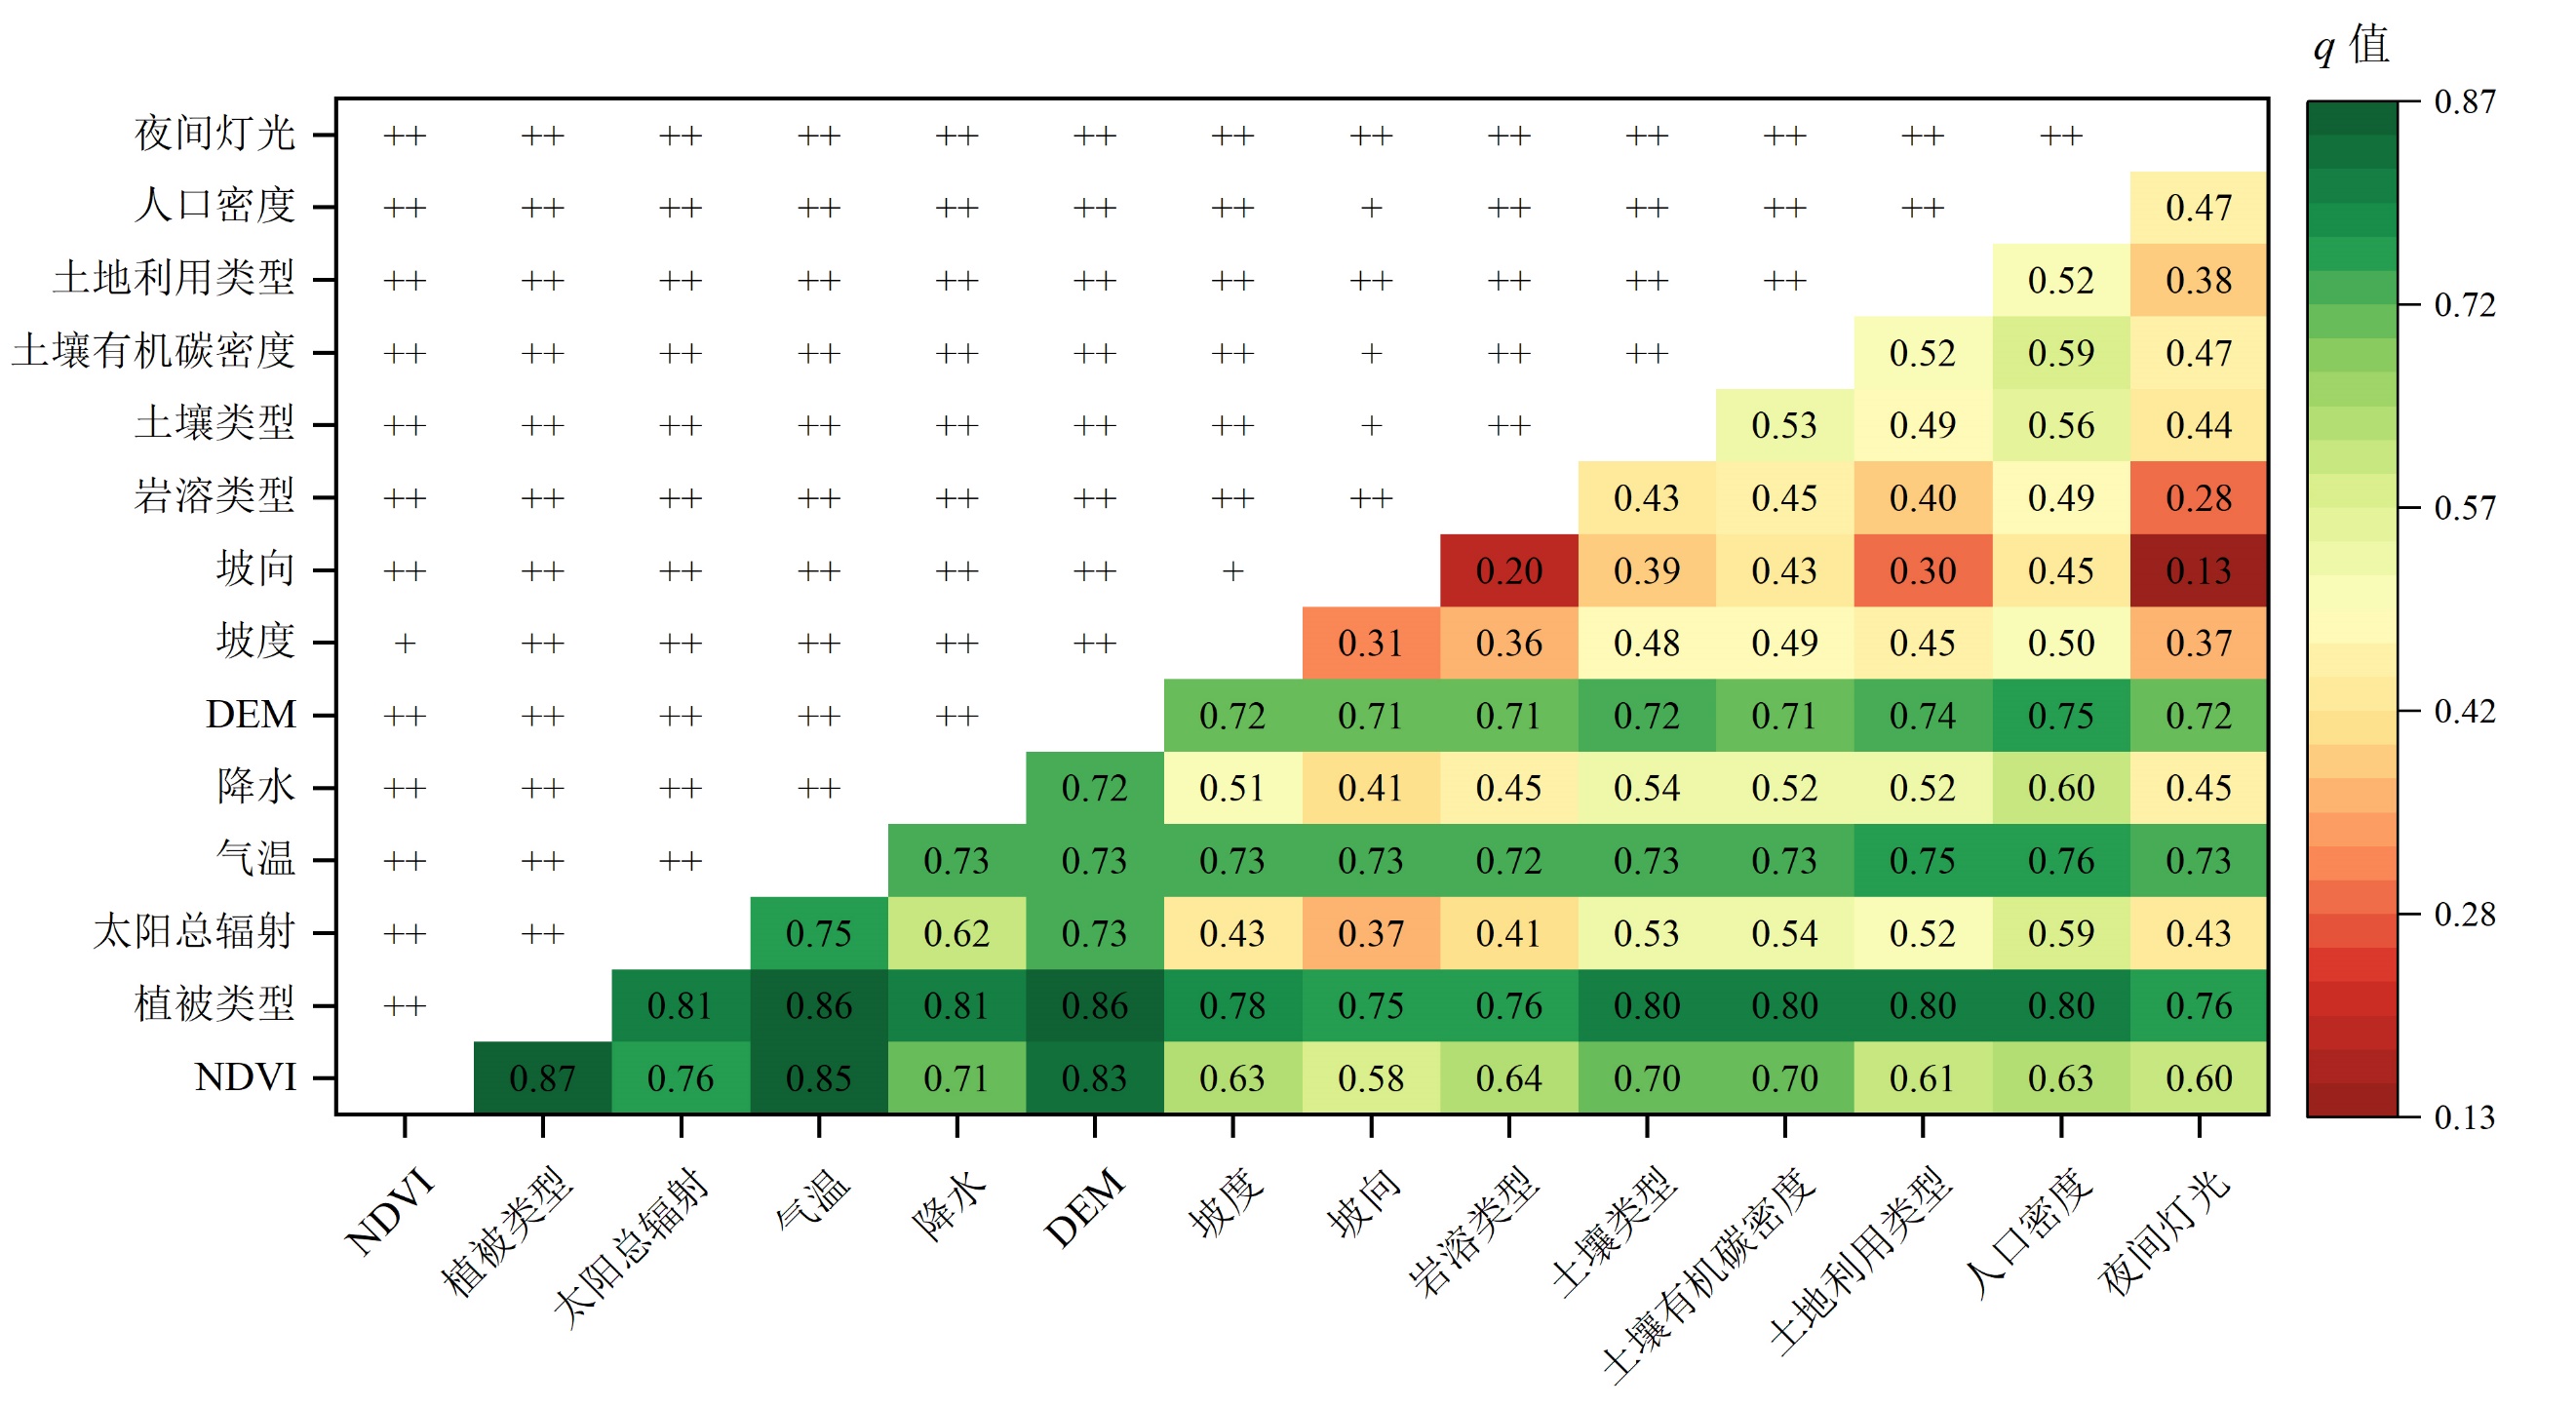
图7 因子交互作用对重庆市NEP空间分异的解释力 “+”表示非线性增强,“++”为双因子增强
Figure 7 Explanatory power of factor interactions for the spatial differentiation of NEP in Chongqing
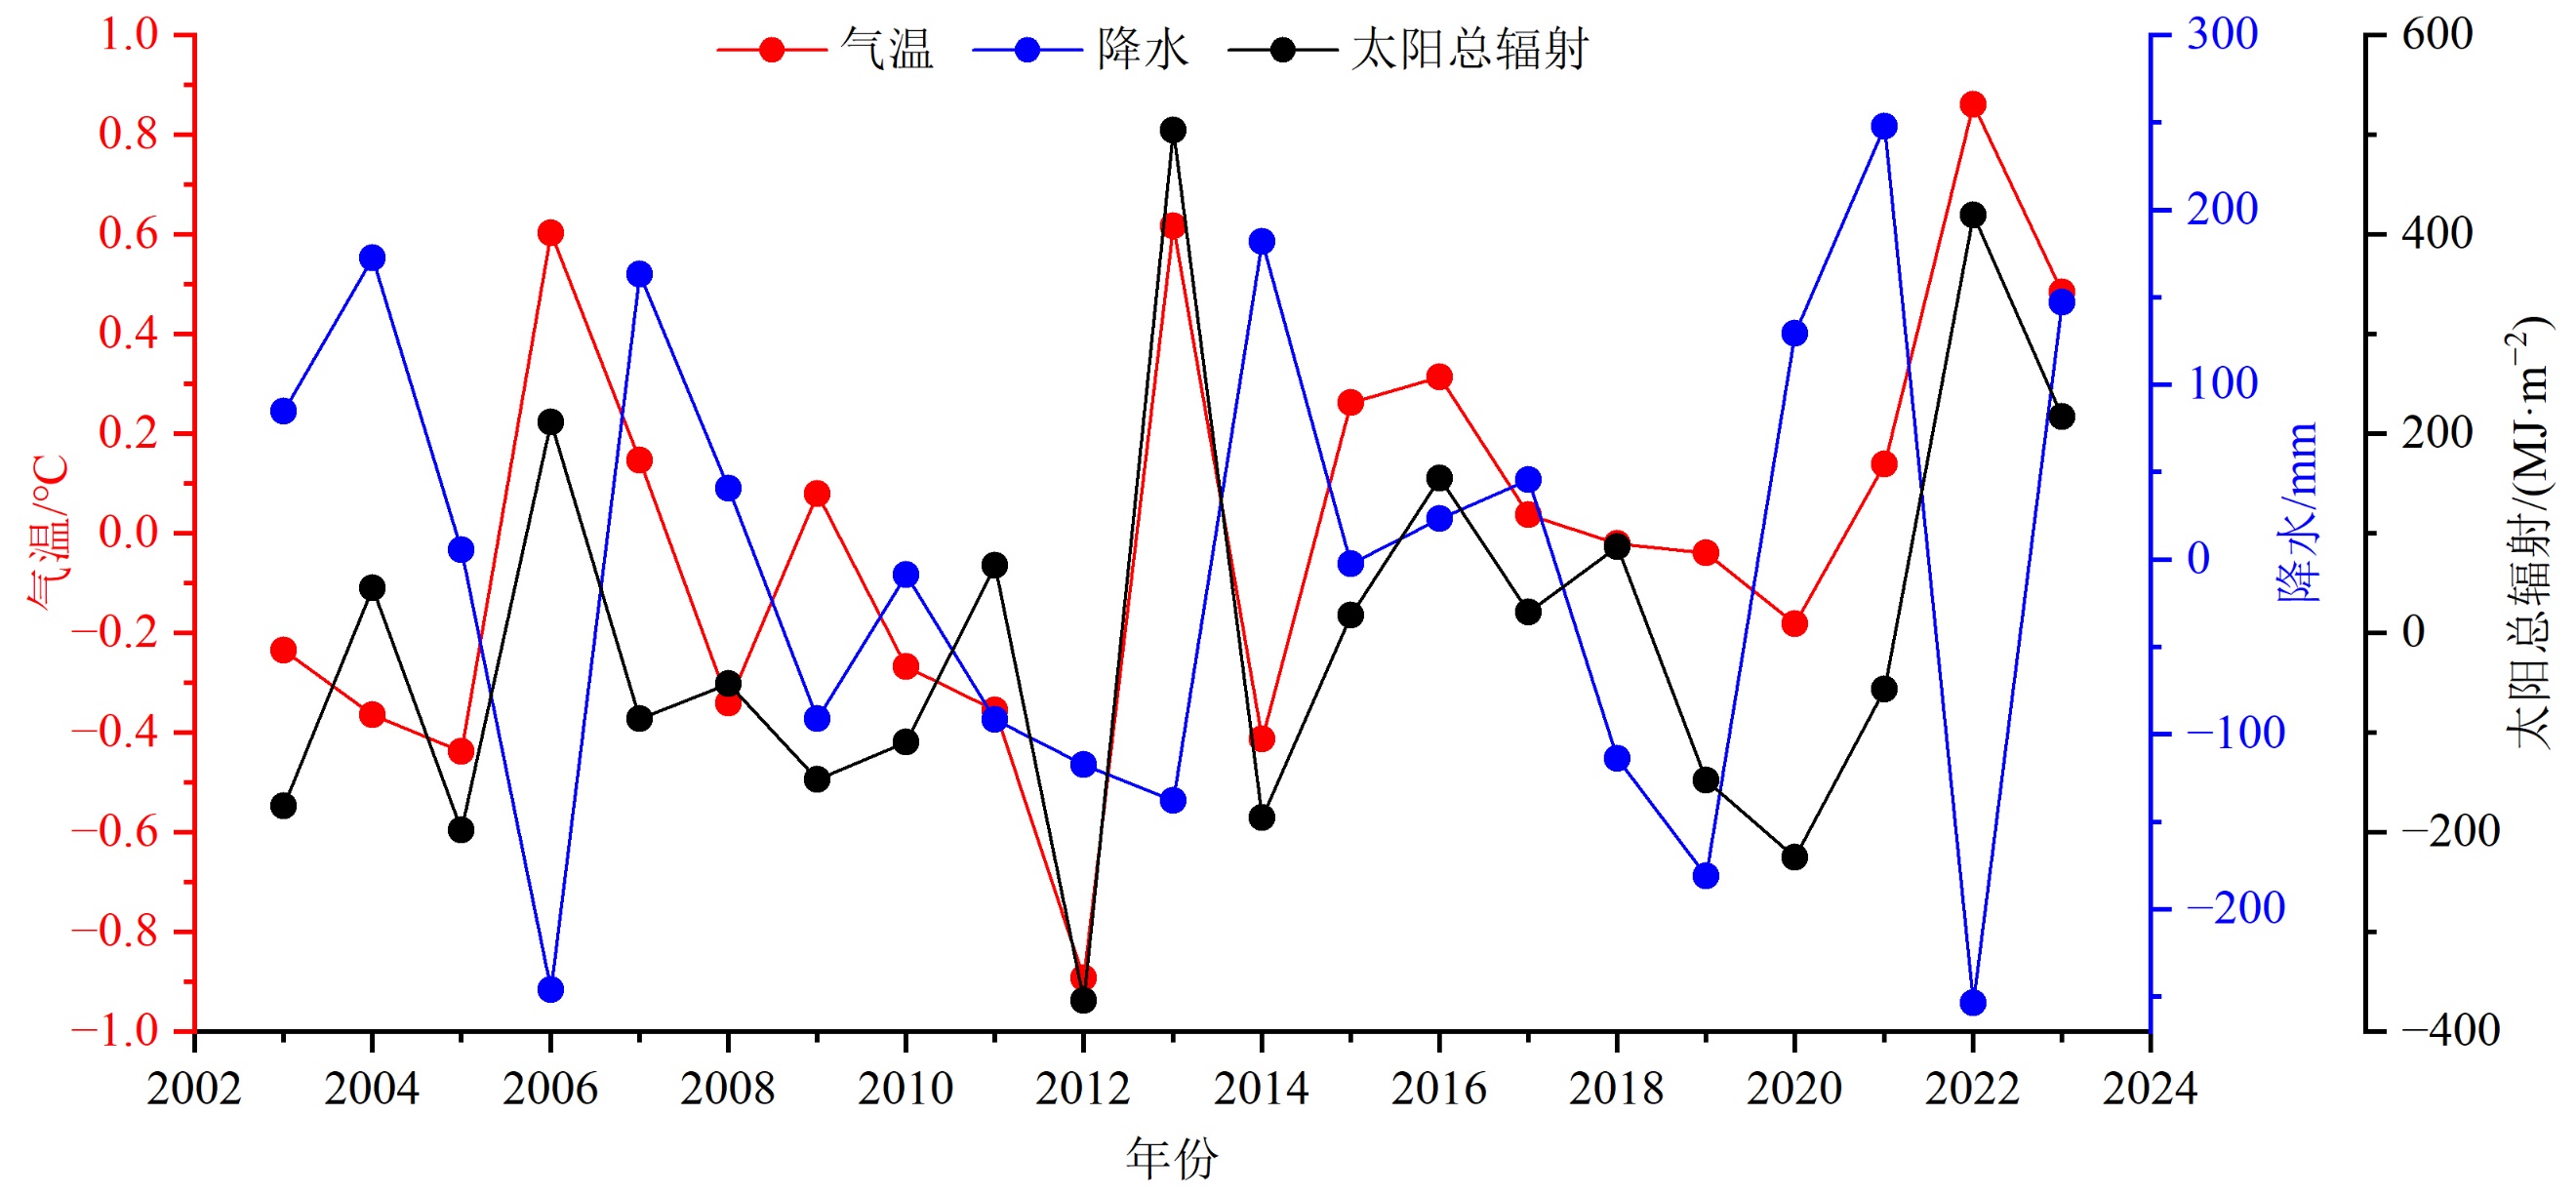
图8 2003-2023年重庆市气温、降水和太阳总辐射距平值的年际变化
Figure 8 Interannual variations of temperature, precipitation, and total solar radiation anomalies in Chongqing from 2003 to 2023
| [1] |
Ao Y, Liu X M, Zhou X, et al., 2025. Differential thresholds of net ecosystem productivity in karst and non-karst regions for identifying their potential carbon sinks areas[J]. Journal of Environmental Management, 373: 123618.
DOI URL |
| [2] |
Chen X, Wei W, Wei X X, et al., 2026. Spatio-Temporal Changes of Land Use Carbon Emission/Absorption and Its Future Trend in Important Ecological Functional Areas: A Case Study in the Yellow River Basin[J]. Land Degradation & Development, 37(5): 1792-1809.
DOI URL |
| [3] |
Chen Y, Xu Y M, Chen T Y, et al., 2024. Exploring the Spatiotemporal Dynamics and Driving Factors of Net Ecosystem Productivity in China from 1982 to 2020[J]. Remote Sensing, 16(1): 60.
DOI URL |
| [4] |
Ding Z, Zheng H, Li H, et al., 2021. Afforestation-driven increases in terrestrial gross primary productivity are partly offset by urban expansion in Southwest China[J]. Ecological Indicators, 127: 107641.
DOI URL |
| [5] |
Feng H P, Kang P, Deng Z, et al., 2023. The impact of climate change and human activities to vegetation carbon sequestration variation in Sichuan and Chongqing[J]. Environmental Research, 238: 117138.
DOI URL |
| [6] |
Friedlingstein P, O’Sullivan M, Jones M W, et al., 2025. Global Carbon Budget 2024[J]. Earth System Science Data, 17(3): 965-1039.
DOI URL |
| [7] |
Jung M, Schwalm C, Migliavacca M, et al., 2020. Scaling carbon fluxes from eddy covariance sites to globe: Synthesis and evaluation of the FLUXCOM approach[J]. Biogeosciences, 17(5): 1343-1365.
DOI URL |
| [8] |
Li B L, Ryu Y, Jiang C Y, et al., 2023b. BESSv2.0: A satellite-based and coupled-process model for quantifying long-term global land-atmosphere fluxes[J]. Remote Sensing of Environment, 295: 113696.
DOI URL |
| [9] |
Li F, Zhou W Z, Shao Z L, et al., 2022. Effects of ecological projects on vegetation in the Three Gorges Area of Chongqing, China[J]. Journal of Mountain Science, 19(1): 121-135.
DOI |
| [10] |
Li S J, Cao X, Zhao C C, et al., 2023a. Developing a pixel-scale corrected nighttime light dataset (PCNL, 1992-2021) combining DMSP-OLS and NPP-VIIRS[J]. Remote Sensing, 15(16): 3925.
DOI URL |
| [11] |
Liang L, Geng D, Yan J, et al., 2022. Remote Sensing Estimation and Spatiotemporal Pattern Analysis of Terrestrial Net Ecosystem Productivity in China[J]. Remote Sensing, 14(8): 1902.
DOI URL |
| [12] |
Poggio L, De Sousa L M, Batjes N H, et al., 2021. SoilGrids 2.0: producing soil information for the globe with quantified spatial uncertainty[J]. Soil, 7(1): 217-240.
DOI |
| [13] |
Xia L Y, Tan H J, Zhang J L, et al., 2025. Remote Sensing and Machine Learning Uncover Dominant Drivers of Carbon Sink Dynamics in Subtropical Mountain Ecosystems[J]. Remote Sensing, 17(16): 2843.
DOI URL |
| [14] |
Yang J, Huang X, 2021. The 30 m annual land cover dataset and its dynamics in China from 1990 to 2019[J]. Earth System Science Data, 13(8): 3907-3925.
DOI |
| [15] |
Yu G R, Zheng Z M, Wang Q F, et al., 2010. Spatiotemporal pattern of soil respiration of terrestrial ecosystems in China: The development of a geostatistical model and its simulation[J]. Environmental Science & Technology, 44(16): 6074-6080.
DOI URL |
| [16] |
Zeng J Y, Matsunaga T, Tan Z H, et al., 2020. Global terrestrial carbon fluxes of 1999-2019 estimated by upscaling eddy covariance data with a random forest[J]. Scientific Data, 7(1): 313.
DOI PMID |
| [17] | 白天豪, 贡恩军, 周娜芳, 等, 2025. 2001-2022年秦巴山区生态碳汇时空格局及驱动力分析[J]. 环境科学, 46(1): 356-366. |
| Bai T H, Gong E J, Zhou N F, et al., 2025. Spatiotemporal patterns and driving forces analysis of ecological carbon sink from 2001 to 2022 in Qinling-Daba Mountains, China[J]. Environmental Science, 46(1): 356-366. | |
| [18] | 陈思静, 谢新乔, 杨继周, 等, 2022. 地形复杂山区相对湿度空间插值方法对比研究[J]. 山地学报, 40(5): 778-786. |
| Chen S J, Xie X Q, Yang J Z, et al., 2022. Comparison on spatial interpolation methods of relative humidity in complex mountainous terrain[J]. Mountain Research, 40(5): 778-786. | |
| [19] |
丁馨, 刘健, 魏俐宏, 等, 2025. 基于GSMSR模型的山东省植被NEP时空格局及影响因素[J]. 生态环境学报, 34(7): 1079-1089.
DOI |
| Ding X, Liu J, Wei L H, et al., 2025. Spatiotemporal patterns and influencing factors of vegetation net ecosystem productivity in Shandong Province based on GSMSR model[J]. Ecology and Environmental Sciences, 34(7): 1079-1089. | |
| [20] | 傅慧珊, 李加林, 刘永超, 等, 2026. 长三角城市群水环境治理效率的区域差异及动态演进[J]. 中国环境科学, 46(3):1747-1763. |
| Fu H S, Li J L, Liu Y C, et al., 2026. Regional variations and the dynamic evolution of water environment governance efficiency in the Yangtze River Delta urban agglomeration[J]. China Environmental Science, 46(3): 1747-1763. | |
| [21] | 高磊, 杨现坤, 胡海珠, 等, 2019. 重庆市退耕还林工程实施的生态和经济效益分析[J]. 水土保持研究, 26(6): 353-358. |
| Gao L, Yang X K, Hu H Z, et al., 2019. Analysis on ecological and economic benefits of implementing the Project of Returning Farmlands to Forests in Chongqing City[J]. Research of Soil and Water Conservation, 26(6): 353-358. | |
| [22] |
官冬杰, 殷博灵, 2020. 重庆市渝东北生态红线区域生态环境质量评估[J]. 重庆交通大学学报(自然科学版), 39(10): 105-117.
DOI |
| Guan D J, Yin B L, 2020. Assessment of ecological environment quality of Ecological Red Line Area in Northeast Chongqing[J]. Journal of Chongqing Jiaotong University (Natural Science), 39(10): 105-117. | |
| [23] | 管亚兵, 王军, 覃莉, 等, 2025. 黄土高原植被碳源/汇估算及其对土地利用变化的响应: 以延河流域为例[J]. 环境科学, 46(3): 1657-1665. |
| Guan Y B, Wang J, Qin L, et al., 2025. Estimation of vegetation carbon source/sink and its response to land use change in the Loess Plateau: A case study of Yanhe River Basin[J]. Environmental Science, 46(3): 1657-1665. | |
| [24] | 黄纪星, 刘婉仪, 林金煌, 等, 2025. 基于生态系统固碳服务流的福建省横向生态补偿[J]. 应用生态学报, 36(11): 3443-3456. |
|
Huang J X, Liu W Y, Lin J H, et al., 2025. Horizontal ecological compensation based on ecosystem carbon sequestration flow in Fujian Province[J]. Chinese Journal of Applied Ecology, 36(11): 3443-3456.
DOI |
|
| [25] | 贾科, 于颖, 杨曦光, 等, 2024. 应用集合卡尔曼滤波算法对土壤呼吸速率同化及NEP估算[J]. 东北林业大学学报, 52(7): 77-84. |
| Jia K, Yu Y, Yang X G, et al., 2024. Assimilation and NEP estimation of soil respiration rate by ensemble Kalman filter algorithm[J]. Journal of Northeast Forestry University, 52(7): 77-84. | |
| [26] |
李成龙, 周广胜, 周梦子, 等, 2023. 1971-2020年盘锦芦苇湿地净生态系统生产力及其影响因子[J]. 应用生态学报, 34(5): 1331-1340.
DOI |
| Li C L, Zhou G S, Zhou M Z, et al., 2023. Net ecosystem productivity of Panjin Phragmites australis wetland during 1971 to 2020 and its impact factors[J]. Chinese Journal of Applied Ecology, 34(5): 1331-1340. | |
| [27] | 李慧, 魏兴萍, 2026. 重庆功能区碳源/汇时空演变及其影响因素[J]. 环境科学, 47(4): 2343-2358. |
| Li H, Wei X P, 2026. Spatial-temporal evolution of carbon source/sink and its influencing factors in Chongqing functional area[J]. Environmental Science, 47(4): 2343-2358. | |
| [28] | 梁任刚, 周旭, 李松, 等, 2022. 基于CWSI的贵州省干旱时空变化特征及影响因素分析[J]. 水土保持研究, 29(3): 284-291. |
| Liang R G, Zhou X, Li S, et al., 2022. Analysis of temporal and spatial variation characteristics of drought in Guizhou Province and its influencing factors based on CWSI[J]. Research of Soil and Water Conservation, 29(3): 284-291. | |
| [29] | 刘叶一, 2025. 喀斯特和非喀斯特地区植被NDVI对多时间尺度SPEI的不同响应[J]. 生态学报, 45(16): 8111-8124. |
| Liu Y Y, 2025. Diverse responses of vegetation NDVI to multi-time scale SPEI across karst and non-karst areas[J]. Acta Ecologica Sinica, 45(16): 8111-8124. | |
| [30] | 鲁韦坤, 李蒙, 程晋昕, 等, 2024. 基于BEPS模型的云南省碳源/汇时空特征及其适用性分析[J]. 生态学报, 44(4): 1441-1455. |
| Lu W K, Li M, Cheng J X, et al., 2024. Spatio-temporal characteristics and applicability of carbon source/sink in Yunnan Province based on BEPS model[J]. Acta Ecologica Sinica, 44(4): 1441-1455. | |
| [31] |
牟凤云, 李秋彦, 马英, 等, 2021. 基于地理探测器的重庆市城镇建设用地变化及驱动因素研究[J]. 重庆交通大学学报(自然科学版), 40(11): 74-81.
DOI |
| Mou F Y, Li Q Y, Ma Y, et al., 2021. Change and driving factors of urban construction land in Chongqing based on Geodetector[J]. Journal of Chongqing Jiaotong University (Natural Science), 40(11): 74-81. | |
| [32] | 庞娇, 单婧, 闫愉悦, 等, 2025. 京津冀生态系统固碳效益时空格局及驱动因素定量分离[J]. 环境科学, 46(3): 1666-1678. |
| Pang J, Shan J, Yan Y Y, et al., 2025. Quantitative separation of spatiotemporal patterns and driving factors of carbon sequestration benefits in the Beijing-Tianjin-Hebei region[J]. Environmental Science, 46(3): 1666-1678. | |
| [33] | 朴世龙, 何悦, 王旭辉, 等, 2022. 中国陆地生态系统碳汇估算: 方法、进展、展望[J]. 中国科学: 地球科学, 52(6): 1010-1020. |
| Piao S L, He Y, Wang X H, et al., 2022. Estimation of China's terrestrial ecosystem carbon sink: Methods, progress and prospects[J]. Science China Earth Sciences, 52(6): 1010-1020. | |
| [34] | 石志华, 2015. 基于CASA与GSMSR模型的陕西省植被碳汇时空模拟及影响因素研究[D]. 杨凌: 西北农林科技大学. |
| Shi Z H, 2015. Spatial-temporal simulation of vegetation carbon sink and its influential factors based on CASA and GSMSR model in Shaanxi Province[D]. Yangling: Northwest A & F University. | |
| [35] |
王劲峰, 徐成东, 2017. 地理探测器:原理与展望[J]. 地理学报, 72(1): 116-134.
DOI |
|
Wang J F, Xu C D, 2017. Geodetector: Principle and prospective[J]. Acta Geographica Sinica, 72(1): 116-134.
DOI |
|
| [36] | 王楠楠, 刘耀林, 尹峰, 等, 2025. 顾及地形校正的生态系统碳汇估算与分析[J]. 武汉大学学报(信息科学版), 50(12): 2485-2500. |
| Wang N N, Liu Y L, Yin F, et al., 2025. Estimation and analysis of net ecosystem productivity considering the topographical correction[J]. Geomatics and Information Science of Wuhan University, 50(12): 2485-2500. | |
| [37] |
王田雨, 岳文泽, 2024. 面向碳增汇的国土空间格局优化: 理论框架与行动逻辑[J]. 自然资源学报, 39(5): 1008-1021.
DOI |
|
Wang T Y, Yue W Z, 2024. Optimizing territorial spatial pattern for carbon sink growth: Theoretical framework and action logic[J]. Journal of Natural Resources, 39(5): 1008-1021.
DOI URL |
|
| [38] |
王向楠, 2024. 中国大病发生及治疗的地理分析[J]. 地理学报, 79(3): 800-816.
DOI |
|
Wang X N, 2024. The geographical analysis of the occurrence and treatment of severe diseases in China[J]. Acta Geographica Sinica, 79(3): 800-816.
DOI |
|
| [39] | 吴梦月, 2021. 中国西南地区生态系统碳循环对干旱的响应[D]. 西安: 西安科技大学. |
| Wu M Y, 2021. Responses of ecosystem carbon cycle to drought in Southwest China[D]. Xi’an: Xi’an University of Science and Technology. | |
| [40] | 徐勇, 黄雯婷, 郭振东, 等, 2023. 2000-2020年我国西南地区植被NEP时空变化及其驱动因素的相对贡献[J]. 环境科学研究, 36(3): 557-570. |
| Xu Y, Huang W T, Guo Z D, et al., 2023. Spatio-temporal variation of vegetation net ecosystem productivity and relative contribution of driving forces in Southwest China from 2000 to 2020[J]. Research of Environmental Sciences, 36(3): 557-570. | |
| [41] | 闫语, 秦耀伟, 东嘉琪, 等, 2025. 京津冀地区生态系统服务权衡与协同关系及驱动因素分析[J]. 环境科学学报, 45(3): 493-506. |
| Yan Y, Qin Y W, Dong J Q, et al., 2025. Analysis on ecosystem service trade-offs/synergies and drivers in Beijing-Tianjin-Hebei region[J]. Acta Scientiae Circumstantiae, 45(3): 493-506. | |
| [42] | 余越驰, 2022. 地表下行短波辐射的卫星遥感估算与时间升尺度研究[D]. 北京: 中国科学院大学(中国科学院空天信息创新研究院). |
| Yu Y C, 2022. Estimation of land surface shortwave downward radiation with remotely-sensed data and its temporal upscaling methods[D]. Beijing: Aerospace Information Research Institute Chinese Academy of Sciences. | |
| [43] |
翟涌光, 王晓妮, 郝蕾, 等, 2024. 2001-2020年内蒙古净生态系统生产力格局多时间尺度分析[J]. 生态环境学报, 33(2): 167-179.
DOI |
| Zhai Y G, Wang X N, Hao L, et al., 2024. Multi-time scale analysis of net ecosystem productivity pattern in Inner Mongolia from 2001 to 2020[J]. Ecology and Environmental Sciences, 33(2): 167-179. | |
| [44] | 张继, 范莉, 陈艳英, 等, 2024. 基于FY4A静止卫星的植被NPP估算及时空分布--以多云雨山区重庆市为例[J]. 遥感信息, 39(4): 115-124. |
| Zhang J, Fan L, Chen Y Y, et al., 2024. Estimation and spatiotemporal distribution of vegetation NPP based on FY4A geostationary satellite - a case study in Chongqing in the cloudy and rainy mountainous region in Southwest China[J]. Remote Sensing Information, 39(4): 115-124. | |
| [45] |
张继, 杨世琦, 赵磊, 等, 2025. 基于InVEST模型的重庆市 “一带三屏” 生境质量时空演变特征分析[J]. 生态环境学报, 34(2): 167-180.
DOI |
| Zhang J, Yang S Q, Zhao L, et al., 2025. Spatiotemporal evolution characteristics of habitat quality in the One Belt and Three Barriers region of Chongqing city based on the InVEST model[J]. Ecology and Environmental Sciences, 34(2): 167-180. | |
| [46] |
张俊兵, 沈润平, 师春香, 等, 2021. 中国大陆地区ERA5下行短波辐射数据适用性评估与对比[J]. 地球信息科学学报, 23(12): 2261-2274.
DOI |
| Zhang J B, Shen R P, Shi C X, et al., 2021. Evaluation and comparison of downward solar radiation from new generation atmospheric reanalysis ERA5 across mainland China[J]. Journal of Geo-information Science, 23(12): 2261-2274. | |
| [47] | 张信伟, 王丽霞, 杨耘, 等, 2026. 渭河流域碳源/碳汇时空格局演变及多因子驱动机制分析[J]. 环境科学, 47(5): 3155-3165. |
| Zhang X W, Wang L X, Yang Y, et al., 2026. Spatiotemporal evolution of carbon sources/sinks and analysis of multi-factor driving mechanisms in the Weihe River Basin[J]. Environmental Science, 47(5): 3155-3165. | |
| [48] | 赵乾佐, 张璇, 费俊源, 等, 2024. 长江流域不同植被对2022年极端气象干旱事件的响应[J]. 中国环境科学, 44(9): 5134-5144. |
| Zhao Q Z, Zhang X, Fei J Y, et al., 2024. Vegetation responses to extreme meteorological drought event of 2022 in the Yangtze River Basin[J]. China Environmental Science, 44(9): 5134-5144. | |
| [49] | 周启刚, 陈丹, 2013. 重庆山地都市区土地利用地形特征分异研究[J]. 水土保持研究, 20(3): 86-91. |
| Zhou Q G, Chen D, 2013. Research on the topographic differentiation of land use in the Chongqing mountainous metropolitan area[J]. Research of Soil and Water Conservation, 20(3): 86-91. | |
| [50] | 朱文泉, 潘耀忠, 何浩, 等, 2006. 中国典型植被最大光利用率模拟[J]. 科学通报, 51(6): 700-706. |
| Zhu W Q, Pan Y Z, He H, et al., 2006. Modeling the maximum light use efficiency of typical vegetation in China[J]. Chinese Science Bulletin, 51(6): 700-706. | |
| [51] |
朱文泉, 潘耀忠, 张锦水, 2007. 中国陆地植被净初级生产力遥感估算[J]. 植物生态学报, 31(3): 413-424.
DOI |
|
Zhu W Q, Pan Y Z, Zhang J S, 2007. Estimation of net primary productivity of Chinese terrestrial vegetation based on remote sensing[J]. Chinese Journal of Plant Ecology, 31(3): 413-424.
DOI URL |
|
| [52] | 庄贵阳, 陈寅岚, 2024. “双碳” 视域下的生态安全与风险防范[J]. 贵州社会科学, 413(5): 112-118. |
| Zhuang G Y, Chen Y L, 2024. Ecological security and risk prevention in the context of “Dual Carbon” goals[J]. Guizhou Social Sciences, 413(5): 112-118. | |
| [53] | 邹滨, 谢曼曼, 李莎, 等, 2025. 中国274个地级市PM2.5-O3浓度空间分异的驱动因素解析[J]. 中国环境科学, 45(11): 6032-6044. |
| Zou B, Xie M M, Li S, et al., 2025. Exploring the drivers of PM2.5-O3 spatial differentiation in 274 Chinese prefecture-level cities[J]. China Environmental Science, 45(11): 6032-6044. |
| [1] | 曹云, 程春香, 陈紫璇, 博宇, 孙应龙, 于敏. 东北林区固碳能力时空分异特征及其气候驱动研究[J]. 生态环境学报, 2026, 35(9): 1329-1341. |
| [2] | 徐玉静, 杨昊, 于泓, 柴钰莹. 珠江三角洲海岸带蓝碳储量时空演变特征及驱动因素分析[J]. 生态环境学报, 2026, 35(8): 1163-1175. |
| [3] | 张涛, 杨慧, 曹建华, 周孟霞, 康志强. 基于岩性分区的广西植被净生态系统生产力时空演变特征研究[J]. 生态环境学报, 2026, 35(5): 702-713. |
| [4] | 石洪飞, 侯光良, 曹明珠, 关佳萌, 何家豪, 唐中华, 马曙光. 基于InVEST模型的三江源黄河流域水源涵养时空演变与驱动机制[J]. 生态环境学报, 2026, 35(5): 793-804. |
| [5] | 杜嘉睿, 宋芊, 高文明. 黄河源区生态系统健康时空演变与多情景模拟研究[J]. 生态环境学报, 2026, 35(4): 551-562. |
| [6] | 付智华, 张捍卫, 王晶. 山东省矿区多维度土地利用转型对生态系统服务的空间异质驱动效应[J]. 生态环境学报, 2026, 35(4): 563-574. |
| [7] | 王秀玲, 金翠, 王浩然, 候明璇. 辽宁省植被时空变化特征及其对极端气候的响应[J]. 生态环境学报, 2025, 34(9): 1410-1420. |
| [8] | 丁馨, 刘健, 魏俐宏, 解德威, 郑昭佩. 基于GSMSR模型的山东省植被NEP时空格局及影响因素[J]. 生态环境学报, 2025, 34(7): 1079-1089. |
| [9] | 石镕瑞, 杨小雄, 马骥, 黄珊珊, 杨玥, 卢盛权, 吴广. 滇桂黔石漠化片区生态环境质量时空演变及驱动力分析[J]. 生态环境学报, 2025, 34(7): 1147-1162. |
| [10] | 王天雯, 罗明良, 白雷超. 嘉陵江流域生态系统服务动态变化及权衡协同分析[J]. 生态环境学报, 2025, 34(6): 888-901. |
| [11] | 杨昊彧, 黄康江, 陈晓东, 赵劼, 熊军, 田康. 贵州省生态空间效率演变及景观格局的影响归因[J]. 生态环境学报, 2025, 34(6): 902-913. |
| [12] | 吴雨桐, 於冉, 余祺琪, 王成, 张紫涵. 皖江流域生境质量评价及多情景优化研究[J]. 生态环境学报, 2025, 34(6): 961-973. |
| [13] | 赵志轩, 魏芳菲, 吴皓天, 王怡宁, 王澎喆. 澜沧江-湄公河流域生态系统服务价值对土地利用变化的响应[J]. 生态环境学报, 2025, 34(5): 688-698. |
| [14] | 冯义龙, 贺萌, 李波, 雷界, 艾丽皎. 重庆主城区城市生态网络构建与优化[J]. 生态环境学报, 2025, 34(5): 699-709. |
| [15] | 张洪波, 尹班, 李春勇, 崔松云, 和艳, 李小红, 邓丽仙. 近40年红河流域(中国部分)水源涵养功能动态演变特征及驱动因素[J]. 生态环境学报, 2025, 34(4): 556-569. |
| 阅读次数 | ||||||
|
全文 |
|
|||||
|
摘要 |
|
|||||
