生态环境学报 ›› 2026, Vol. 35 ›› Issue (5): 665-678.DOI: 10.16258/j.cnki.1674-5906.2026.05.001
• 碳循环与碳减排专栏 •
下一篇
安敏1,2( ), 曾可英子1,2, 韦雅倩3,*(), 王珊珊1,2
收稿日期:2025-09-11
修回日期:2026-03-10
接受日期:2026-03-25
出版日期:2026-05-18
发布日期:2026-05-08
通讯作者:
*E-mail: 作者简介:安敏(1991年生),女,副教授,博士,研究方向为资源环境管理。E-mail: anmin@ctgu.edu.cn
基金资助:
AN Min1,2(), ZENG Keyingzi1,2, WEI Yaqian3,*(), WANG Shanshan1,2
Received:2025-09-11
Revised:2026-03-10
Accepted:2026-03-25
Online:2026-05-18
Published:2026-05-08
摘要:
碳排放的持续增加所引起的温室效应提高了极端气候事件的发生概率,而极端气候也可能反过来影响碳排放的强度和速率。该文基于20 km×20 km的格网,收集中国2002-2022年的碳排放量、逐日气温、降水量等数据,探究极端气候与碳排放的时空演变规律,最后利用ArcGIS的空间分析功能完成二者之间相关系数的测算。结果表明,1)研究期间,中国碳排放年均增长率达4.99%,但2018年起增长率降至1.56%,碳排放空间分布以大型城市为中心向外辐射;其格网分布以胡焕庸线为界呈明显分区,以东的格网集中于[1, 10)万吨的区间,以西则集中[0, 1)万吨区间。2)极端气候指数变化主要表现为极端气温与极端降水的持续时间缩短;极端气温与极端降水的频率与强度显著增加;综合来看,多地的极端气候事件发生的频次与强度明显上升、持续的时间缩短,极端气候逐渐趋于常态化。3)中国极端气候频率指数与碳排放的正相关性最为突出,仅香港为负相关;而极端降水持续时间指数与碳排放的负相关性最强,仅新疆、香港为正相关;极端降水频率和强度指数与碳排放的相关性在不同省市差异显著,在湖南、江西等地都呈强负相关,而在新疆、内蒙古等省则为强正相关。该研究基于格网尺度识别了中国极端气候与碳排放之间的相关格局及区域差异特征,可为理解二者的区域关联及制定差异化减排政策提供参考。
中图分类号:
安敏, 曾可英子, 韦雅倩, 王珊珊. 极端气候与碳排放的时空演变特征及相关关系分析[J]. 生态环境学报, 2026, 35(5): 665-678.
AN Min, ZENG Keyingzi, WEI Yaqian, WANG Shanshan. Analysis of the Spatiotemporal Evolution Characteristics and Correlation of Extreme Climate and Carbon Emissions[J]. Ecology and Environmental Sciences, 2026, 35(5): 665-678.
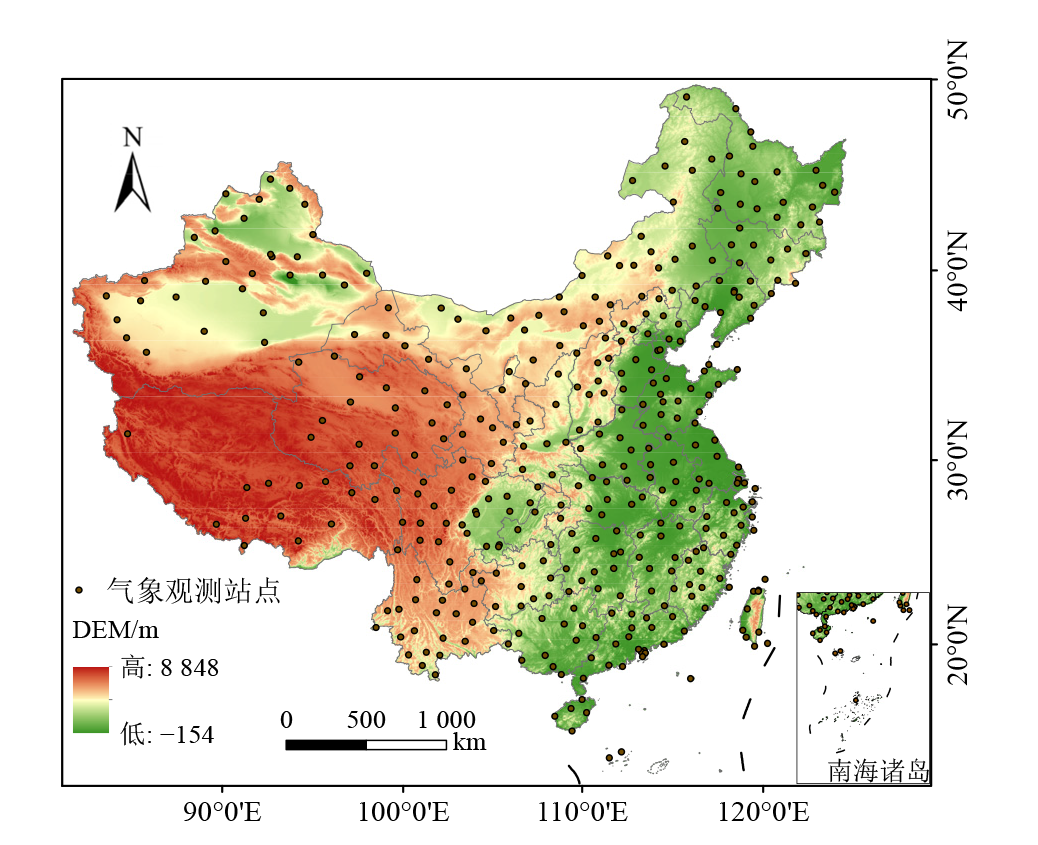
图1 气候观测站点分布图 该图基于中华人民共和国自然资源部国家地理信息公共服务平台行政区划可视化网站下载的审图号为GS(2024)0650的标准地图制作,底图无修改。全文同
Figure 1 Distribution map of climate observation stations
| 类别 | 代码 | 名称 | 定义 | 单位 |
|---|---|---|---|---|
| 极端气温频率指数 | Tx90p | 暖昼日数 | 日最高气温>90%分位值的日数 | d |
| Tn90p | 暖夜日数 | 日最低气温>90%分位值的日数 | d | |
| Tx10p | 冷昼日数 | 日最高气温<10%分位值的日数 | d | |
| Tn10p | 冷夜日数 | 日最低气温<10%分位值的日数 | d | |
| 极端气温强度指数 | TNn | 日最低气温极小值 | 每月内日最低气温的最小值 | ℃ |
| TXn | 日最高气温极小值 | 每月内日最高气温的最小值 | ℃ | |
| TNx | 日最低气温极大值 | 每月内日最低气温的最大值 | ℃ | |
| TXx | 日最高气温极大值 | 每月内日最高气温的最大值 | ℃ | |
| DTR | 气温日较差 | 年内日最高气温与最低气温的差值 | ℃ | |
| 极端气温持续时间指数 | GSL | 生长季长度 | 日平均气温第1次连续6 d以上大于5 ℃至日平均气温第1次(6月1日后)连续6 d小于5 ℃的日数 | d |
| 极端降水频率指数 | R10 | 中雨日数 | 每年内日降水量>10 mm的总日数 | d |
| R20 | 大雨日数 | 每年内日降水量>20 mm的总日数 | d | |
| R25 | 暴雨日数 | 每年内日降水量>25 mm的总日数 | d | |
| 极端降水强度指数 | Rx1day | 1日最大降水量 | 每月最大1日降水量 | mm |
| Rx5day | 5日最大降水量 | 每月连续5日最大降水量 | mm | |
| PRCPTOT | 雨日降水总量 | 雨日(日降水量≥1 mm)降水总量 | mm | |
| 极端降水持续时间指数 | CDD | 持续干燥日数 | 日降水量<1 mm的最长连续日数 | d |
| CWD | 持续湿润日数 | 日降水量≥1 mm的最长连续日数 | d |
表1 极端气候指数以及定义
Table 1 Extreme climate indices and definitions
| 类别 | 代码 | 名称 | 定义 | 单位 |
|---|---|---|---|---|
| 极端气温频率指数 | Tx90p | 暖昼日数 | 日最高气温>90%分位值的日数 | d |
| Tn90p | 暖夜日数 | 日最低气温>90%分位值的日数 | d | |
| Tx10p | 冷昼日数 | 日最高气温<10%分位值的日数 | d | |
| Tn10p | 冷夜日数 | 日最低气温<10%分位值的日数 | d | |
| 极端气温强度指数 | TNn | 日最低气温极小值 | 每月内日最低气温的最小值 | ℃ |
| TXn | 日最高气温极小值 | 每月内日最高气温的最小值 | ℃ | |
| TNx | 日最低气温极大值 | 每月内日最低气温的最大值 | ℃ | |
| TXx | 日最高气温极大值 | 每月内日最高气温的最大值 | ℃ | |
| DTR | 气温日较差 | 年内日最高气温与最低气温的差值 | ℃ | |
| 极端气温持续时间指数 | GSL | 生长季长度 | 日平均气温第1次连续6 d以上大于5 ℃至日平均气温第1次(6月1日后)连续6 d小于5 ℃的日数 | d |
| 极端降水频率指数 | R10 | 中雨日数 | 每年内日降水量>10 mm的总日数 | d |
| R20 | 大雨日数 | 每年内日降水量>20 mm的总日数 | d | |
| R25 | 暴雨日数 | 每年内日降水量>25 mm的总日数 | d | |
| 极端降水强度指数 | Rx1day | 1日最大降水量 | 每月最大1日降水量 | mm |
| Rx5day | 5日最大降水量 | 每月连续5日最大降水量 | mm | |
| PRCPTOT | 雨日降水总量 | 雨日(日降水量≥1 mm)降水总量 | mm | |
| 极端降水持续时间指数 | CDD | 持续干燥日数 | 日降水量<1 mm的最长连续日数 | d |
| CWD | 持续湿润日数 | 日降水量≥1 mm的最长连续日数 | d |
| 类别 | 名称 | 权重/% | 类别 | 名称 | 权重/% |
|---|---|---|---|---|---|
| 极端降水持续时间指数 | CDD | 63.800 | 极端气温持续时间指数 | GSL | 100.00 |
| CWD | 36.200 | ||||
| 极端降水 频率指数 | R10mm | 43.855 | 极端气温 频率指数 | TX90p | 19.486 |
| R20mm | 21.482 | TN90p | 32.937 | ||
| R25mm | 34.663 | TX10p | 19.161 | ||
| TN90p | 28.416 | ||||
| 极端降水 强度指数 | RX1day | 26.661 | 极端气温 强度指数 | TXn | 18.694 |
| RX5day | 22.787 | TNn | 18.217 | ||
| PRCPTOT | 50.552 | TNx | 27.185 | ||
| TXx | 17.056 | ||||
| DTR | 18.848 |
表2 极端气候指标权重
Table 2 Weights of extreme climate indices
| 类别 | 名称 | 权重/% | 类别 | 名称 | 权重/% |
|---|---|---|---|---|---|
| 极端降水持续时间指数 | CDD | 63.800 | 极端气温持续时间指数 | GSL | 100.00 |
| CWD | 36.200 | ||||
| 极端降水 频率指数 | R10mm | 43.855 | 极端气温 频率指数 | TX90p | 19.486 |
| R20mm | 21.482 | TN90p | 32.937 | ||
| R25mm | 34.663 | TX10p | 19.161 | ||
| TN90p | 28.416 | ||||
| 极端降水 强度指数 | RX1day | 26.661 | 极端气温 强度指数 | TXn | 18.694 |
| RX5day | 22.787 | TNn | 18.217 | ||
| PRCPTOT | 50.552 | TNx | 27.185 | ||
| TXx | 17.056 | ||||
| DTR | 18.848 |
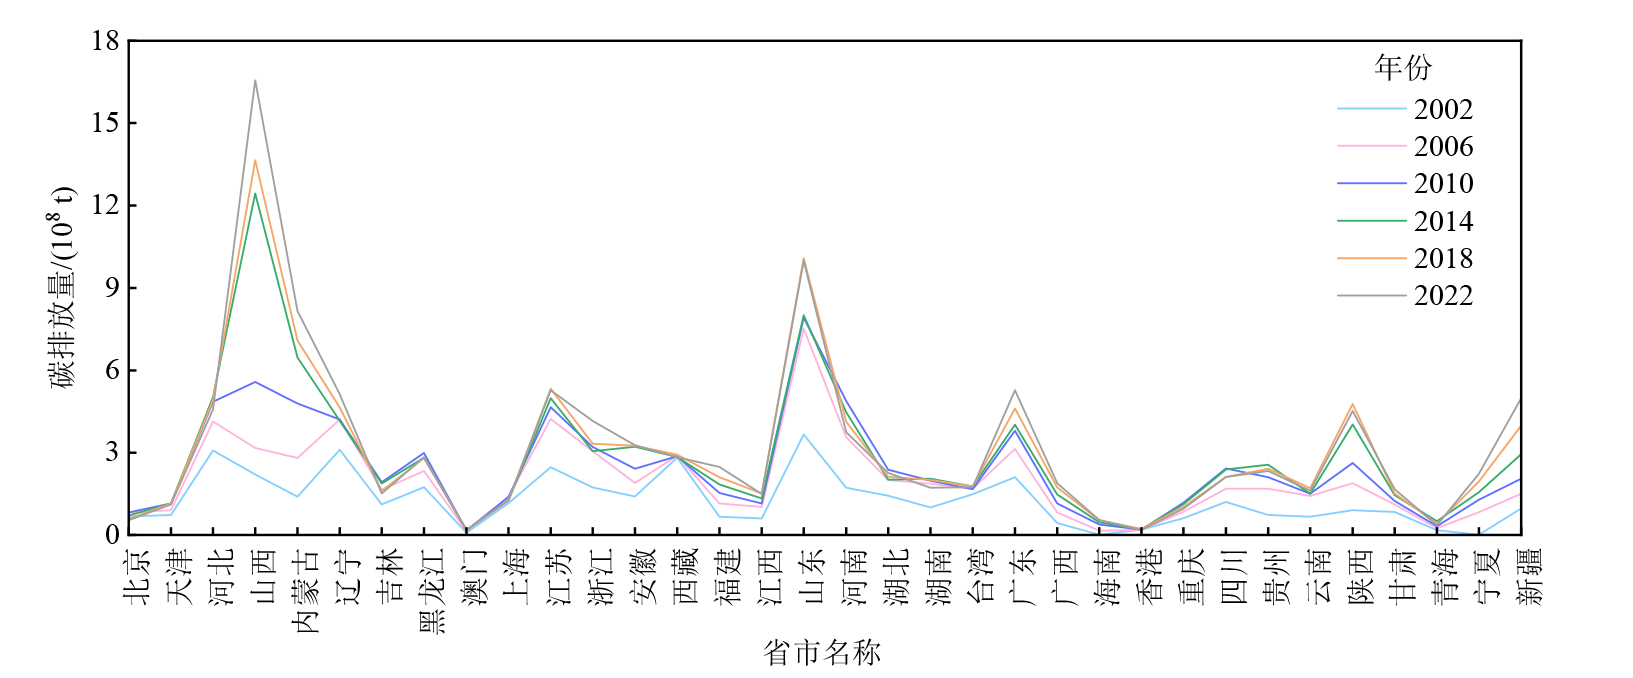
图2 各省市不同时期碳排放量
Figure 2 Carbon emissions by province and region in different periods
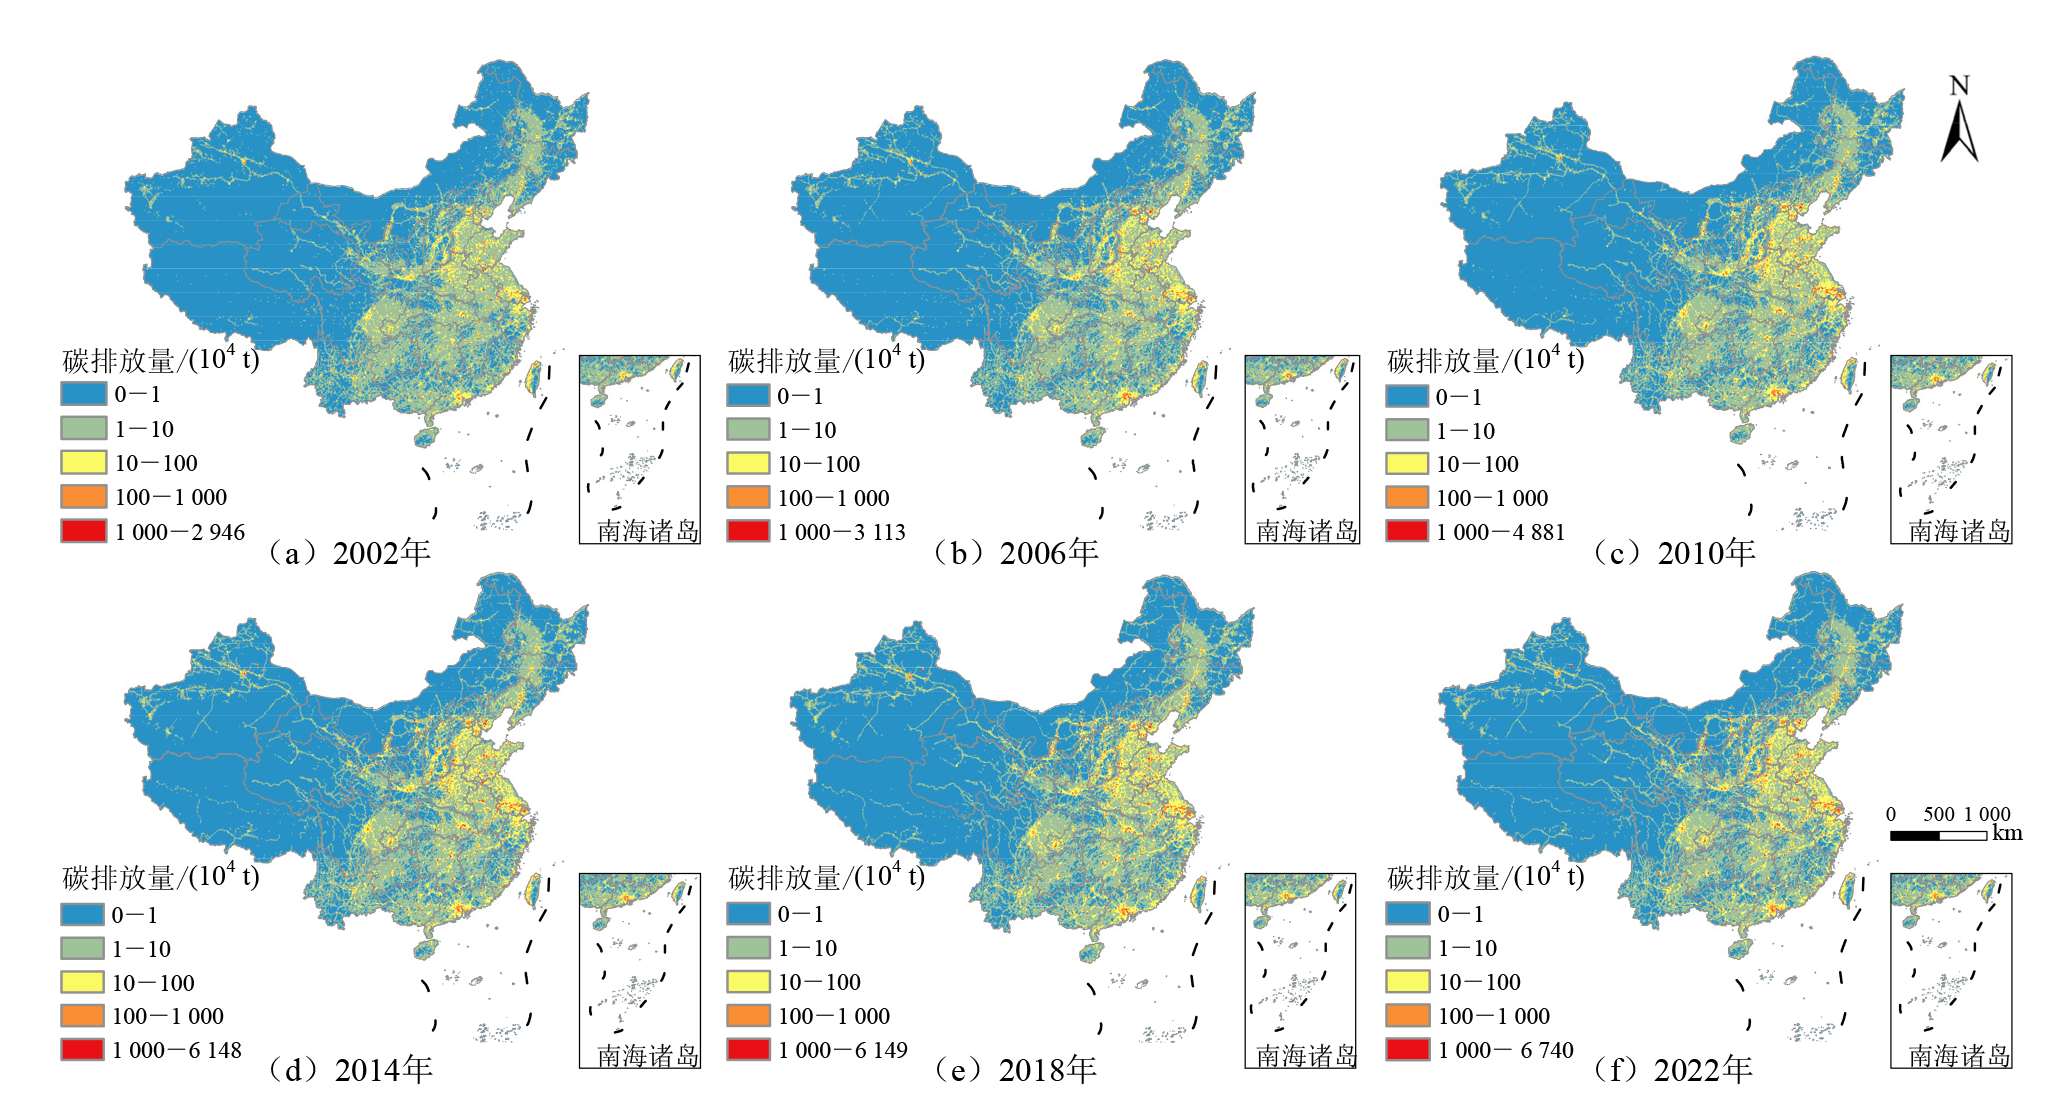
图3 2002-2022年碳排放量的时空分布
Figure 3 Spatiotemporal distribution of carbon emissions from 2002 to 2022
| 年份 | 各区间的格网面积占比/% | ||||
|---|---|---|---|---|---|
| [0, 1) | [1, 10) | [10, 100) | [100, 1000) | [1000, +∞) | |
| 2002年 | 67.27 | 27.78 | 4.17 | 0.72 | 0.06 |
| 2006年 | 64.79 | 28.60 | 5.48 | 1.00 | 0.13 |
| 2010年 | 64.42 | 28.29 | 5.93 | 1.17 | 0.19 |
| 2014年 | 63.15 | 29.10 | 6.27 | 1.22 | 0.25 |
| 2018年 | 62.68 | 29.07 | 6.69 | 1.30 | 0.26 |
| 2022年 | 63.06 | 28.81 | 6.49 | 1.35 | 0.29 |
表3 各排放区间的格网面积占比
Table 3 Proportion of grid area in each emission interval
| 年份 | 各区间的格网面积占比/% | ||||
|---|---|---|---|---|---|
| [0, 1) | [1, 10) | [10, 100) | [100, 1000) | [1000, +∞) | |
| 2002年 | 67.27 | 27.78 | 4.17 | 0.72 | 0.06 |
| 2006年 | 64.79 | 28.60 | 5.48 | 1.00 | 0.13 |
| 2010年 | 64.42 | 28.29 | 5.93 | 1.17 | 0.19 |
| 2014年 | 63.15 | 29.10 | 6.27 | 1.22 | 0.25 |
| 2018年 | 62.68 | 29.07 | 6.69 | 1.30 | 0.26 |
| 2022年 | 63.06 | 28.81 | 6.49 | 1.35 | 0.29 |
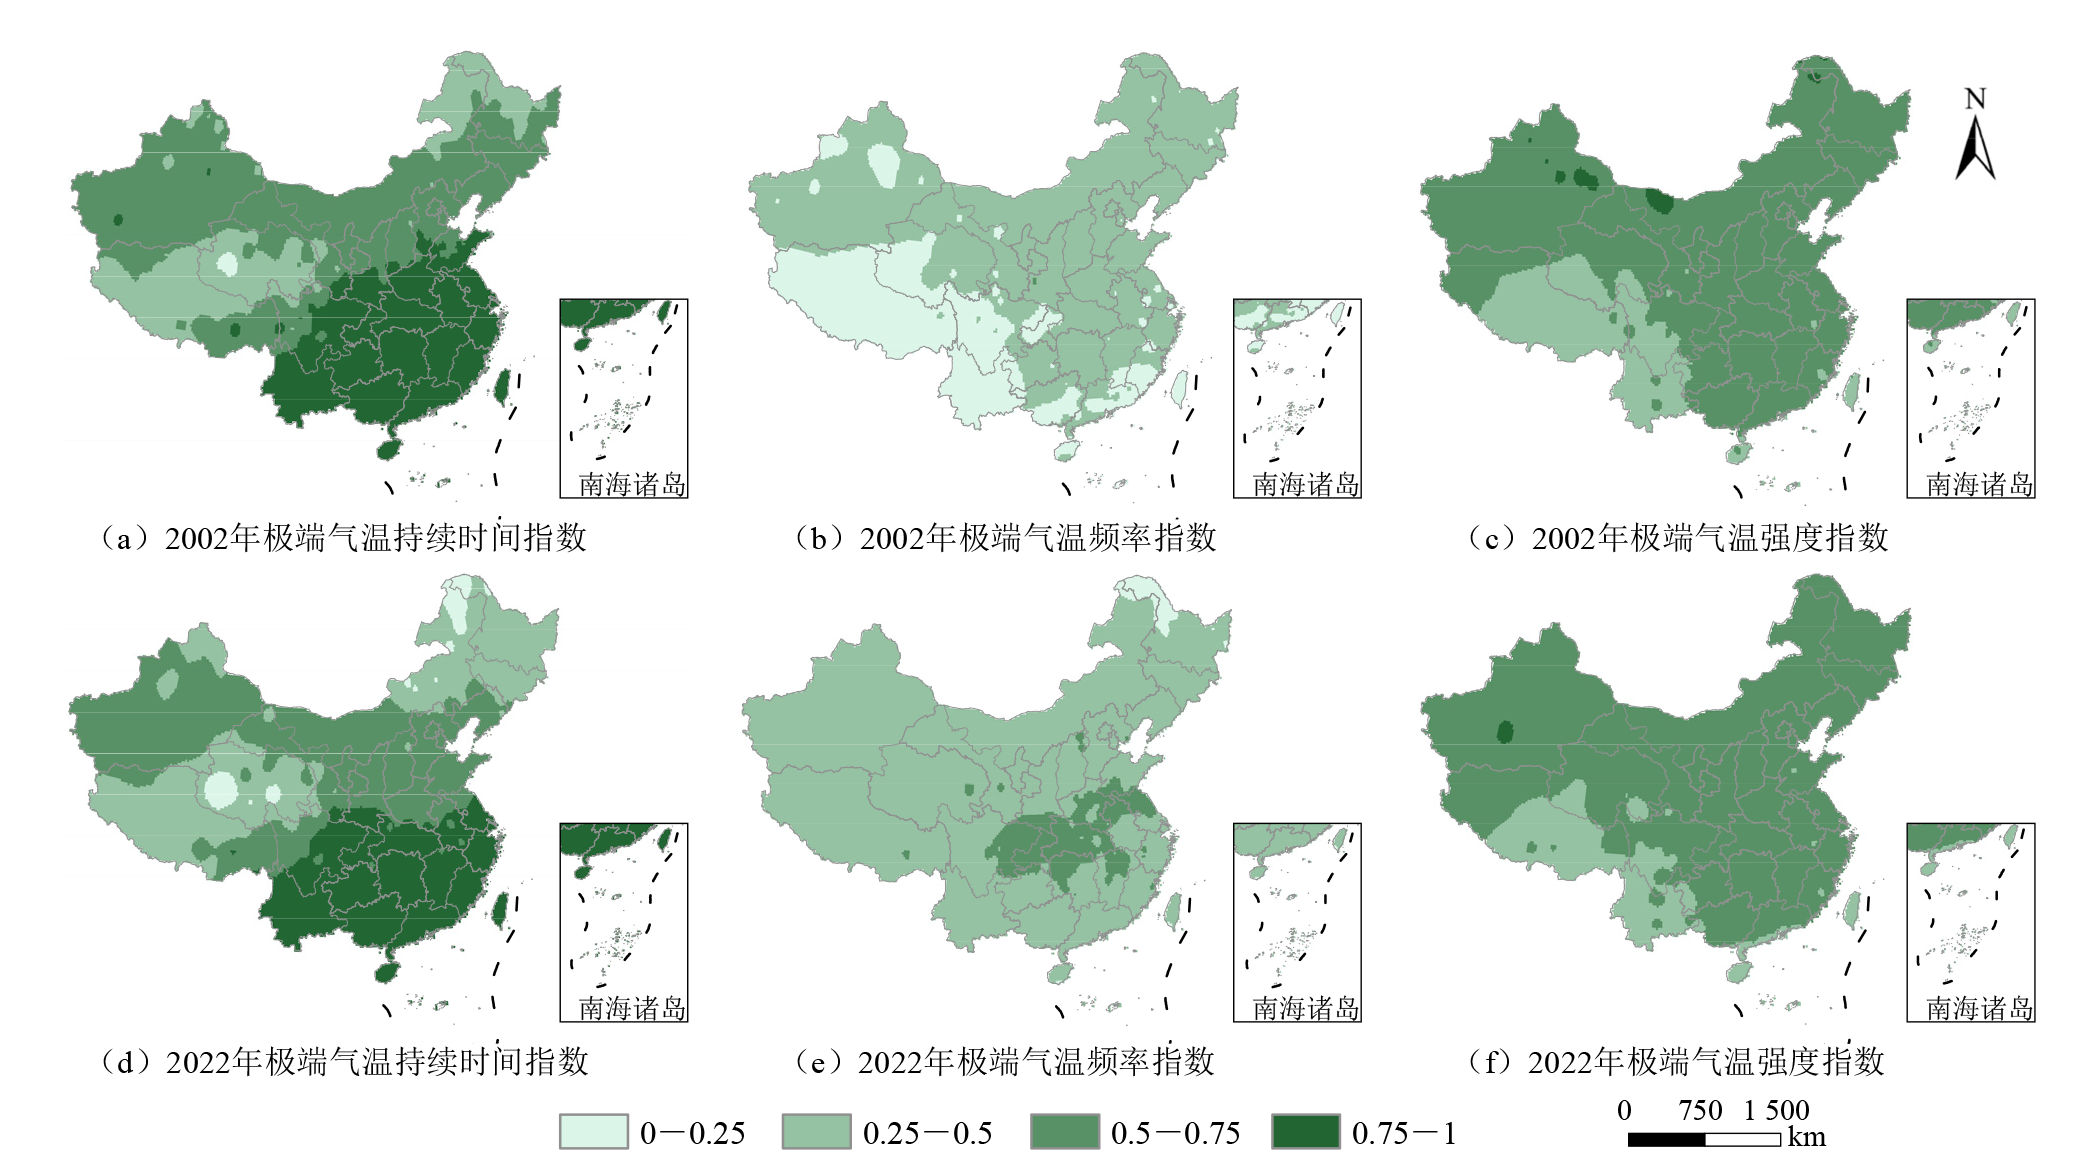
图4 极端气温指数的时空分布
Figure 4 Spatiotemporal distribution of extreme temperature indices
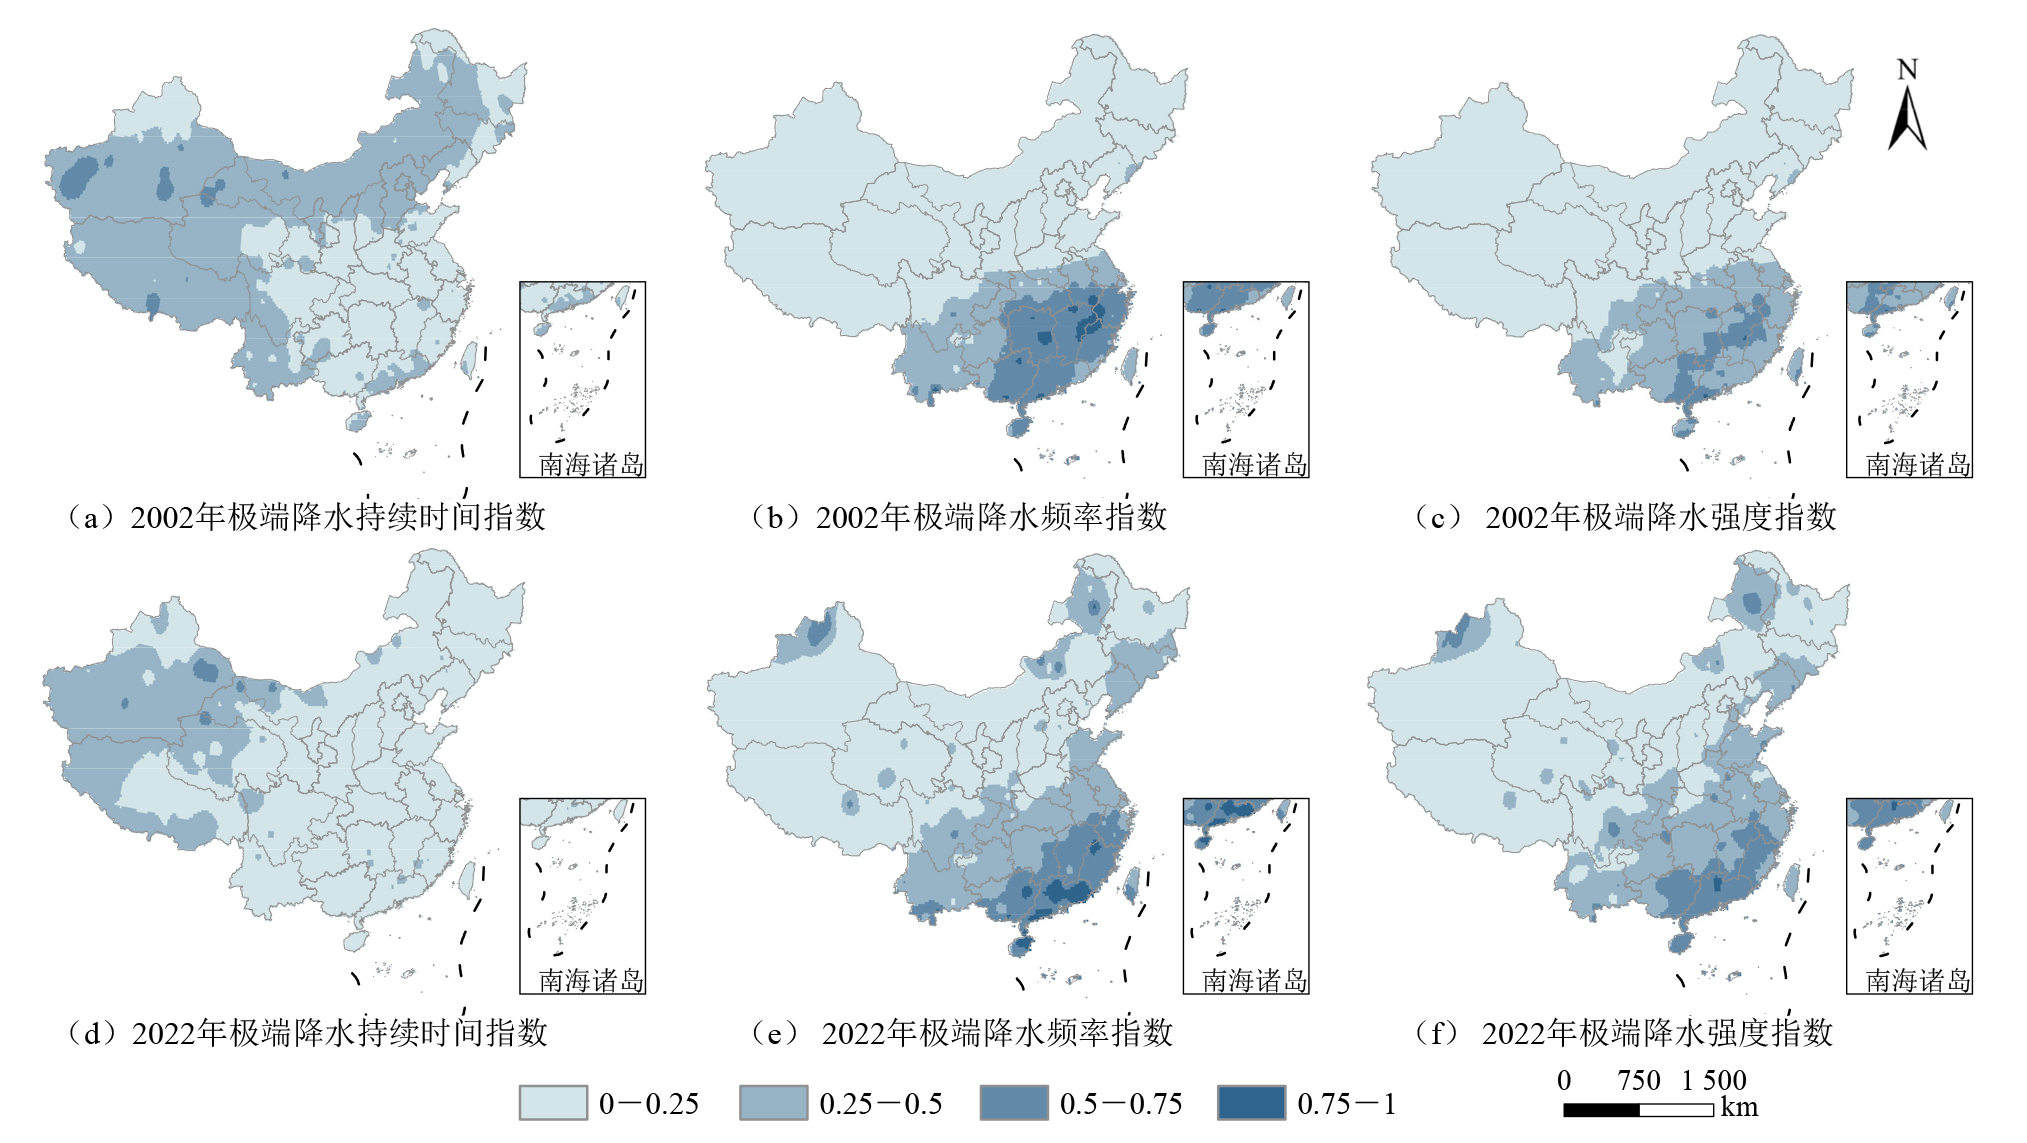
图5 极端降水指数的时空分布
Figure 5 Spatiotemporal distribution of extreme precipitation indices
| 气温指数及年份 | 各气温指数区间的格网面积占比/% | |||
|---|---|---|---|---|
| 区间 | ||||
| 0-0.25 (低) | 0.25-0.5 (较低) | 0.5-0.75 (较高) | 0.75-1 (高) | |
| 气温持续2002年 | 0.41 | 20.43 | 51.34 | 27.82 |
| 气温持续2022年 | 2.95 | 31.69 | 42.80 | 22.56 |
| 气温频率2002年 | 27.87 | 71.99 | 0.03 | 0 |
| 气温频率2022年 | 1.84 | 88.82 | 9.34 | 0 |
| 气温强度2002年 | 0 | 16.71 | 82.05 | 1.24 |
| 气温强度2022年 | 0 | 12.61 | 87.07 | 0.32 |
表4 各气温指数区间的格网面积占比
Table 4 Proportion of grid area in each temperature index interval
| 气温指数及年份 | 各气温指数区间的格网面积占比/% | |||
|---|---|---|---|---|
| 区间 | ||||
| 0-0.25 (低) | 0.25-0.5 (较低) | 0.5-0.75 (较高) | 0.75-1 (高) | |
| 气温持续2002年 | 0.41 | 20.43 | 51.34 | 27.82 |
| 气温持续2022年 | 2.95 | 31.69 | 42.80 | 22.56 |
| 气温频率2002年 | 27.87 | 71.99 | 0.03 | 0 |
| 气温频率2022年 | 1.84 | 88.82 | 9.34 | 0 |
| 气温强度2002年 | 0 | 16.71 | 82.05 | 1.24 |
| 气温强度2022年 | 0 | 12.61 | 87.07 | 0.32 |
| 降水指数及年份 | 各降水指数区间的格网面积占比/% | |||
|---|---|---|---|---|
| 区间 | ||||
| 0-0.25 (低) | 0.25-0.5 (较低) | 0.5-0.75 (较高) | 0.75-1 (高) | |
| 降水持续2002年 | 36.86 | 60.69 | 2.45 | 0 |
| 降水持续2022年 | 71.20 | 27.95 | 0.85 | 0 |
| 降水频率2002年 | 77.45 | 11.74 | 9.86 | 0.94 |
| 降水频率2022年 | 65.06 | 26.29 | 7.51 | 1.14 |
| 降水强度2002年 | 80.06 | 16.42 | 3.50 | 0.03 |
| 降水强度2022年 | 68.10 | 28.84 | 2.97 | 0.10 |
表5 各降水指数区间的格网面积占比
Table 5 Proportion of grid area in each precipitation index interval
| 降水指数及年份 | 各降水指数区间的格网面积占比/% | |||
|---|---|---|---|---|
| 区间 | ||||
| 0-0.25 (低) | 0.25-0.5 (较低) | 0.5-0.75 (较高) | 0.75-1 (高) | |
| 降水持续2002年 | 36.86 | 60.69 | 2.45 | 0 |
| 降水持续2022年 | 71.20 | 27.95 | 0.85 | 0 |
| 降水频率2002年 | 77.45 | 11.74 | 9.86 | 0.94 |
| 降水频率2022年 | 65.06 | 26.29 | 7.51 | 1.14 |
| 降水强度2002年 | 80.06 | 16.42 | 3.50 | 0.03 |
| 降水强度2022年 | 68.10 | 28.84 | 2.97 | 0.10 |
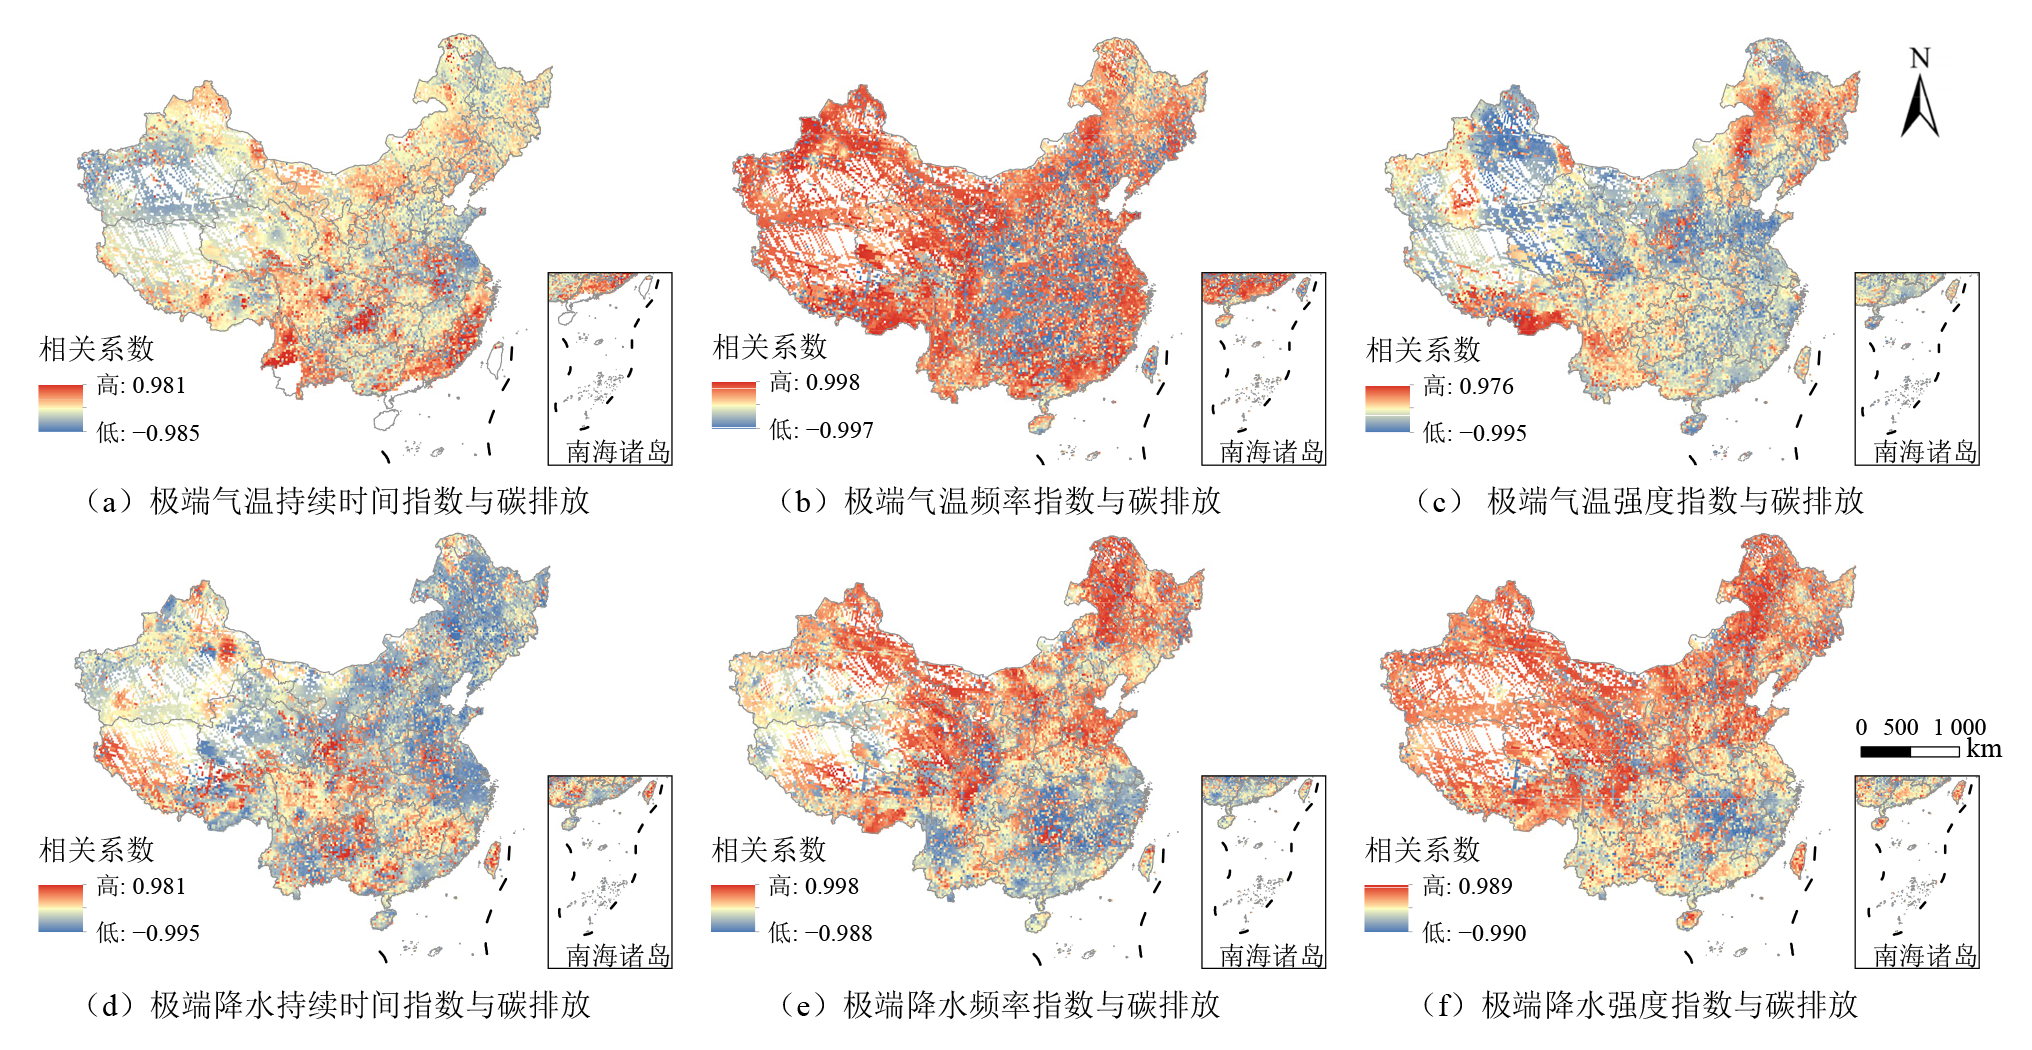
图6 极端气候指数与碳排放的相关系数
Figure 6 Correlation coefficients between carbon emissions and extreme climate indices
| 气候指数 | 碳排放与指数不同相关系数区间的格网面积占比/% | |||||
|---|---|---|---|---|---|---|
| 区间 | ||||||
| −1-−0.6 (强负 相关) | −0.6-−0.3 (中度负 相关) | −0.3-0 (弱负 相关) | 0-0.3 (弱正 相关) | 0.3-0.6 (中度正相关) | 0.6-1 (强正 相关) | |
| 气温持续 | 10.52 | 29.68 | 33.85 | 18.40 | 6.07 | 1.48 |
| 气温频率 | 13.60 | 6.36 | 5.90 | 7.97 | 22.39 | 43.78 |
| 气温强度 | 18.51 | 26.72 | 24.52 | 16.55 | 10.49 | 3.21 |
| 降水持续 | 18.58 | 29.29 | 21.32 | 14.71 | 10.55 | 5.56 |
| 降水频率 | 9.33 | 13.73 | 15.85 | 17.30 | 22.19 | 21.61 |
| 降水强度 | 5.56 | 9.89 | 11.59 | 15.17 | 28.65 | 29.15 |
表6 碳排放与指数不同相关系数区间的格网面积占比
Table 6 Proportion of grid area in different correlation coefficient intervals of indices and carbon emissions
| 气候指数 | 碳排放与指数不同相关系数区间的格网面积占比/% | |||||
|---|---|---|---|---|---|---|
| 区间 | ||||||
| −1-−0.6 (强负 相关) | −0.6-−0.3 (中度负 相关) | −0.3-0 (弱负 相关) | 0-0.3 (弱正 相关) | 0.3-0.6 (中度正相关) | 0.6-1 (强正 相关) | |
| 气温持续 | 10.52 | 29.68 | 33.85 | 18.40 | 6.07 | 1.48 |
| 气温频率 | 13.60 | 6.36 | 5.90 | 7.97 | 22.39 | 43.78 |
| 气温强度 | 18.51 | 26.72 | 24.52 | 16.55 | 10.49 | 3.21 |
| 降水持续 | 18.58 | 29.29 | 21.32 | 14.71 | 10.55 | 5.56 |
| 降水频率 | 9.33 | 13.73 | 15.85 | 17.30 | 22.19 | 21.61 |
| 降水强度 | 5.56 | 9.89 | 11.59 | 15.17 | 28.65 | 29.15 |
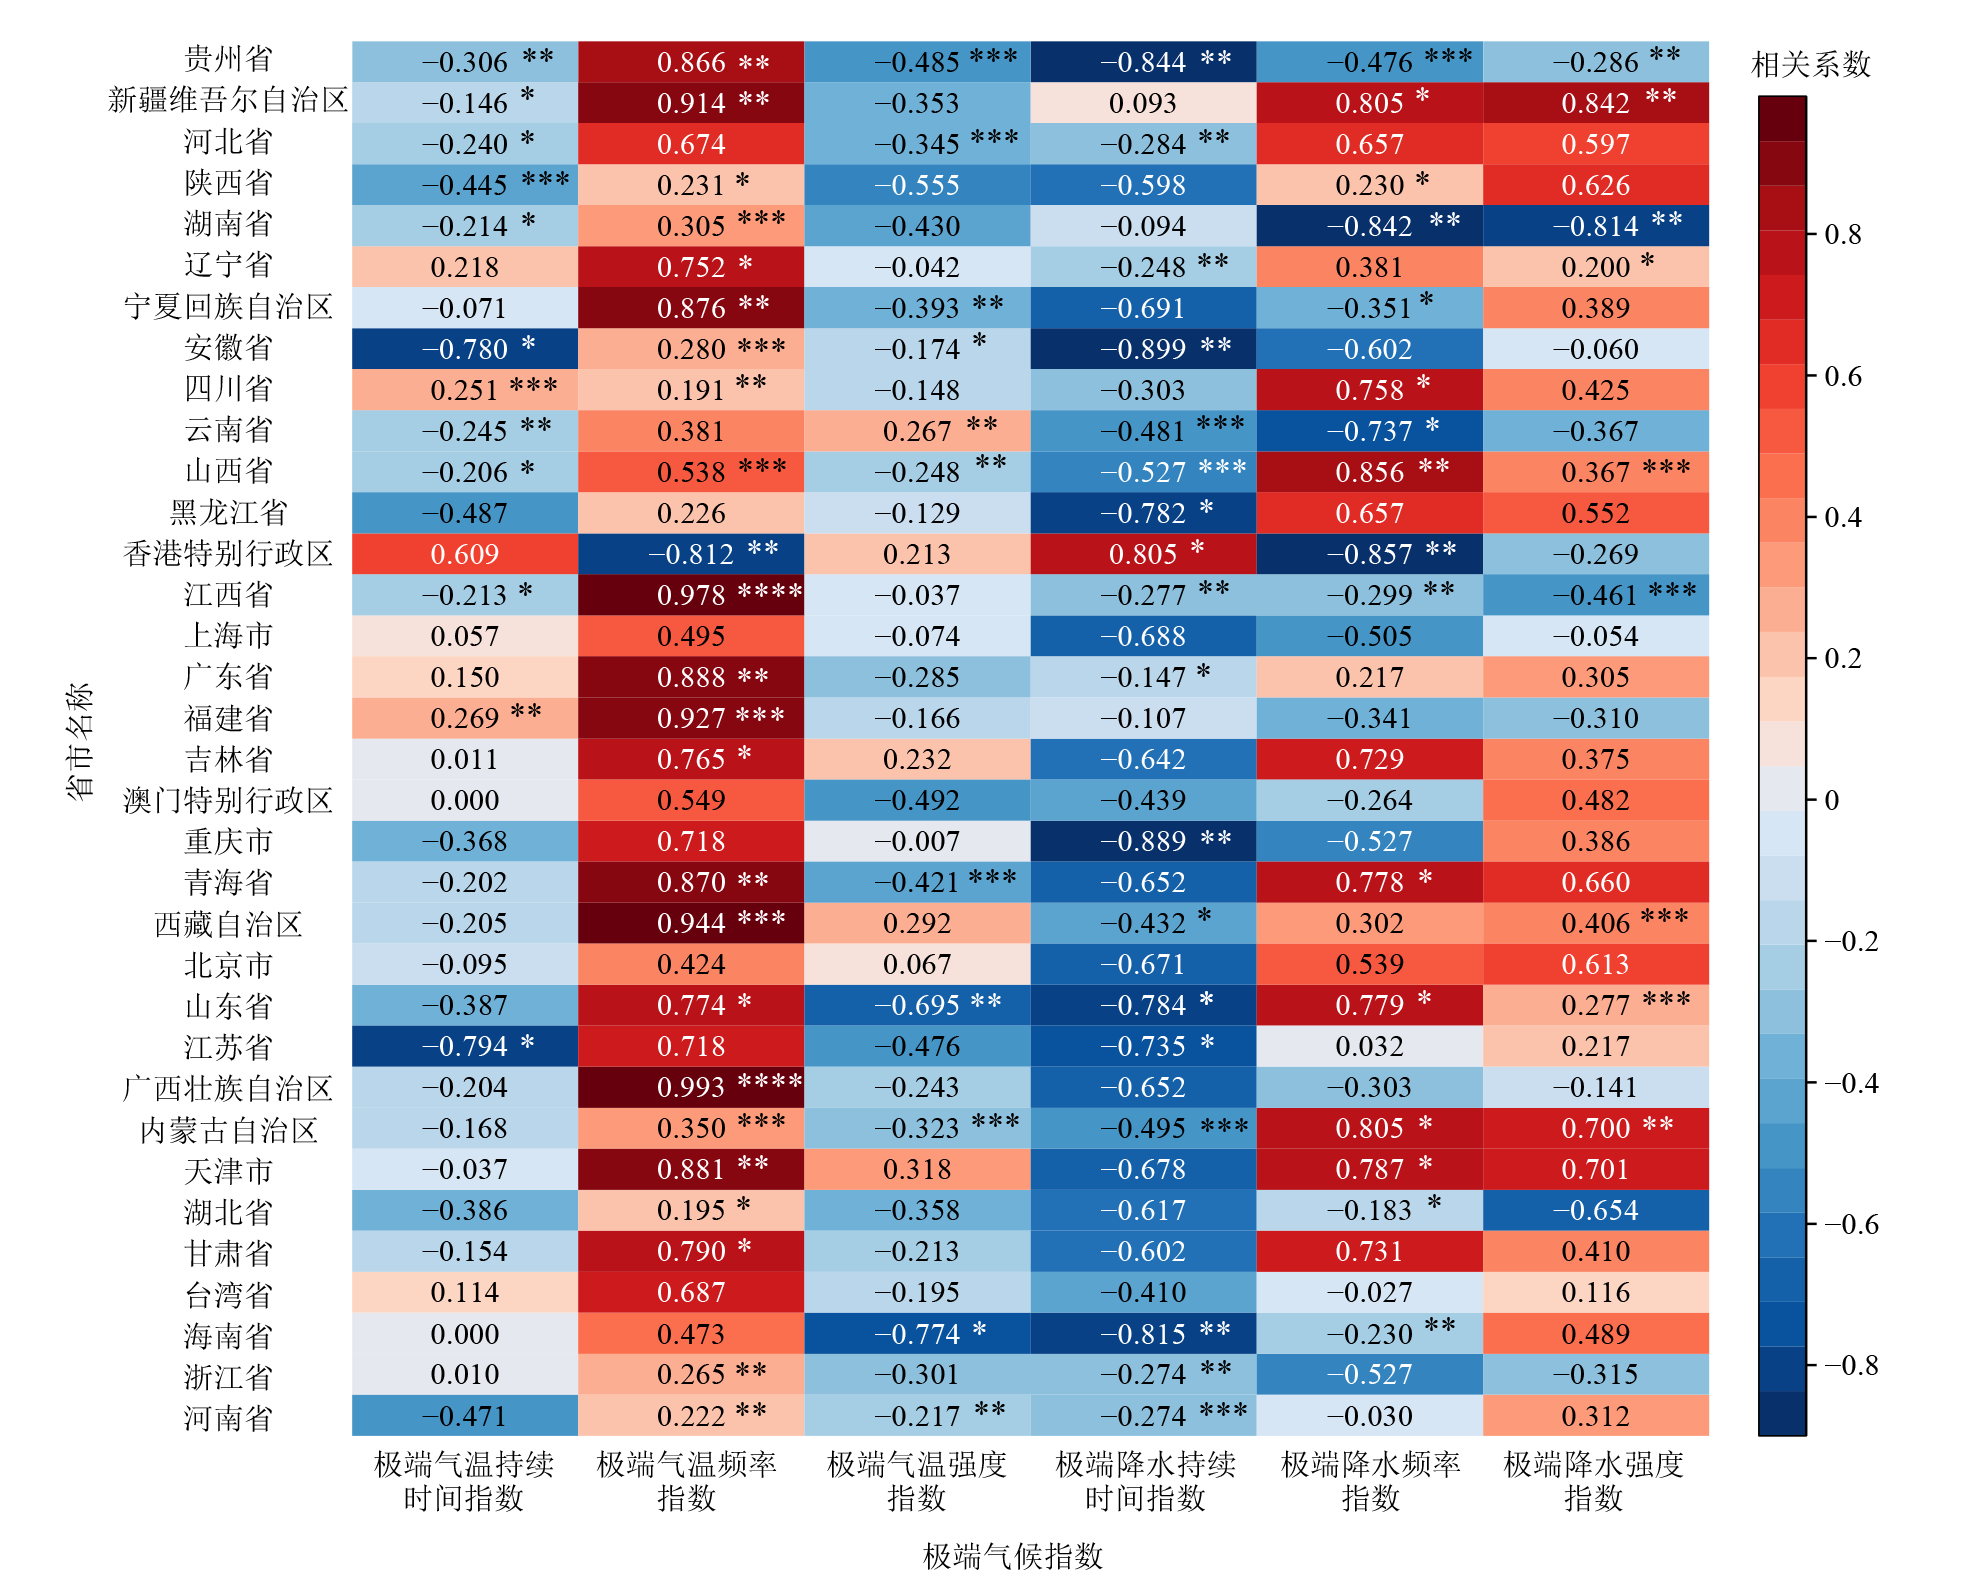
图7 各省市相关系数热力图 图中“*”、“**”、“***”、“****”分别表示通过p<0.1、p<0.05、p<0.01、p<0.001水平的显著性检验
Figure 7 Heatmap of correlation coefficients for each province and region
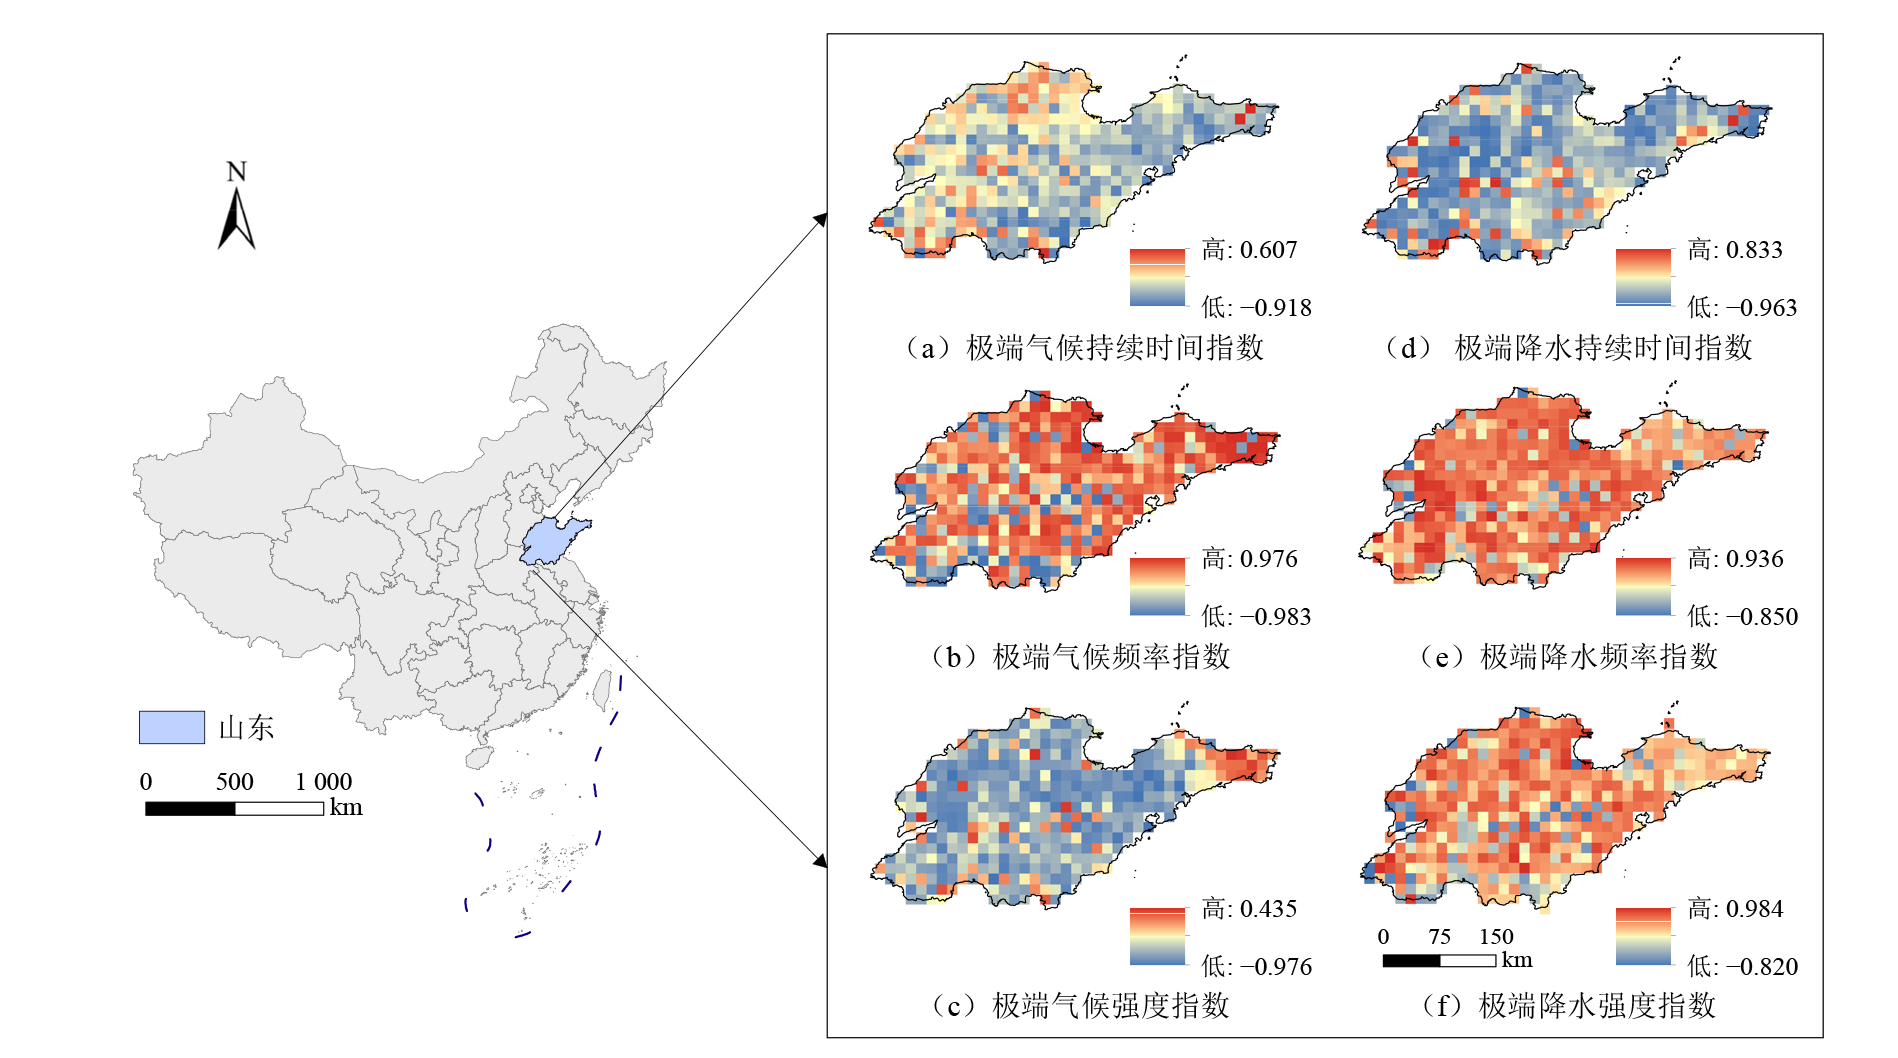
图8 山东省各极端气候指标与碳排放之间的相关系数
Figure 8 Correlation coefficients between extreme climate indicators and carbon emissions in Shandong Province
| [1] |
BAKER H S, MILLAR R J, KAROLY D J, et al., 2018. Higher CO2 concentrations increase extreme event risk in a 1.5 ℃ world[J]. Nature Climate Change, 8(7): 604-608.
DOI |
| [2] |
CHEN L S, ZHANG Y, ZHU E Y, et al., 2025. Segregation of sea breezes and cooling effects on land-surface temperatures in a coastal city[J]. Sustainable Cities and Society, 118: 106017.
DOI URL |
| [3] |
KIM S K, SHIN J, AN S I, et al., 2022. Widespread irreversible changes in surface temperature and precipitation in response to CO2 forcing[J]. Nature Climate Change, 12(9): 834-840.
DOI |
| [4] |
MOORE T R, MATTHEWS D H, CHAVAILLAZ Y, 2024. Linking historical and projected trends in extreme precipitation with cumulative carbon dioxide emissions[J]. Atmosphere-Ocean, 62(2): 165-182.
DOI URL |
| [5] |
OTTO F E, SKEIE R B, FUGLESTVEDT J S, et al., 2017. Assigning historic responsibility for extreme weather events[J]. Nature Climate Change, 7(11): 757-759.
DOI URL |
| [6] |
SHAO S, QIAO H W, 2023. Impact of temperature extremes on carbon emissions from crop production in Hebei Province, China[J]. Atmosphere, 14(7): 1179.
DOI URL |
| [7] |
SMITH P, DAVIS S J, CREUTZIG F, et al., 2016. Biophysical and economic limits to negative CO2 emissions[J]. Nature Climate Change, 6(1): 42-50.
DOI |
| [8] |
XU M, ZHANG J, ZHANG Z, et al., 2024. Global responses of wetland methane emissions to extreme temperature and precipitation[J]. Environmental Research, 252: 118907.
DOI URL |
| [9] |
YANG J, HUANG Y J, TAKEUCHI K, 2022a. Does drought increase carbon emissions? evidence from Southwestern China[J]. Ecological Economics, 201: 107564.
DOI URL |
| [10] |
YANG J, XIN J X, ZHANG Y Q, et al., 2022b. Contributions of sea-land breeze and local climate zones to daytime and nighttime heat island intensity[J]. Npj Urban Sustainability, 2(1): 12.
DOI |
| [11] |
ZHAO L, ZHANG C F, WANG Q, et al., 2024. Climate extremes and land use carbon emissions: Insight from the perspective of sustainable land use in the eastern coast of China[J]. Journal of Cleaner Production, 452: 142219.
DOI URL |
| [12] | 安敏, 韦雅倩, 何伟军, 等, 2024. 气候变化和人类活动对中国生态敏感性的影响分析与改善路径——基于响应曲面法[J]. 中国人口·资源与环境, 34(5): 69-79. |
| AN M, WEI Y Q, HE W J, et al., 2024. Impact of climate change and human activities on ecological sensitivity in China and its improvement paths: Based on response surface methodology[J]. China Population, Resources and Environment, 34(5): 69-79. | |
| [13] | 陈思达, 刘凯, 李博浩, 等, 2025. 中国脱贫县破纪录极端天气事件研究[J]. 气候变化研究进展, 21(3): 327-339. |
| CHEN S D, LIU K, LI B H, et al., 2025. The analysis of record-breaking probability of extreme weather in China’s poverty-alleviated counties[J]. Climate Change Research, 21(3): 327-339. | |
| [14] | 陈一溥, 郑伯红, 2021. 长株潭城市群人为热排放对城市热环境影响研究[J]. 长江流域资源与环境, 30(7): 1625-1637. |
| CHEN Y P, ZHENG B H, 2021. Study on the impact of human heat emission on the urban thermal environment of Changsha Zhuzhou Xiangtan Urban Agglomeration[J]. Resources and Environment in the Yangtze Basin, 30(7): 1625-1637. | |
| [15] | 高翯, 梁仕龙, 姜雪, 2024. 基于夜间灯光数据的县域碳排放空间关联网络特征研究——以吉林省为例[J]. 环境科学学报, 44(9): 414-426. |
| GAO H, LIANG S L, JIANG X, 2024. Spatial correlation network characteristics of county carbon emissions based on night light data: A case study of Jilin Province[J]. Acta Scientiae Circumstantiae, 44(9): 414-426. | |
| [16] | 韩丹丹, 穆兴民, 高鹏, 等, 2020. 黄土高原地区植被变化及其对极端气候的响应[J]. 水土保持通报, 40(2): 247-254. |
| HAN D D, MU X M, GAO P, et al., 2020. Dynamic changes of vegetation in Loess Plateau and its response to extreme climate[J]. Bulletin of Soil and Water Conservation, 40(2): 247-254. | |
| [17] |
侯承志, 黄丹青, 桂东伟, 等, 2023. 1961-2019年中国北方沙漠沙地极端气候变化特征及其影响因素[J]. 地理科学, 43(8): 1495-1505.
DOI |
| HOU C Z, HUANG D Q, GUI D W, et al., 2023. Spatiotemporal variations of climate extremes and influential factors in deserts and sandy fields of Northern China from 1961 to 2019[J]. Geographical Science, 43(8): 1495-1505. | |
| [18] | 黄汉志, 贾俊松, 张振旭, 2023. 江西县域土地利用变化碳排放时空演变及其影响因素[J]. 生态学报, 43(20): 8390-8403. |
| HUANG H Z, JIA J S, ZHANG Z X, 2023. Spatiotemporal pattern evolution and influencing factors of land-use carbon emissions in counties, Jiangxi Province[J]. Acta Ecologica Sinica, 43(20): 8390-8403. | |
| [19] |
黄怀玉, 龚直文, 2023. 格网尺度的重庆市碳补偿研究——基于土地利用视角[J]. 资源科学, 45(12): 2358-2371.
DOI |
|
HUANG H Y, GONG Z W, 2023. Grid scale measurement of carbon compensation in Chongqing City: Based on the perspective of land use[J]. Resources Science, 45(12): 2358-2371.
DOI |
|
| [20] |
李伊涵, 王火根, 肖小玮, 2025. 基于系统动力学的江西省碳排放预测与减排路径研究[J]. 生态环境学报, 34(9): 1351-1360.
DOI |
| LI Y H, WANG H G, XIAO X W, 2025. A study on carbon emission forecasting and reduction pathways in Jiangxi Province based on system dynamics[J]. Ecology and Environmental Sciences, 34(9): 1351-1360. | |
| [21] | 朴世龙, 张新平, 陈安平, 等, 2019. 极端气候事件对陆地生态系统碳循环的影响[J]. 中国科学: 地球科学, 49(9): 1321-1334. |
|
PIAO S L, ZHANG X P, CHEN A P, et al., 2019. The impacts of climate extremes on the terrestrial carbon cycle: A review[J]. Scientia Sinica Terrae, 49(9): 1321-1334.
DOI URL |
|
| [22] | 邱冬冬, 毛德华, 2025. 长株潭城市群中小尺度下的土地利用碳排放强度时空分布格局分析[J]. 生态科学, 44(5): 163-174. |
| QIU D D, MAO D H, 2025. Analysis of the spatio-temporal distribution patterns of land use carbon emission intensity at medium and small scales in the Chang-Zhu-Tan Urban Agglomeration[J]. Ecological Science, 44(5): 163-174. | |
| [23] | 曲芷程, 黄绍普, 刘司博, 等, 2025. 1963-2020年蒙古锡林河流域极端气候及其对水文干旱的影响[J]. 生态学报, 45(11): 5386-5397. |
| QU Z C, HUANG S P, LIU S B, et al., 2025. Extreme climate and its impact on hydrological drought in the Xilin River Basin of Inner Mongolia over the past 60 years[J]. Acta Ecologica Sinica, 45(11): 5386-5397. | |
| [24] | 苏日罕, 郭恩亮, 王永芳, 等, 2023. 1982-2020年内蒙古地区极端气候变化及其对植被的影响[J]. 生态学报, 43(1): 419-431. |
|
SU R H, GUO E L, WANG Y F, et al., 2023. Extreme climate changes in the Inner Mongolia and their impacts on vegetation dynamics during 1982-2020[J]. Acta Ecologica Sinica, 43(1): 419-431.
DOI URL |
|
| [25] | 孙彩凤, 姜巍, 高卫东, 2025. 山东省土地利用碳排放变化的时空特征及影响因素分析[J]. 环境科学, 46(1): 30-40. |
| SUN C F, JIANG W, GAO W D, 2025. Spatial-temporal evolution and influencing factors of land use carbon emissions in Shandong Province[J]. Environmental Science, 46(1): 30-40. | |
| [26] | 王丹, 荆延德, 韩善梅, 等, 2022. 基于格网的南四湖流域土地利用碳排放与其生态系统服务价值时空关系分析[J]. 生态学报, 42(23): 9604-9614. |
| WANG D, JING Y D, HAN S M, et al., 2022. Spatio-temporal relationship of land-use carbon emission and ecosystem service value in Nansi Lake Basin based upon a grid square[J]. Acta Ecologica Sinica, 42(23): 9604-9614. | |
| [27] | 王巧玲, 李双成, 2025. 云南省碳排放时空演变特征及影响因素分析[J]. 中国环境科学, 45(1): 528-537. |
| WANG Q L, LI S C, 2025. Dynamics of carbon emissions in Yunnan Province: Spatiotemporal characteristics and influencing factors[J]. China Environmental Science, 45(1): 528-537. | |
| [28] |
王秀玲, 金翠, 王浩然, 等, 2025. 辽宁省植被时空变化特征及其对极端气候的响应[J]. 生态环境学报, 34(9): 1410-1420.
DOI |
| WANG X L, JIN C, WANG H R, et al., 2025. Spatial-temporal variation characteristics of vegetation and its response to extreme climate in Liaoning Province[J]. Ecology and Environmental Sciences, 34(9): 1410-1420. | |
| [29] |
肖昀廷, 蔡晨康, 黄亦心, 等, 2025. 海表温度日变化特征对海陆风模拟的影响研究[J]. 地学前缘, 32(3): 218-230.
DOI |
|
XIAO Y T, CAI C K, HUANG Y X, et al., 2025. Study on the impact of daily sea surface temperature variation characteristics on the simulation of sea land breeze[J]. Earth Science Frontiers, 32(3): 218-230.
DOI |
|
| [30] |
杨阳, 赵娜, 岳天祥, 2022. 1980-2018年中国极端高温事件时空格局演变特征[J]. 地理科学, 42(3): 536-547.
DOI |
|
YANG Y, ZHAO N, YUE T X, 2022. Spatio-temporal variations of extreme high temperature event in China from 1980 to 2018[J]. Scientia Geographica Sinica, 42(3): 536-547.
DOI |
|
| [31] |
于水, 张晓龙, 刘志娟, 等, 2023. 1961-2020年松花江流域极端气候指数的时空变化特征[J]. 应用生态学报, 34(4): 1091-1101.
DOI |
|
YU S, ZHANG X L, LIU Z J, et al., 2023. Spatial and temporal variations of extreme climate index in the Songhua River Basin during 1961-2020[J]. Chinese Journal of Applied Ecology, 34(4): 1091-1101.
DOI |
|
| [32] | 曾灿英, 韩丹叶, 刘庄田, 等, 2025. 区域经济差异背景下中国二氧化碳排放影响因素与减排策略[J]. 环境科学, 46(10): 6221-6232. |
| ZENG C Y, HAN D Y, LIU Z T, et al., 2025. Influencing factors and mitigation strategies for carbon dioxide emissions in China under regional economic differentiation[J]. Environmental Science, 46(10): 6221-6232. | |
| [33] | 张韬略, 姜亮亮, 刘冰, 等, 2025. 中国植被对气候变化的敏感性定量分析[J]. 生态学报, 45(5): 2412-2423. |
| ZHANG T L, JIANG L L, LIU B, et al., 2025. Quantitative analysis of vegetation sensitivity to climate change in China[J]. Acta Ecologica Sinica, 45(5): 2412-2423. | |
| [34] | 周波涛, 钱进, 2021. IPCC AR6报告解读: 极端天气气候事件变化[J]. 气候变化研究进展, 17(6): 713-718. |
| ZHOU B T, QIAN J, 2021. Changes of weather and climate extremes in the IPCC AR6[J]. Climate Change Research, 17(6): 713-718. |
| [1] | 文少强, 胡宝清, 包婷, 谢薇薇, 劳茵茵, 高劲松. 国土空间功能与土地利用碳排放的脱钩效应及驱动机制研究——以平陆运河经济带为例[J]. 生态环境学报, 2026, 35(5): 725-737. |
| [2] | 孙攀, 周琦, 张佳雯, 吴玉鸣. 中国双向FDI协调发展的碳排放双控效应研究[J]. 生态环境学报, 2025, 34(9): 1329-1340. |
| [3] | 王秀玲, 金翠, 王浩然, 候明璇. 辽宁省植被时空变化特征及其对极端气候的响应[J]. 生态环境学报, 2025, 34(9): 1410-1420. |
| [4] | 周乐乐, 万霞, 丁黎明, 魏星宇, 王建平, 陈静, 李鑫, 樊敏, 黎猛, 喻萧斌. 四川省碳排放-碳储存与碳供需比空间分布特征研究[J]. 生态环境学报, 2025, 34(3): 368-379. |
| [5] | 贺宥文, 韩亚峰, 王旭刚, 孙丽蓉, 邢江冰, 曹晟源. 不同光照条件下农田湿地土壤碳排放的驱动因子差异[J]. 生态环境学报, 2025, 34(3): 391-400. |
| [6] | 刘军, 刘鑫宇, 问鼎. 中国区域旅游碳排放网络特征及碳减排协同效应研究[J]. 生态环境学报, 2025, 34(11): 1675-1689. |
| [7] | 王兴来, 苗淑杰, 乔云发. 基于江苏省本地化参数评价稻麦周年轮作系统碳足迹[J]. 生态环境学报, 2023, 32(9): 1682-1691. |
| [8] | 宋灯辉, 付迪, 黎建强, 付钇珊, 邢学霞, 田原. 云南松林计划烧除地表碳损失量及碳排放量估算[J]. 生态环境学报, 2023, 32(8): 1376-1383. |
| [9] | 张露, 何雨霏, 陈坦, 杨婷, 张冰, 金军. 2011—2020年汾渭平原农田生态系统碳足迹的时空格局演变[J]. 生态环境学报, 2023, 32(6): 1149-1162. |
| [10] | 李语诗, 夏志业, 张蕾. 基于SSPs多情景目标的2030年成渝经济圈土地利用碳排放预测及其空间优化[J]. 生态环境学报, 2023, 32(3): 535-544. |
| [11] | 范清瑶, 夏卫生, 莫成鑫, 周浩. 基于“三生空间”的土地利用转型时空演变及其碳排放效应研究——以福建省为例[J]. 生态环境学报, 2023, 32(12): 2183-2193. |
| 阅读次数 | ||||||
|
全文 |
|
|||||
|
摘要 |
|
|||||