生态环境学报 ›› 2022, Vol. 31 ›› Issue (12): 2358-2366.DOI: 10.16258/j.cnki.1674-5906.2022.12.010
蒋斌1,3( ), 陈多宏2,*(), 张涛2, 袁鸾2, 周炎2, 沈劲2, 张春林1, 王伯光1,3
收稿日期:2022-08-18
出版日期:2022-12-18
发布日期:2023-02-15
通讯作者:
*陈多宏,男,博士,教授级高级工程师,研究方向为大气污染监测与预警预报。E-mail: 13710967699@139.com作者简介:蒋斌(1990年生),男,硕士,主要研究方向为大气环境化学与气候变迁。E-mail: jndxjiangbin@126.com
基金资助:
JIANG Bin1,3(), CHEN Duohong2,*(), ZHANG Tao2, YUAN Luan2, ZHOU Yan2, SHEN Jing2, ZHANG Chunlin1, WANG Boguang1,3
Received:2022-08-18
Online:2022-12-18
Published:2023-02-15
摘要:
近年来中国空气质量得到了明显改善,但PM2.5污染事件依旧频发,农作物秸秆焚烧是重要的诱发因素之一。为探讨华南地区水稻秸秆集中焚烧情形下的碳质气溶胶组分特征,于2014年夏秋水稻收割期在“中国广东大气超级站”开展了两期在线观测。结果显示,夏收期元素碳(EC)和有机碳(OC)的平均质量浓度分别为 (2.5±1.3) μg?m?3和 (6.6±2.5) μg?m?3;秋收期则是夏收期的两倍,分别为 (5.8±3.9) μg?m?3和 (13.6±8.5) μg?m?3。总碳(TC)平均占ρ(PM2.5)的30.9%±3.7%和26.8%±7.1%,是PM2.5的重要组成部分。夏收期ρ(EC)/ρ(PM2.5)和ρ(OC)/ρ(PM2.5)均随ρ(PM2.5)的增加而下降,占比之和从74.0%下降至18.3%,而ρ(OC)/ρ(EC)比值则随ρ(PM2.5)的增加从1.7逐渐增长至4.4。而秋收期在相对稳定的源排放和静稳的气象条件加持下,ρ(EC)/ρ(PM2.5)、ρ(OC)/ρ(PM2.5)和ρ(OC)/ρ(EC)比值随ρ(PM2.5)的变化均维持相对稳定,ρ(EC)和ρ(OC)显著相关(r=0.91),且ρ(OC)无明显日变化特征。基于EC示踪法和K+质量平衡估算,夏收期OC受光化学反应影响显著,二次有机碳(SOC)的平均质量浓度为 (3.7±2.4) μg?m?3,占ρ(OC)的52.1%±22.2%;生物质燃烧排放的有机碳(OCbb)为 (0.8±0.4) μg?m?3,占ρ(OC)的12.4%±5.9%。受强生物质燃烧排放的影响,秋收期ρ(OCbb)平均为 (8.5±5.0) μg?m?3,对OC的贡献高达66.6%±18.7%;而ρ(SOC)仅为 (1.9±2.5) μg?m?3,ρ(SOC)/ρ(OC)比值降至14.5%±16.5%。与OC不同的是,化石燃料燃烧排放始终是华南地区EC的最大贡献源。秋收期生物质燃烧排放可显著提升PM2.5质量浓度,在不利气象条件下易引发污染事件,因此需重点加强对华南秋收期农作物秸秆集中焚烧的管控。
中图分类号:
蒋斌, 陈多宏, 张涛, 袁鸾, 周炎, 沈劲, 张春林, 王伯光. 华南水稻秸秆焚烧期碳质气溶胶组分特征及源贡献评估[J]. 生态环境学报, 2022, 31(12): 2358-2366.
JIANG Bin, CHEN Duohong, ZHANG Tao, YUAN Luan, ZHOU Yan, SHEN Jing, ZHANG Chunlin, WANG Boguang. Characteristics and Sources of Carbonaceous Aerosols during the Crop Straw Burning Seasons in Southern China[J]. Ecology and Environment, 2022, 31(12): 2358-2366.

图1 采样点位及MODIS(Terra+Aqua)火点分布 Source: ftp://fuoco.geog.umd.edu
Figure 1 Sampling site and distribution of MODIS (Terra+Aqua) fire counts
| 参数项 Parameters | 夏收期 Summer harvest season | 秋收期 Autumn harvest season |
|---|---|---|
| 温度 t/℃ | 30.0±3.3 | 24.9±2.8 |
| 相对湿度 Relative Humidity/% | 69.3±13.7 | 67.8±13.0 |
| 风速 v(wind)/(m∙s−1) | 1.8±1.1 | 1.1±0.6 |
| ρ(CO)/(mg∙m−3) | 0.7± 0.1 | 1.1±0.3 |
| ρ(NO2)/(μg∙m−3) | 11.9±7.3 | 38.4±22.0 |
| ρ(SO2)/(μg∙m−3) | 11.5±7.3 | 31.3±19.4 |
| ρ(O3)/(μg∙m−3) | 74.0±59.6 | 73.6±66.5 |
| ρ(PM2.5)/(μg∙m−3) | 33.1±10.6 | 71.2±39.0 |
| ρ(EC)/(μg∙m−3) | 2.5±1.3 | 5.8±3.9 |
| ρ(OC)/(μg∙m−3) | 6.6±2.5 | 13.6±8.5 |
| ρ(OC)/ρ(EC) | 3.0±1.7 | 2.5±0.8 |
| ρ(TC)/ρ(PM2.5) | 30.9%±3.7% | 26.8%±7.1% |
| ρ(K+)/ρ(PM2.5) | 1.2%±0.7% | 4.1%±2.2% |
表1 采样期间气象参数及污染物浓度
Table 1 Meteorological parameters and pollutants during the sampling periods
| 参数项 Parameters | 夏收期 Summer harvest season | 秋收期 Autumn harvest season |
|---|---|---|
| 温度 t/℃ | 30.0±3.3 | 24.9±2.8 |
| 相对湿度 Relative Humidity/% | 69.3±13.7 | 67.8±13.0 |
| 风速 v(wind)/(m∙s−1) | 1.8±1.1 | 1.1±0.6 |
| ρ(CO)/(mg∙m−3) | 0.7± 0.1 | 1.1±0.3 |
| ρ(NO2)/(μg∙m−3) | 11.9±7.3 | 38.4±22.0 |
| ρ(SO2)/(μg∙m−3) | 11.5±7.3 | 31.3±19.4 |
| ρ(O3)/(μg∙m−3) | 74.0±59.6 | 73.6±66.5 |
| ρ(PM2.5)/(μg∙m−3) | 33.1±10.6 | 71.2±39.0 |
| ρ(EC)/(μg∙m−3) | 2.5±1.3 | 5.8±3.9 |
| ρ(OC)/(μg∙m−3) | 6.6±2.5 | 13.6±8.5 |
| ρ(OC)/ρ(EC) | 3.0±1.7 | 2.5±0.8 |
| ρ(TC)/ρ(PM2.5) | 30.9%±3.7% | 26.8%±7.1% |
| ρ(K+)/ρ(PM2.5) | 1.2%±0.7% | 4.1%±2.2% |
| 采样点 Locations | 采样时间 Periods | ρ(OC)(by C)/(μg∙m−3) | ρ(OC)(by C)/(μg∙m−3) | ρ(TC)/ρ(PM2.5) | 参考文献 References |
|---|---|---|---|---|---|
| 鹤山 Heshan | 2010年11月 | 31.85 | 6.67 | 41.6% | 丁晴等, |
| 鹤山 Heshan | 2014年7月 | 6.6 | 2.6 | 30.9% | This research |
| 2014年10月 | 13.4 | 5.8 | 26.8% | ||
| 广州 Guangzhou | 2012全年 | 7.3 | 2.7 | 20.8% | Wu et al., |
| 厦门 Xiamen | 2014年12月 | 9.8 | 1.9 | 15.6% | 胡起超等, |
| 成都 Chengdu | 2015年7月 | 7.4 | 2.5 | 21.9% | Wang et al., |
| 2014年10—11月 | 10.4 | 3.0 | 21.6% | ||
| 重庆 Chongqing | 2015年7月 | 9.7 | 3.8 | 24.0% | Wang et al., |
| 2014年10—11月 | 8.5 | 3.7 | 22.5% | ||
| 上海 Shanghai | 2012年夏季 | 6.2 | 1.4 | 14.7% | Zhao et al., |
| 2012年秋季 | 12.8 | 2.4 | 18.5% | ||
| 南京 Nanjing | 2013年夏季 | 15.8 | 7.1 | 29.4% | Li et al., |
| 2013年秋季 | 46.0 | 14.2 | 22.7% | ||
| 新乡 Xinxiang | 2013年10—11月 | 29.3 | 4.8 | 14.0% | 申铠君等, |
| 石家庄 Shijiazhuang | 2013年10月 | 23.5 | 7.3 | 16.6% | 常青, |
| 西安 Xi’an | 2012年夏季 | 18.9 | 8.0 | 28.4% | 王帆等, |
| 2012年秋季 | 29.8 | 8.4 | 30.0% | ||
| 北京 Beijing | 2014年7—8月 | 9.3 | 3.1 | 20.0% | Gao et al., |
| 名古屋, 日本 Nagoya, Japan | 2018全年 | 3.3 | 0.7 | 32.5% | Makiko et al., |
| 洛杉矶, 美国 Los Angeles, America | 2010全年 | 5.8 | 1.7 | 33.8% | Abdulmlik et al., |
| 塞萨洛尼基, 希腊 Thessaloniki, Greece | 2011全年 | 8.4 | 5.3 | 44.0% | Constantimi et al., |
| 波尔图, 葡萄牙 Oporto, Portugal | 2013年夏季 | 7.1 | 4.7 | 33.5% | Danilo et al., |
表2 国内外环境空气PM2.5中ρ(EC)和ρ(OC)
Table 2 ρ(EC) and ρ(OC) in PM2.5 at home and abroad
| 采样点 Locations | 采样时间 Periods | ρ(OC)(by C)/(μg∙m−3) | ρ(OC)(by C)/(μg∙m−3) | ρ(TC)/ρ(PM2.5) | 参考文献 References |
|---|---|---|---|---|---|
| 鹤山 Heshan | 2010年11月 | 31.85 | 6.67 | 41.6% | 丁晴等, |
| 鹤山 Heshan | 2014年7月 | 6.6 | 2.6 | 30.9% | This research |
| 2014年10月 | 13.4 | 5.8 | 26.8% | ||
| 广州 Guangzhou | 2012全年 | 7.3 | 2.7 | 20.8% | Wu et al., |
| 厦门 Xiamen | 2014年12月 | 9.8 | 1.9 | 15.6% | 胡起超等, |
| 成都 Chengdu | 2015年7月 | 7.4 | 2.5 | 21.9% | Wang et al., |
| 2014年10—11月 | 10.4 | 3.0 | 21.6% | ||
| 重庆 Chongqing | 2015年7月 | 9.7 | 3.8 | 24.0% | Wang et al., |
| 2014年10—11月 | 8.5 | 3.7 | 22.5% | ||
| 上海 Shanghai | 2012年夏季 | 6.2 | 1.4 | 14.7% | Zhao et al., |
| 2012年秋季 | 12.8 | 2.4 | 18.5% | ||
| 南京 Nanjing | 2013年夏季 | 15.8 | 7.1 | 29.4% | Li et al., |
| 2013年秋季 | 46.0 | 14.2 | 22.7% | ||
| 新乡 Xinxiang | 2013年10—11月 | 29.3 | 4.8 | 14.0% | 申铠君等, |
| 石家庄 Shijiazhuang | 2013年10月 | 23.5 | 7.3 | 16.6% | 常青, |
| 西安 Xi’an | 2012年夏季 | 18.9 | 8.0 | 28.4% | 王帆等, |
| 2012年秋季 | 29.8 | 8.4 | 30.0% | ||
| 北京 Beijing | 2014年7—8月 | 9.3 | 3.1 | 20.0% | Gao et al., |
| 名古屋, 日本 Nagoya, Japan | 2018全年 | 3.3 | 0.7 | 32.5% | Makiko et al., |
| 洛杉矶, 美国 Los Angeles, America | 2010全年 | 5.8 | 1.7 | 33.8% | Abdulmlik et al., |
| 塞萨洛尼基, 希腊 Thessaloniki, Greece | 2011全年 | 8.4 | 5.3 | 44.0% | Constantimi et al., |
| 波尔图, 葡萄牙 Oporto, Portugal | 2013年夏季 | 7.1 | 4.7 | 33.5% | Danilo et al., |
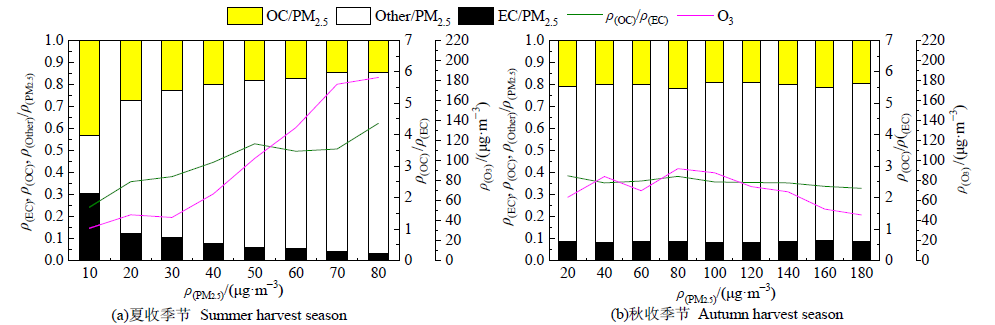
图2 PM2.5中碳质气溶胶质量占比、ρ(OC)/ρ(EC)和ρ(O3)随ρ(PM2.5)浓度的变化特征
Figure 2 The carbonaceous aerosol mass fractions of PM2.5, ρ(OC)/ρ(EC) ratio and ρ(O3), classified by ρ(PM2.5)
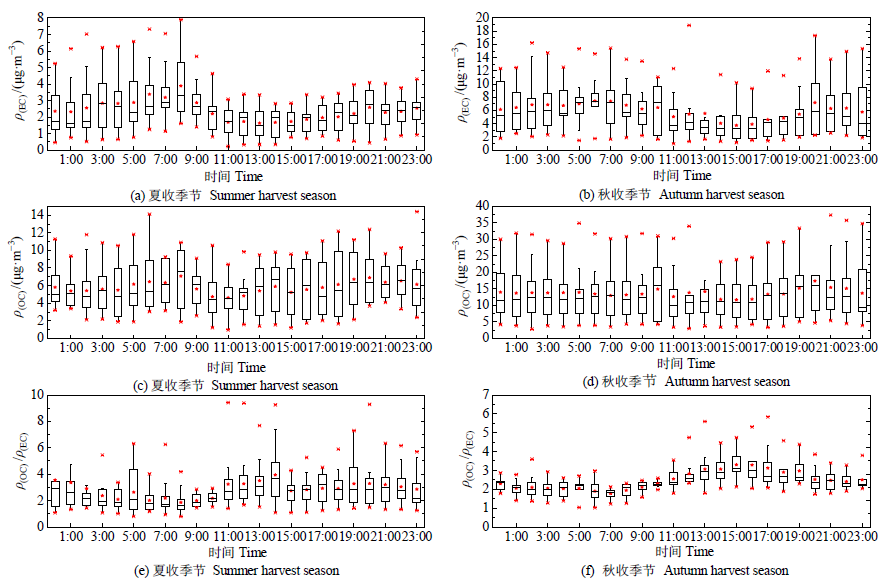
图3 夏秋水稻收割期ρ(EC)、ρ(OC)和ρ(OC)/ρ(EC)日变化
Figure 3 Diurnal variations of ρ(EC), ρ(OC) and ρ(OC)/ρ(EC) ratio in summer and autumn harvest seasons
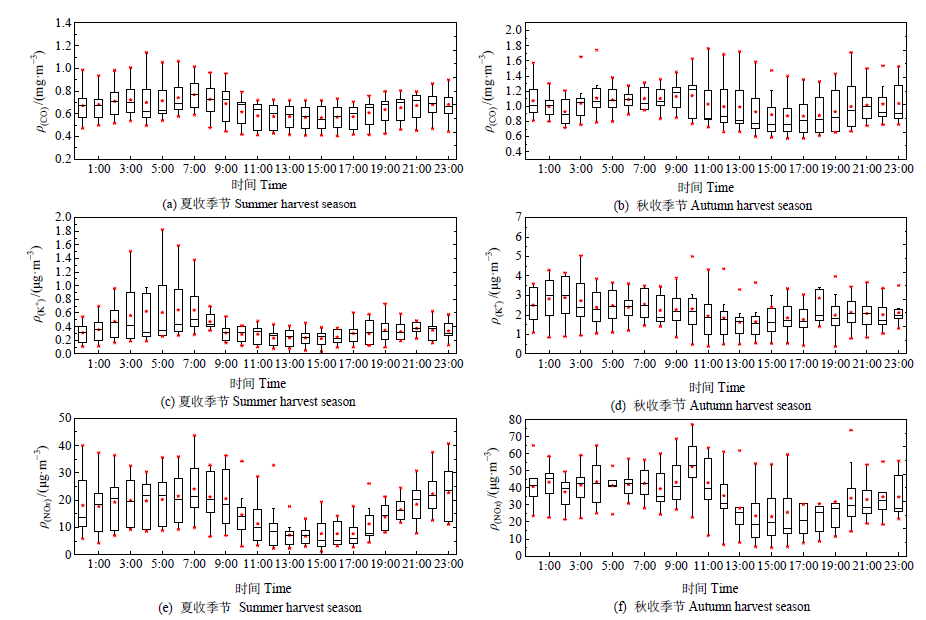
图4 夏秋水稻收割期ρ(CO)、ρ(K+)和ρ(NOx)日变化
Figure 4 Diurnal variations of ρ(CO), ρ(K+) and ρ(NOx) during the summer and autumn harvest seasons
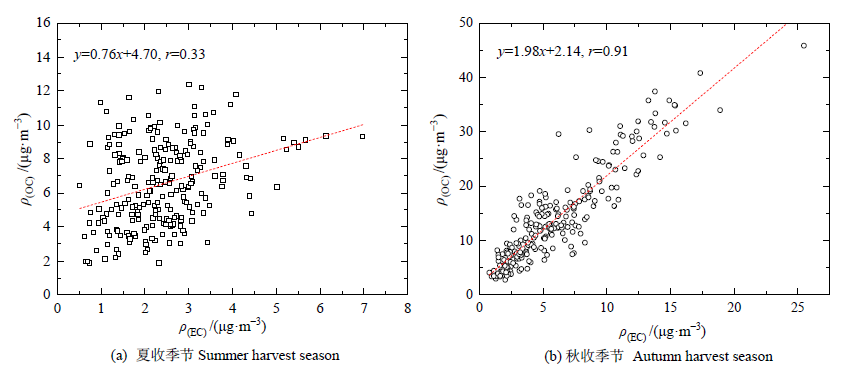
图5 夏秋水稻收割期ρ(OC)与ρ(EC)的相关性
Figure 5 The correlation relationships between ρ(OC) and ρ(EC) in summer and autumn harvest seasons
| 采样点 Locations | 采样时间 Periods | 生物质燃烧对 有机碳的贡献 ρ(OCbb)/ρ(OC) | 生物质燃烧对 元素碳的贡献 ρ(ECbb)/ρ(EC) | 参考文献 Reference |
|---|---|---|---|---|
| 鹤山 Heshan | 2014年7月, 水稻收割期 | 12.4% | 12.1% | This research |
| 成都 Chengdu | 2012年5月—2013年7月 | 30.8% | — | Chen et al., |
| 北京 Beijing | 2013全年 | 18.4% | — | Ji et al., |
| 虞城 Yucheng | 2013年6月, 生物质燃烧事件 | 44.5% | 50.8% | Yao et al., |
| 上海 Shanghai | 2011年5月—6月, 农作物收割期 | 69% | 68% | Cheng et al., |
| 南京 Nanjing | 2014年6月, 农作物收割期 | 51% | 16% | Chen et al., |
| 鹤山 Heshan | 2014年10月, 水稻收割期 | 66.6% | 39.5% | This research |
| 广州 Guangzhou | 2013年冬季, 霾污染事件 | 58% | 32% | Zhang et al., |
| 大田市, 韩国 Daejeon, Korea | 2012年10月—11月, 水稻收割期 | 45.0% | 12.0% | Jung et al., |
| 布达佩斯, 匈牙利 Budapest, Hungary | 2017年10月 | 36.0% | 43.0% | Salma et al., |
表3 国内外生物质燃烧对碳质组分贡献对比
Table 3 Comparison of biomass burning contribution to carbon components
| 采样点 Locations | 采样时间 Periods | 生物质燃烧对 有机碳的贡献 ρ(OCbb)/ρ(OC) | 生物质燃烧对 元素碳的贡献 ρ(ECbb)/ρ(EC) | 参考文献 Reference |
|---|---|---|---|---|
| 鹤山 Heshan | 2014年7月, 水稻收割期 | 12.4% | 12.1% | This research |
| 成都 Chengdu | 2012年5月—2013年7月 | 30.8% | — | Chen et al., |
| 北京 Beijing | 2013全年 | 18.4% | — | Ji et al., |
| 虞城 Yucheng | 2013年6月, 生物质燃烧事件 | 44.5% | 50.8% | Yao et al., |
| 上海 Shanghai | 2011年5月—6月, 农作物收割期 | 69% | 68% | Cheng et al., |
| 南京 Nanjing | 2014年6月, 农作物收割期 | 51% | 16% | Chen et al., |
| 鹤山 Heshan | 2014年10月, 水稻收割期 | 66.6% | 39.5% | This research |
| 广州 Guangzhou | 2013年冬季, 霾污染事件 | 58% | 32% | Zhang et al., |
| 大田市, 韩国 Daejeon, Korea | 2012年10月—11月, 水稻收割期 | 45.0% | 12.0% | Jung et al., |
| 布达佩斯, 匈牙利 Budapest, Hungary | 2017年10月 | 36.0% | 43.0% | Salma et al., |
| [1] | ABDULMLIK A, MILAD P, SINA T, et al., 2021. Long-term trends in the contribution of PM2.5 sources to organic carbon (OC) in the Los Angeles basin and the effect of PM2.5 emission regulations[J]. Faraday Discussions, 226: 74-99. |
| [2] | ANDERSSON A, DENG J J, DU K, et al., 2015. Regionally-varying combustion sources of the January 2013 severe haze events over Eastern China[J]. Environmental Science & Technology, 49(4): 2038-2043. |
| [3] |
ANDREAE M O, 2007. Atmospheric aerosols versus greenhouse gases in the twenty-first century[J]. Philosophical Transactions of the Royal Society a-Mathematical Physical and Engineering Sciences, 365(1856): 1915-1923.
PMID |
| [4] |
BAUER J J, XIAO Y Y, ROBERT C, et al., 2009. Characterization of the sunset semi-continuous carbon aerosol analyzer[J]. Journal of The Air And Waste Management Association, 59(7): 826-833.
PMID |
| [5] | CHAN K L, 2017. Biomass burning sources and their contributions to the local air quality in Hong Kong[J]. Science of The Total Environment, 596(597): 212-221. |
| [6] | CHEN J M, LI C L, RISTOVSKI Z, et al., 2017. A review of biomass burning: Emissions and impacts on air quality, health and climate in China[J]. Science of the Total Environment, 579: 1000-1034. |
| [7] | CHEN Y, XIE S D, LUO B, et al., 2014. Characteristics and origins of carbonaceous aerosol in the Sichuan Basin, China[J]. Atmospheric Environment, 94: 215-223. |
| [8] | CHENG Z, WANG S, FU X, et al., 2014. Impact of biomass burning on haze pollution in the Yangtze River delta, China: A case study in summer 2011[J]. Atmospheric Chemistry and Physics, 14(9): 4573-4585. |
| [9] | CHU S H, 2005. Stable estimate of primary OC/EC ratios in the EC tracer method[J]. Atmospheric Environment, 39(8): 1383-1392. |
| [10] | CONSTANTIMI S, DIMLTRA V, ATHANASIOS S, et al., 2014. Organic and elemental carbon associated to PM10 and PM2.5 at urban sites of northern Greece[J]. Environmental Science and Pollution Research, 21(3): 1769-1785. |
| [11] | DAI S, BI X, CHAN L Y, et al., 2015. Chemical and stable carbon isotopic composition of PM2.5 from on-road vehicle emissions in the PRD region and implications for vehicle emission control policy[J]. Atmospheric Chemistry and Physics, 15(6): 3097-3108. |
| [12] | DANILO C, MARIO C, CELIA A, et al., 2016. A one-year record of carbonaceous components and major ions in aerosols from an urban kerbside location in Oporto, Portugal[J]. Science of the Total Environment, 562: 822-833. |
| [13] |
DING J J, HUANG W, ZHAO J, et al., 2022. Characteristics and source origins of carbonaceous aerosol in fine particulate matter in a megacity, Sichuan Basin, southwestern China[J]. Atmospheric Pollution Research, 13(1): 101266.
DOI URL |
| [14] | DING X, WANG X M, GAO B, et al., 2012. Tracer-based estimation of secondary organic carbon in the Pearl River Delta, south China[J]. Journal of Geophysical Research: Atmospheres, 117(D5): D05313. |
| [15] |
DUAN J C, TAN J H, CHENG D X, et al., 2007. Sources and characteristics of carbonaceous aerosol in two largest cities in Pearl River Delta Region, China[J]. Atmospheric Environment, 41(14): 2895-2903.
DOI URL |
| [16] |
GAO J, PENG X, CHEN G, et al., 2016. Insights into the chemical characterization and sources of PM2.5 in Beijing at a 1-h time resolution[J]. Science of the Total Environment, 542(15): 162-171.
DOI URL |
| [17] | HU W W, HU M, DENG Z Q, et al., 2012. The characteristics and origins of carbonaceous aerosol at a rural site of PRD in summer of 2006[J]. Atmospheric Chemistry and Physics, 12(4): 1811-1822. |
| [18] |
JI D S, ZHANG J K, HE J, et al., 2016. Characteristics of atmospheric organic and elemental carbon aerosols in urban Beijing, China[J]. Atmospheric Environment, 125: 293-306.
DOI URL |
| [19] |
JUNG J S, LEE S, KIM H, et al., 2014. Quantitative determination of the biomass-burning contribution to atmospheric carbonaceous aerosols in Daejeon, Korea, during the rice-harvest period[J]. Atmospheric Environment, 89: 642-650.
DOI URL |
| [20] |
KWANGSAM N, ANIKET A S, CHEN S, et al., 2004. Primary and secondary carbonaceous species in the atmosphere of Western Riverside County, California[J]. Atmospheric Environment, 38(9): 1345-1355.
DOI URL |
| [21] | LI H M, WANG Q G, YANG M, et al., 2016. Chemical characterization and source apportionment of PM2.5 aerosols in a megacity of Southeast China[J]. Atmosperic Research, 181: 288-299. |
| [22] |
LIM H J, TURPIN B J, 2002. Origins of primary and secondary organic aerosol in Atlanta: Results’ of time-resolved measurements during the Atlanta supersite experiment[J]. Environmental Science & Technology, 36(21): 4489-4496.
DOI URL |
| [23] |
LU M H, ZHENG J Y, HUANG Z J, et al., 2021. Insight into the characteristics of carbonaceous aerosols at urban and regional sites in the downwind area of Pearl River Delta region, China[J]. Science of the Total Environment, 778: 146251.
DOI URL |
| [24] |
MAKIKO Y, FUMIKAZU I, HIRONORI N, et al., 2021. Trends in PM2.5 concentration in Nagoya, Japan, from 2003 to 2018 and impacts of PM2.5 Countermeasures[J]. Atmosphere, 12(5): 590.
DOI URL |
| [25] |
PACHON J E, WEBER R J, ZHANG X L, et al., 2013. Revising the use of potassium (K) in the source apportionment of PM2.5[J]. Atmospheric Pollution Research, 4(1): 14-21.
DOI URL |
| [26] | PIO C A, LEGRAND M, OLIVEIRA J, et al., 2007. Climatology of aerosol composition (organic versus inorganic) at non-urban areas on a West-East transect across Europe[J]. Journal of Geophysical Research, 112: D23 S02. |
| [27] |
POSCHIL U, 2005. Atmospheric aerosols: Composition, transformation, climate and health effects[J]. Angewandte Chemie-International Edition, 44(46): 7520-7540.
PMID |
| [28] | SALMA I, VASANITS-ZSIGRAI A, MACHON A, et al., 2020. Fossil fuel combustion, biomass burning and biogenic sources of fine carbonaceous aerosol in the Carpathian Basin[J]. Atmospheric Chemistry and Physics, 20(7): 4295-4312. |
| [29] |
TURPIN B J, HUNTZICHER J J, 1995. Identification of secondary organic aerosol episodes and quantification of primary and secondary organic aerosol concentrations during SCAQS[J]. Atmospheric Environment, 29(23): 3527-3544.
DOI URL |
| [30] | WANG B L, LIU Y, SHAO M, et al., 2016. The contributions of biomass burning to primary and secondary organics: A case study in Pearl River Delta (PRD), China[J]. Science of the Total Environment, 569-570: 548-556. |
| [31] | WANG H B, MI T, CHEN Y, et al., 2018. Seasonal characteristics, formation mechanisms and source origins of PM2.5 in two megacities in Sichuan Basin, China[J]. Atmospheric Chemistry and Physics, 18(2): 865-881. |
| [32] |
WU C, WU D, YU J Z, 2019. Estimation and uncertainty analysis of secondary organic carbon using 1 year of hourly organic and elemental carbon data[J]. Journal of Geophysical Research: Atmospheres, 124(5): 2774-2795.
DOI URL |
| [33] | WU C, YU J Z, 2016. Determination of primary combustion source organic carbon-to-elemental carbon (OC/EC) ratio using ambient OC and EC measurements: secondary OC-EC correlation minimization method[J]. Atmospheric Chemistry and Physics, 16(8): 5453-5465. |
| [34] |
WU J, KONG S F, WU F Q, et al., 2020. The moving of high emission for biomass burning in China: View from multi-year emission estimation and human-driven forces[J]. Environment International, 142: 105812.
DOI URL |
| [35] | YAO L, YANG L X, CHEN J M, et al., 2016. Characteristics of carbonaceous aerosols: Impact of biomass burning and secondary formation in summertime in a rural area of the North China Plain[J]. Science of the Total Environment, 557-558: 520-530. |
| [36] | ZHANG Y L, HUANG R J, ELHADDAD I, et al., 2015. Fossil vs. non-fossil sources of fine carbonaceous aerosols in four Chinese cities during the extreme winter haze episode of 2013[J]. Atmospheric Chemistry and Physics, 15(3): 1299-1312. |
| [37] | ZHAO M F, ZHAO S H, QIAO T, et al., 2015. Chemical characterization, the transport pathways and potential sources of PM2.5 in Shanghai: Seasonal variations[J]. Atmospheric Research, 158-159: 66-78 |
| [38] |
ZHUANG Y, LI R Y, YANG H, et al., 2018. Understanding temporal and spatial distribution of crop residue burning in China from 2003 to 2017 using MODIS data[J]. Remote Sensing, 10(3): 390.
DOI URL |
| [39] | 常青, 2015. 石家庄市环境颗粒物中有机碳/元素碳(OC/EC)分布特征的研究[D]. 石家庄: 河北科技大学. |
| CHANG Q, 2015. Study on the distribution characteristics of organic and elemental carbon in atmospheric particles in Shijiazhuang city[D]. Shijiazhuang: Hebei University of Science and Technology. | |
| [40] | 陈超玲, 杨阳, 谢光辉, 2016. 我国秸秆资源管理政策发展研究[J]. 中国农业大学学报, 21(8): 1-11. |
| CHEN C L, YANG Y, XIE G H, 2016. Study of the development of crop straw management policy in China[J]. Journal of China Agricultural University, 21(8): 1-11. | |
| [41] | 陈仕意, 曾立民, 董华斌, 等, 2015. 华北地区乡村站点 (曲周) 夏季PM2.5中二次无机组分的生成机制与来源解析[J]. 环境科学, 36(10): 3554-3565. |
| CHEN S Y, ZENG L M, DONG H B, et al., 2015. Transformation mechanism and sources of secondary inorganic components in PM2.5 at an agriculture site (Quzhou) in the North China plain in summer[J]. Environmental Science, 36(10): 3554-3565. | |
| [42] | 丁晴, 刘建国, 陆亦怀, 等, 2012. 广州亚运期间鹤山大气颗粒物及碳组分的分析[J]. 环境科学与技术, 35(7): 43-49. |
| DING Q, LIU J G, LU Y H, et al., 2012. Measurement and analysis of particulate matter and carbonaceous aerosol in Heshan during Guangzhou Asian Games[J]. Environmental Science & Technology, 35(7): 43-49. | |
| [43] | 何一滢, 韩志伟, 刘瑞婷, 等, 2019. 秸秆燃烧对北京秋季气溶胶浓度和短波辐射影响的模拟研究[J]. 气候与环境研究, 24(3): 369-382. |
| HE Y Y, HAN Z W, LIU R T, et al., 2019. A modeling investigation of the impact of crop residue burning on aerosol concentration and shortwave radiation in Beijing in autumn[J]. Climatic and Environmental Research, 24(3): 369-382. | |
| [44] | 胡起超, 胡恭任, 于瑞莲, 等, 2016. 厦门市冬季大气PM2.5中有机碳和元素碳的污染特征[J]. 地球与环境, 44(3): 336-341. |
| HU Q C, HU G R, YU R L, et al., 2016. Characteristics of organic carbon (OC) and elemental carbon (EC) in PM2.5 in winter in Xiamen City, China[J]. Earth and Environment, 44(3): 336-341. | |
| [45] | 柯华兵, 龚山陵, 何建军, 等, 2020. 露天生物质燃烧对地面PM2.5浓度的影响评估[J]. 应用气象学报, 31(1): 105-116. |
| KE H B, GONG S L, HE J J, 2020. Assessment of open biomass burning impacts on surface PM2.5 concentration[J]. Journal of Applied Meteorological Science, 31(1): 105-116. | |
| [46] | 李恒庆, 丁椿, 潘光, 等, 2019. 济南市居住区采暖季大气PM2.5中碳组分构成及变化分析[J]. 生态环境学报, 28(9): 1810-1817. |
| LI H Q, DING C, PAN G, et al., 2019. Analysis on the composition and change of carbon components in PM2.5 of residential area in Jinan during heating period[J]. Ecology and Environmental Sciences, 28(9): 1810-1817. | |
| [47] | 区宇波, 岳钉利, 钟流举, 等, 2013. 中国广东大气超级监测站的规划建设与运行机制研究[J]. 环境科学与管理, 38(11): 1674-6139. |
| OU Y B, YUE D L, ZHONG L J, et al., 2013. Establishment and operational management mechanism of Guangdong Atmospheric Supersite of China[J]. Environmental Science and Management, 38(11): 1674-6139. | |
| [48] | 彭立群, 张强, 贺克斌, 2016. 基于调查的中国秸秆露天焚烧污染物排放清单[J]. 环境科学研究, 29(8): 1109-1118. |
| PENG L Q, ZHANG Q, HE K B, 2016. Emission inventory of atmospheric pollutants from open burning of crop residues in China based on a national Questionnaire[J]. Research of Environmental Sciences, 2(8): 1109-1118. | |
| [49] | 申铠君, 张向云, 刘頔, 等, 2016. 华北典型城市PM2.5中碳质气溶胶的季节变化与组成特征[J]. 生态环境学报, 25(3): 458-463. |
| SHEN K J, ZHANG X Y, LIU D, et al., 2016. Characterization and seasonal variation of carbonaceous aerosol in urban atmosphere of a typical city in north China[J]. Ecology and Environmental Sciences, 25(3): 458-463. | |
| [50] | 孙西勃, 廖程浩, 曾武涛, 等, 2018. 广东省秸秆燃烧大气污染物及VOCs物种排放清单[J]. 环境科学, 39(9): 3995-4001. |
| SUN X B, LIAO C H, ZENG W T, et al., 2018. Emission inventory of atmospheric pollutants and VOC species from crop residue burning in Guangdong province[J]. Environmental Science, 39(9): 3995-4001. | |
| [51] | 王帆, 韩婧, 张俊, 等, 2015. 西安城区大气PM2.5中有机碳与元素碳的污染特征[J]. 环境保护科学, 41(2): 80-85. |
| WANG F, HAN J, ZHANG J, et al., 2015. Simple analysis of polltion characteristics of organic carbon and elemental carbon in PM2.5 in the atmosphere of Xi’an city[J]. Environmental Protection Science, 41(2): 80-85. | |
| [52] | 王顺天, 2021. 基于Himawari-8卫星火点反演及中国区域生物质燃烧环境效应探究[D]. 合肥: 中国科学技术大学. |
| WANG S T, 2021. Retrieval of active fire based on Himawari-8 and exploration of environmental effects of biomass burning in China[D]. Hefei: University of Science and Technology of China. |
| [1] | 董洁芳, 邓椿, 张仲伍. 渭河流域PM2.5时空演化及人口暴露风险[J]. 生态环境学报, 2023, 32(6): 1078-1088. |
| [2] | 李建辉, 党争, 陈琳. 黄河几字弯都市圈PM2.5时空特征及影响因素分析[J]. 生态环境学报, 2023, 32(4): 697-705. |
| [3] | 张莉, 李铖, 谭皓泽, 韦家怡, 程炯, 彭桂香. 广州典型城市林地对大气颗粒物的削减效应及影响因素[J]. 生态环境学报, 2023, 32(2): 341-350. |
| [4] | 江明, 张子洋, 李婷婷, 林勃机, 张正恩, 廖彤, 袁鸾, 潘苏红, 李军, 张干. 基于氮同位素的珠三角典型地区大气PM2.5中NH4+来源解析[J]. 生态环境学报, 2022, 31(9): 1840-1848. |
| [5] | 魏小锋, 韩红, 闫学军, 王在峰, 李圣增, 田勇, 梁第, 马明亮, 张桂芹. 基于卫星遥感与CMB模型的济南市冬季重污染过程PM2.5溯源分析[J]. 生态环境学报, 2022, 31(6): 1175-1183. |
| [6] | 王薇, 程歆玥. 合肥市不同功能街道峡谷PM2.5和PM10时空分布特征及影响因素分析[J]. 生态环境学报, 2022, 31(3): 524-534. |
| [7] | 赵锐, 詹梨苹, 周亮, 张军科. 地理探测联合地理加权岭回归的PM2.5驱动因素分析[J]. 生态环境学报, 2022, 31(2): 307-317. |
| [8] | 邢冉, 沈国锋, 程和发, 陶澍. 东北地区农村生活能源结构变迁及其对区域污染物排放的影响[J]. 生态环境学报, 2022, 31(12): 2367-2373. |
| [9] | 李圣增, 郝赛梅, 谭路遥, 张怀成, 徐标, 谷树茂, 潘光, 王淑妍, 闫怀忠, 张桂芹. 济南市PM2.5中二次组分的时空变化特征及其影响因素[J]. 生态环境学报, 2022, 31(1): 100-109. |
| [10] | 石慧斌, 黄艺, 程馨, 李婷, 何敏, 王进进. 成都市冬季PM2.5中碳组分污染特征及来源解析[J]. 生态环境学报, 2021, 30(7): 1420-1427. |
| [11] | 王薇, 程歆玥, 胡春, 夏斯涵, 王甜. 城市街道峡谷PM2.5时空分布特征与空气质量评价——以合肥市长淮街道为例[J]. 生态环境学报, 2021, 30(11): 2157-2164. |
| 阅读次数 | ||||||
|
全文 |
|
|||||
|
摘要 |
|
|||||