生态环境学报 ›› 2021, Vol. 30 ›› Issue (11): 2165-2174.DOI: 10.16258/j.cnki.1674-5906.2021.11.007
宋鑫博( ), 黄鹤(), 郭军, 熊明明
收稿日期:2021-03-12
出版日期:2021-11-18
发布日期:2021-12-29
通讯作者:
* 黄鹤(1983年生),男,高级工程师,主要研究领域为城市气候。E-mail: huanghe04@aliyun.com作者简介:宋鑫博(1986年生),男,工程师,主要研究领域为城市环境遥感、自然灾害遥感监测与评估。E-mail: songxb086@sina.com
基金资助:
SONG Xinbo(), HUANG He(), GUO Jun, XIONG Mingming
Received:2021-03-12
Online:2021-11-18
Published:2021-12-29
摘要:
近年来天津快速城市化进程导致人口数量迅猛增加,土地开发强度明显上升。随着城市环境的变化,城市热岛效应日趋显著。当前通过优化城市形态缓解热岛效应被认为是很有潜力的调控措施,但针对天津城市形态要素定量化表达及其对地表热环境综合影响机制的研究仍然较少。利用Landsat 8遥感影像数据和清华大学研发的全球10 m分辨率土地覆盖数据,以天津中心城区为例,研究了城市形态对夏季热环境的影响。首先将天津市中心城区按边长120 m基本单元进行网格化处理,然后通过遥感反演解译和空间分析方法计算各网格内平均地表温度与关键形态要素,最后比较Ordinary Least Squares(OLS)模型与Spatial Lag Model(SLM)模型的优劣并选取最优模型深入剖析建筑密度、天空开阔度、容积率、绿化率等指标对地表温度综合影响及季节变化规律。结果表明,(1)天津中心城区形态要素表现出一定的空间分布规律:不透水层百分比呈现单核聚集空间分布;绿地率呈现出点状分布为主、线面结合的空间分布格局;水体百分比高值主要分布于城市河网、大型水体;建筑高度呈现从市中心到郊区呈现逐渐降低的趋势;天空开阔度从市中心至郊区逐渐增大;建筑密度与土地开发强度密切相关,工业园区、商业中心和老旧居民区普遍在52%以上;高容积率地区沿海河呈三角形松散分布。(2)相比于OLS模型,SLM可更好的解释地理事物的空间关系,是研究城市热环境影响机理的有效方法。(3)城市形态对地表温度综合影响分析结果表明,不同形态要素组合方式下要素的热环境影响排序发生显著变化,并且表现一定季节变化规律。对于地表温度,水体百分比、绿地率、建筑高度是负贡献指标,不透水百分比、天空开阔度、建筑密度是正贡献指标,而容积率表现出对地表温度的双向调节作用。研究成果可为社区建筑布局、城市发展规划以及改善城市生态环境提供参考依据。
中图分类号:
宋鑫博, 黄鹤, 郭军, 熊明明. 城市形态对夏季热环境影响研究——以天津中心城区为例[J]. 生态环境学报, 2021, 30(11): 2165-2174.
SONG Xinbo, HUANG He, GUO Jun, XIONG Mingming. Research on the Impact of Urban Morphology on Thermal Environment in Summer: A Case of Tianjin Central City[J]. Ecology and Environment, 2021, 30(11): 2165-2174.

图1 研究区概况 数据来源:FROM-GLC10数据集
Fig. 1 Overview of the study area Data source: FROM-GLC10 dataset
| 等级 Level | 分级标准Classification standard | 夏季地表温度 Summer lst/℃ |
|---|---|---|
| 极低温区 Extremely Low LST Zone | ts≤tm-2.5tstd | 27.76-29.35 |
| 低温区 Low LST Zone | tm-2.5tstd<ts≤tm-1.5tstd | 29.35-32.16 |
| 较低温区 Relative Low LST Zone | tm-1.5tstd<ts≤tm-0.5tstd | 32.16-34.97 |
| 中温区 Medium LST Zone | tm-0.5tstd<ts≤tm+0.5tstd | 34.97-37.78 |
| 较高温区 Relative High LST Zone | tm+0.5tstd<ts≤tm+1.5tstd | 37.78-40.59 |
| 高温区 High LST Zone | tm+1.5tstd<ts≤tm+2.5tstd | 40.59-43.40 |
| 极高温区 Extemely High LST Zone | ts>tm+2.5tstd | 43.40-49.89 |
表1 地表温度分级标准
Table 1 Classification criteria for land surface temperature
| 等级 Level | 分级标准Classification standard | 夏季地表温度 Summer lst/℃ |
|---|---|---|
| 极低温区 Extremely Low LST Zone | ts≤tm-2.5tstd | 27.76-29.35 |
| 低温区 Low LST Zone | tm-2.5tstd<ts≤tm-1.5tstd | 29.35-32.16 |
| 较低温区 Relative Low LST Zone | tm-1.5tstd<ts≤tm-0.5tstd | 32.16-34.97 |
| 中温区 Medium LST Zone | tm-0.5tstd<ts≤tm+0.5tstd | 34.97-37.78 |
| 较高温区 Relative High LST Zone | tm+0.5tstd<ts≤tm+1.5tstd | 37.78-40.59 |
| 高温区 High LST Zone | tm+1.5tstd<ts≤tm+2.5tstd | 40.59-43.40 |
| 极高温区 Extemely High LST Zone | ts>tm+2.5tstd | 43.40-49.89 |
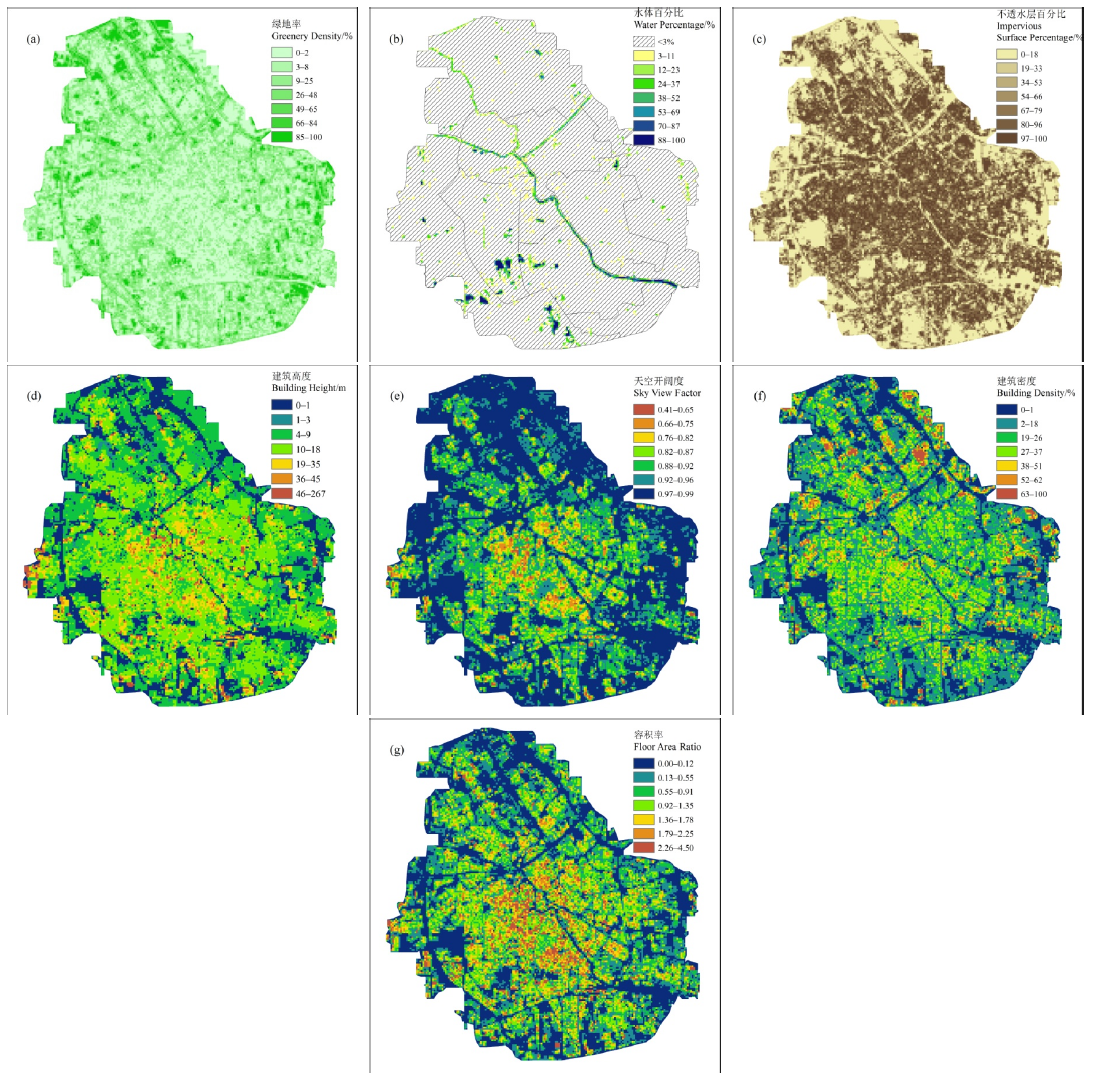
图2 研究区形态要素空间分布 (a)绿地率、(b)水体面积百分比、(c)不透水层百分比、(d)建筑高度、(e)天空开阔度、(f)建筑密度、(g)容积率
Fig. 2 Spatial distribution of morphology factors in study area (a) Greenery density, (b) Water percentage, (c) Impervious surface percentage, (d) Building height, (e) Sky view factor, (f) Building density, (g) Floor area ratio

图3 研究区夏季地表温度空间分布
Fig. 3 Spatial distribution of land surface temperature in the study area in summer
| 模型比较Model comparison | 最小二乘法 OLS | 空间滞后模型SLM |
|---|---|---|
| 决定系数 r2 | 0.562 | 0.794 |
| 赤池信息量准则 AIC | 115230 | 97584.5 |
| 施瓦兹准则 SC | 115296 | 97658.4 |
表2 回归模型比较结果
Table 2 Comparation results of regression model
| 模型比较Model comparison | 最小二乘法 OLS | 空间滞后模型SLM |
|---|---|---|
| 决定系数 r2 | 0.562 | 0.794 |
| 赤池信息量准则 AIC | 115230 | 97584.5 |
| 施瓦兹准则 SC | 115296 | 97658.4 |
| 空间滞后模型 SLM | 实验1 Experiment 1 | 实验2 Experiment 2 | 实验3 Experiment 3 | 实验4 Experiment 4 | 实验5 Experiment 5 | 实验6 Experiment 6 | 实验7 Experiment 7 | 实验8 Experiment 8 |
|---|---|---|---|---|---|---|---|---|
| 不透水层百分比 ISP | 0.6508*** | 0.7098*** | 0.4315*** | 0.57821*** | 0.6382*** | 0.4628*** | 0.5164*** | 0.5245*** |
| 绿地率 GD | -2.3861*** | -2.4856*** | -1.9160*** | -2.2489*** | -2.3014*** | -1.9677*** | -2.0513*** | -2.0609*** |
| 水体百分比 WP | -3.8969*** | -3.9520*** | -3.5111*** | -3.8150*** | -3.8249*** | -3.5271*** | -3.5755*** | -3.5961*** |
| 天空开阔度 SVF | — | 1.3362*** | — | — | 6.7841** | — | 2.3201*** | 4.1298*** |
| 建筑密度 BD | — | — | 2.5876*** | — | — | 2.9361*** | 2.7912*** | 2.3032*** |
| 容积率 FAR | — | — | — | 0.1609*** | 0.6931*** | -0.1358*** | — | 0.2522*** |
| 决定系数 r2 | 0.779 | 0.781 | 0.791 | 0.781 | 0.789 | 0.791 | 0.793 | 0.794 |
表3 空间滞后模型拟合结果
Table 3 Results of spatial lag model
| 空间滞后模型 SLM | 实验1 Experiment 1 | 实验2 Experiment 2 | 实验3 Experiment 3 | 实验4 Experiment 4 | 实验5 Experiment 5 | 实验6 Experiment 6 | 实验7 Experiment 7 | 实验8 Experiment 8 |
|---|---|---|---|---|---|---|---|---|
| 不透水层百分比 ISP | 0.6508*** | 0.7098*** | 0.4315*** | 0.57821*** | 0.6382*** | 0.4628*** | 0.5164*** | 0.5245*** |
| 绿地率 GD | -2.3861*** | -2.4856*** | -1.9160*** | -2.2489*** | -2.3014*** | -1.9677*** | -2.0513*** | -2.0609*** |
| 水体百分比 WP | -3.8969*** | -3.9520*** | -3.5111*** | -3.8150*** | -3.8249*** | -3.5271*** | -3.5755*** | -3.5961*** |
| 天空开阔度 SVF | — | 1.3362*** | — | — | 6.7841** | — | 2.3201*** | 4.1298*** |
| 建筑密度 BD | — | — | 2.5876*** | — | — | 2.9361*** | 2.7912*** | 2.3032*** |
| 容积率 FAR | — | — | — | 0.1609*** | 0.6931*** | -0.1358*** | — | 0.2522*** |
| 决定系数 r2 | 0.779 | 0.781 | 0.791 | 0.781 | 0.789 | 0.791 | 0.793 | 0.794 |

图4 城市形态要素与地表温度相关性季节变化热力图
Fig. 4 Heat map of seasonal variation of correlation between urban morphology factors and land surface temperature
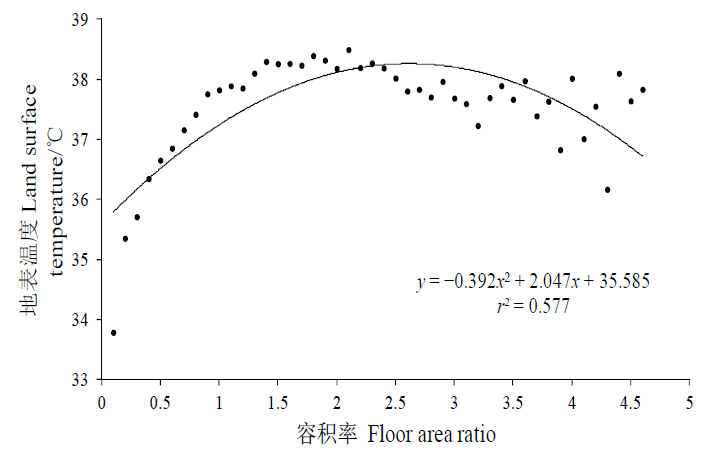
图5 容积率与平均地表温度散点图
Fig. 5 Scatter diagram of floor area ratio and average land surface temperature
| [1] |
ALAVIPANAH S, SCHREYER J, HAASE D, et al., 2018. The effect of multi-dimensional indicators on urban thermal conditions[J]. Journal of Cleaner Production, 177: 115-123.
DOI URL |
| [2] | BERGER C, ROSENTRETER J, VOLTERSEN M, et al., 2017. Spatio-temporal analysis of the relationship between 2D/3D urban site characteristics and land surface temperature[J]. RemoteSensing of Environment, 193: 225-243. |
| [3] |
ESTOQUE R C, MURAYAMA Y, MYINT S W, 2017. Effects of landscape composition and pattern on land surface temperature: An urban heat island study in the megacities of Southeast Asia[J]. Science of the Total Environment, 577: 349-359.
DOI URL |
| [4] |
GÁI T, LINDBERG F, UNGER J, 2009. Computing continuous sky view factors using 3D urban raster and vector databases: comparison and application to urban climate[J]. Theoretical and Applied Climatology, 95(1): 111-123.
DOI URL |
| [5] |
GONG P, LIU H, ZHANG M N, et al., 2019. Stable classification with limited sample: transferring a 30-m resolution sample set collected in 2015 to mapping 10-m resolution global land cover in 2017 [J]. Science Bulletin, 64(6): 370-373.
DOI URL |
| [6] |
GUO G H, ZHOU X Q, WU Z F, et al., 2016. Characterizing the impact of urban morphology heterogeneity on land surface temperature in Guangzhou, China[J]. Environmental Modelling and Software, 84: 427-439.
DOI URL |
| [7] |
HUANG X, WANG Y, 2019. Investigating the effects of 3D urban morphology on the surface urban heat island effect in urban functional zones by using high-resolution remote sensing data: a case study of Wuhan, Central China[J]. ISPRS Journal of Photogrammetry and Remote Sensing, 152: 119-131.
DOI URL |
| [8] |
LIU Y X, PENG J, WANG Y L, 2018. Efficiency of landscape metrics characterizing urban land surface temperature[J]. Landscape and Urban Planning, 180: 36-53.
DOI URL |
| [9] |
MASOUDI M, TAN P Y, 2019. Multi-year comparison of the effects of spatial pattern of urban green spaces on urban land surface temperature[J]. Landscape and Urban Planning, 184: 44-58.
DOI URL |
| [10] |
PENG J, JIA J L, LIU Y X, et al., 2018. Seasonal contrast of the dominant factors for spatial distribution of land surface temperature in urban areas[J]. Remote Sensing of Environment, 215: 255-267.
DOI URL |
| [11] |
SCARANO M, MANCINI F, 2017. Assessing the relationship between sky view factor and land surface temperature to the spatial resolution[J]. International Journal of Remote Sensing, 38(23): 6910-6929.
DOI URL |
| [12] |
TONG S S, WONG N H, TAN C L, et al., 2017. Impact of urban morphology on microclimate and thermal comfort in northern China[J]. Solar Energy, 155: 212-213.
DOI URL |
| [13] |
WATSON I D, JOHNSON G T, 1987. Graphical estimation of sky view-factors in urban environments[J]. Journal of Climatology, 7(2): 193-197.
DOI URL |
| [14] |
XU Y, REN C, MA P F, et al., 2017. Urban morphology detection and computation for urban climate research[J]. Landscape and Urban Planning, 167: 212-224.
DOI URL |
| [15] | YU S Y, CHEN Z Q, YU B L, et al., 2020. Exploring the relationship between 2D/3D landscape pattern and land surface temperature based on explainable eXtreme Gradient Boosting tree: A case study of Shanghai, China[J]. Science of The Total Environment, 725(1): 138-229. |
| [16] | ZHENG Z, ZHOU W Q, YAN J L, et al., 2019. The higher, the cooler? Effects of building height on land surface temperatures in residential areas of Beijing[J]. Physics and Chemistry of the Earth, 110: 149-156. |
| [17] |
ZHOU W Q, WANG J, CADENASSO, 2017. Effects of the spatial configuration of trees on urban heat mitigation: A comparative study[J]. Remote Sensing of Environment, 195: 1-12.
DOI URL |
| [18] | 蔡智, 韩贵锋, 2018. 山地城市空间形态的地表热环境效应--基于LCZ的视角[J]. 山地学报, 36(4): 617-627. |
| CAI Z, HAN G F, 2018. Assessing land surface temperature in the mountain city with different urban spatial form based on Local Climate Zone scheme[J]. Mountain Research, 36(4): 617-627. | |
| [19] | 曹爱丽, 张浩, 张艳, 等, 2008. 上海近50年气温变化与城市化发展的关系[J]. 地球物理学报, 51(6): 1663-1669. |
| CAO A L, ZHANG H, ZHANG Y, et al., 2008. Decadal changes of air temperature in Shanghai in recent 50 years and its relation to urbanization[J]. Chinese Journal of Geophysics, 51(6): 1663-1669. | |
| [20] | 陈康林, 龚建周, 陈晓越, 等, 2016. 广州城市绿色空间与地表温度的格局关系研究[J]. 生态环境学报, 25(5): 842-849. |
| CHEN K L, GONG J Z, CHEN X Y, et al., 2016. The pattern relationship research of green space and surface temperature in Guangzhou city[J]. Ecology and Environmental Sciences, 25(5): 842-849. | |
| [21] | 邓睿, 刘亮, 徐二丽, 2017. 基于Landsat时间序列数据的重庆市热力景观格局演变分析[J]. 生态环境学报, 26(8): 1349-1357. |
| DENG R, LIU L, XU E L, 2017. Study on the evolution of thermal landscape pattern in Chongqing city based on time-serieslandsat data[J]. Ecology and Environmental Sciences, 26(8): 1349-1357. | |
| [22] | 丁海燕, 李丽平, 扈海波, 等, 2014. 夏季高温天气类型与人体健康关系初探[J]. 干旱区资源与环境, 28(9): 122-128. |
| DING H Y, LI L P, HU H B, et al., 2014. Weather classification in summer of Beijing and its impact on human health[J]. Journal of Arid Land Resources and Environment, 28(9): 122-128. | |
| [23] |
冯章献, 王士君, 金珊合, 等, 2019. 长春市城市形态及风环境对地表温度的影响[J]. 地理学报, 74(5): 902-911.
DOI |
| FENG Z X, WANG S J, JIN S H, et al., 2019. Effects of urban morphology and wind conditions on land surface temperature in Changchun[J]. Acta Geographica Sinica, 74(5): 902-911. | |
| [24] | 郭宇, 王宏伟, 张喆, 等, 2020. 南京市热环境与地表覆被的时空尺度效应及驱动机制研究[J]. 生态环境学报, 29(7): 1403-1411. |
| GUO Y, WANG H W, ZHANG Z, et al., 2020. Spatio-temporal scale effect and driving mechanism of thermal environment and land surface cover in Nanjing[J]. Ecology and Environmental Sciences, 29(7): 1403-1411. | |
| [25] | 胡家昱, 刘丙军, 2019. 基于空间自回归和地理加权回归模型的佛山市中心城区河网水系演变驱动分析[J]. 水文, 39(2): 7-13. |
| HU J Y, LIU B J, 2019. Analysis of river network changes based on spatial auto-regression and geo-graphic weighted regression model[J]. Journal of China Hydrology, 39(2): 7-13. | |
| [26] | 黄利萍, 苗峻峰, 刘月琨, 2012. 天津城市热岛效应的时空变化特征[J]. 大气科学学报, 35(5):620-632. |
| HUANG L P, MIAO J F, LIU Y K, 2012. Spatial and temporal variation characteristics of urban heat island in Tianjin[J]. Journal of Nanjing Institute of Meteorology, 35(5): 620-632. | |
| [27] |
江颖慧, 焦利民, 张博恩, 2018. 城市地表温度与NDVI空间相关性的尺度效应[J]. 地理科学进展, 37(10): 1362-1370.
DOI |
| JIANG Y H, JIAO L M, ZHANG B E, 2018. Scale effect of the spatial correlation between urban land surface temperature and NDVI[J]. Progress in Geography, 37(10): 1362-1370. | |
| [28] | 孔繁花, 尹海伟, 刘金勇, 等, 2013. 城市绿地降温效应研究进展与展望[J]. 自然资源学报, 28(1): 171-181. |
| KONG F H, YIN H W, LIU J Y, et al., 2013. A review of research on the urban green space cooling effect[J]. Journal of Natural Resources, 28(1): 171-181. | |
| [29] | 李孝永, 匡文慧, 2019. 北京、天津和石家庄城市地表覆盖组分与结构特征对地表温度的影响[J]. 生态学杂志, 38(10): 3057-3065. |
| LI X Y, KUANG W H, 2019. The effects of urban land cover composition and structure on land surface temperature in Beijing, Tianjin, and Shijiazhuang[J]. Chinese Journal of Ecology, 38(10): 3057-3065. | |
| [30] | 梁保平, 马艺芳, 李晖, 2015. 桂林市典型园林绿地与水体的降温效应研究[J]. 生态环境学报, 24(2): 278-285. |
| LIANG B P, MA Y F, LI H, 2015. Research on cooling effect of the landscape green space and urban water in Guilin city[J]. Ecology and Environmental Sciences, 24(2): 278-285. | |
| [31] | 梁荣, 陈秉正, 2019. 气候变化背景下全球极端天气事件GDP损失率评估[J]. 系统工程理论与实践, 39(3): 557-568. |
| LIANG R, CHEN B Z, 2019. Damage assessment of extreme weather events under climate change[J]. Systems Engineering-Theory & Practice, 39(3): 557-568. | |
| [32] | 刘丹, 于成龙, 2018. 城市扩张对热环境时空演变的影响--以哈尔滨为例[J]. 生态环境学报, 27(3): 509-517. |
| LIU D, YU C L. 2018. Urban expansion and its influence on spatio-temporal variation of thermal environment: A case study of Harbin city[J]. Ecology and Environmental Sciences, 27(3): 509-517. | |
| [33] | 潘玥, 廖明伟, 廖明, 等, 2017. 鄱阳湖核心流域地区城市地表形态的异质性对地表温度的影响研究[J]. 生态环境学报, 26(8): 1358-1367. |
| PAN Y, LIAO M W, LIAO M, et al., 2017. Study on the impacts of urban morphology heterogeneity on land temperature in the core area of Poyang Lake[J]. Ecology and Environmental Sciences, 26(8): 1358-1367. | |
| [34] | 孙喆, 2020. 高密度城区形态要素对热环境的影响作用--以北京市五环内区域为例[J]. 生态环境学报, 29(10): 2020-2027. |
| SUN Z, 2020. Impact of urban morphology factors on thermal environment in high density urban areas: A case of Beijing within 5th ring road[J]. Ecology and Environmental Sciences, 29(10): 2020-2027. | |
| [35] | 覃志豪, 李文娟, 徐斌, 等, 2004. 陆地卫星TM6波段范围内地表比辐射率的估计[J]. 国土资源遥感 (3): 29-41. |
| QIN Z H, LI W J, XU B, et al., 2004. The estimation of land surface emissivity for landsat TM6[J]. Remote Sensing for Land & Resources (3): 29-41. | |
| [36] | 王雪, 于德永, 曹茜, 等, 2017. 城市景观格局与地表温度的定量关系分析[J]. 北京师范大学学报(自然科学版), 53(3): 329-336. |
| WANG X, YU D Y, CAO Q, et al., 2017. Quantitative relationship between urban landscape pattern and surface temperature[J]. Journal of Beijing Normal University (Natural Science), 53(3): 329-336. | |
| [37] | 王耀斌, 赵永华, 韩磊, 等, 2017. 西安市景观格局与城市热岛效应的耦合关系[J]. 应用生态学报, 28(8): 2621-2628. |
| WANG Y B, ZHAO Y H, HAN L, et al., 2017. Coupling relationship of landscape pattern and urban heat island effect in Xi’an, China[J]. Chinese Journal of Applied Ecology, 28(8): 2621-2628. | |
| [38] | 魏胜龙, 陈志彪, 陈志强, 等, 2017. 微地形上太阳辐射模拟及与地表温度关系研究[J]. 国土资源遥感, 29(1): 129-135. |
| WEI S L, CHEN Z B, CHEN Z Q, et al., 2017. Simulation of the total solar radiation over micro-landform and correlation between the solar radiation and the land surface temperature[J]. Remote Sensing for Land and Resources, 29(1): 129-135. | |
| [39] | 邬尚霖, 2016. 建筑密度对街区热环境影响分析[J]. 华中建筑, 34(8): 52-56. |
| WU S L, 2016. Analysis of impact of building density on the block thermal environment[J]. Huazhong Architecture, 34(8): 52-56. | |
| [40] | 邬尚霖, 孙一民, 2015. 城市设计要素对热岛效应的影响分析--广州地区案例研究[J]. 建筑学报, 62(10): 79-82. |
| WU S L, SUN Y M, 2015. An Analysis of the Impact of Guangzhou's Urban Form on Heat Island Effect[J]. Architectural Journal, 62(10): 79-82. | |
| [41] | 徐涵秋, 2009. 城市不透水面与相关城市生态要素关系的定量分析[J]. 生态学报, 29(5): 2456-2462. |
| XU H Q, 2009. Quantitative analysis on the relationship of urban impervious surface with other components of urban ecosystem[J]. Acta Ecologica Sinica, 29(5): 2456-2462. | |
| [42] | 杨朝斌, 何兴元, 张树文, 等, 2016. 基于Landsat 8的城市热岛效应与地表因子关系研究--以长春市为例[J]. 干旱区资源与环境, 30(12): 110-115. |
| YANG C B, HE X Y, ZHANG S W, et al., 2016. Estimation of the relationship between urban heat island and land surface factors using Landsat 8 data: A case study in Changchun, China[J]. Journal of Arid Land Resources and Environment, 30(12): 110-115. | |
| [43] |
杨若, 敖祖锐, 张晶, 等, 2019. 中小尺度下植被冠层对屋顶表面温度的调控效应分析[J]. 地球信息科学学报, 21(7): 1097-1108.
DOI |
| YANG R, AO Z R, ZHANG J, et al., 2019. Effect of vegetation canopy on rooftop surface temperature at city block and building scale[J]. Journal of Geo-information Science, 21(7):1097-1108. | |
| [44] |
杨振山, 蔡建明, 2010. 空间统计学进展及其在经济地理研究中的应用[J]. 地理科学进展, 29(6): 757-768.
DOI |
| YANG Z S, CAI J M, 2010. Progress of spatial statistics and its application in economic geography[J]. Progress in Geography, 29(6): 757-768. | |
| [45] | 余德, 周卫军, 谭洁, 等, 2014. 洞庭湖区地表温度反演及其时空变化特征[J]. 生态环境学报, 23(11): 1799-1805. |
| YU D, ZHOU W J, TAN J, et al., 2014. Temporal and spatial variation characteristics of land surface temperature in Dongting Lake Region, Hunan province[J]. Ecology and Environmental Sciences, 23(11): 1799-1805. | |
| [46] | 张海龙, 祝善友, 高玚, 等, 2016. 城市空间形态学参数与晴好天气下热岛强度关系[J]. 应用气象学报, 27(2): 249-256. |
| ZHANG H L, ZHU S Y, GAO Y, 2016. The relationship between urban spatial morphology paramenters and urban heat island intensity under fine weather condition[J]. Journal of Applied Meteorological Science, 27(2): 249-256. | |
| [47] | 周伟奇, 田媪钰, 2020. 城市三维空间形态的热环境效应研究进展[J]. 生态学报, 40(2): 416-427. |
| ZHOU W Q, TIAN Y Y, 2020. Effects of urban three-dimensional momphology on thermal environment: A review[J]. Acta Eicologica Sinica, 40(2): 416-427. |
| [1] | 张钧韦, 夏圣洁, 陈慧儒, 刘艳红. 山西中部城市群景观格局演变对其热环境的影响研究[J]. 生态环境学报, 2023, 32(5): 943-955. |
| [2] | 王嘉丽, 冯婧珂, 杨元征, 俎佳星, 蔡文华, 杨健. 南宁市主城区不透水面与热环境效应的空间关系研究[J]. 生态环境学报, 2023, 32(3): 525-534. |
| [3] | 付蓉, 武新梅, 陈斌. 城市地表温度空间分异及驱动因子差异性分析——以合肥市为例[J]. 生态环境学报, 2023, 32(1): 110-122. |
| [4] | 蒋恬田, 杨纯, 廖炜, 胡力, 刘欢瑶, 任勃, 李小马. 城市绿地景观格局影响地表温度的通径分析——以长沙市为例[J]. 生态环境学报, 2023, 32(1): 18-25. |
| [5] | 阮惠华, 许剑辉, 张菲菲. 2001—2020年粤港澳大湾区植被和地表温度时空变化研究[J]. 生态环境学报, 2022, 31(8): 1510-1520. |
| [6] | 李喆, 陈圣宾, 陈芝阳. 地表温度与土地利用类型间的空间尺度依赖性——以成都为例[J]. 生态环境学报, 2022, 31(5): 999-1007. |
| [7] | 梁永春, 尹芳, 赵英芬, 刘磊. 基于Landsat 8影像的太湖生化需氧量遥感反演[J]. 生态环境学报, 2021, 30(7): 1492-1502. |
| 阅读次数 | ||||||
|
全文 |
|
|||||
|
摘要 |
|
|||||