生态环境学报 ›› 2026, Vol. 35 ›› Issue (5): 691-701.DOI: 10.16258/j.cnki.1674-5906.2026.05.003
韦兆伟1( ), 章焕1,*(), 陈锴来2, 虞历尧1, 姚静远1, 杨刚杰1, 罗昶1
收稿日期:2025-07-30
修回日期:2025-12-30
接受日期:2026-02-13
出版日期:2026-05-18
发布日期:2026-05-08
通讯作者:
*E-mail: 作者简介:韦兆伟(1998年生),男,助理工程师,硕士,主要从事气候变化与生态农业响应研究。E-mail: zw_6090@163.com
基金资助:
WEI Zhaowei1(), ZHANG Huan1,*(), CHEN Kailai2, YU Liyao1, YAO Jingyuan1, YANG Gangjie1, LUO Chang1
Received:2025-07-30
Revised:2025-12-30
Accepted:2026-02-13
Online:2026-05-18
Published:2026-05-08
摘要:
高温和干旱会影响植被固碳能力,探究其对植被碳利用率(carbon use efficiency,CUE)的影响对应对气候变化和实现碳中和目标具有重要意义。基于标准化温度指数(standardized temperature index,STI)和标准化降水蒸散发指数(standardized precipitation evapotranspiration index,SPEI)识别了浙江省2001-2022年夏季(6-8月)和秋季(9-11月)发生的高温和干旱事件,并计算了高温干旱复合指数(blended dry and hot events index,BDHI),同时基于MODIS数据研究了不同植被类型CUE对高温和干旱及其复合事件的响应特征。结果表明:研究时段内,浙江省高温过程以轻度炎热和中度炎热为主,干旱过程以中度干旱和轻度干旱为主。6-11月植被CUE多年均值分别为0.43、0.35、0.37、0.49、0.60和0.64,CUE低值(0-0.2)在7-8月分布最显著。夏季和秋季CUE标准化异常指数(ZCUE)与STI均呈显著负相关(r= −0.600和−0.620,p<0.01),其中农田7月ZCUE与STI负相关性最强(r= −0.735)。CUE对干旱响应具有季节差异,夏季呈不显著正相关(r=0.161,p>0.05),秋季呈显著负相关(r= −0.454,p<0.05),相同月份下不同植被类型CUE与SPEI偏相关系数无明显差异。高温干旱复合事件下,7月和8月ZCUE随BDHI强度增加降低更明显。95%置信区间内,各植被类型ZCUE与STI、SPEI和BDHI的最大相关系数均在当月。综上,植被CUE对高温响应更敏感且无滞后,强度升高会导致CUE下降;对干旱响应存在季节差异(夏季影响不显著,秋季抑制);相对于单因素,复合事件在夏季的主导作用更强,林地相对于草地和农田,其CUE变化对复合事件更敏感。
中图分类号:
韦兆伟, 章焕, 陈锴来, 虞历尧, 姚静远, 杨刚杰, 罗昶. 浙江省不同植被类型植被碳利用率(CUE)对高温和干旱的响应特征[J]. 生态环境学报, 2026, 35(5): 691-701.
WEI Zhaowei, ZHANG Huan, CHEN Kailai, YU Liyao, YAO Jingyuan, YANG Gangjie, LUO Chang. Response Characteristics of Carbon Use Efficiency (CUE) of Different Vegetation Types to High-temperature and Drought in Zhejiang Province[J]. Ecology and Environmental Sciences, 2026, 35(5): 691-701.
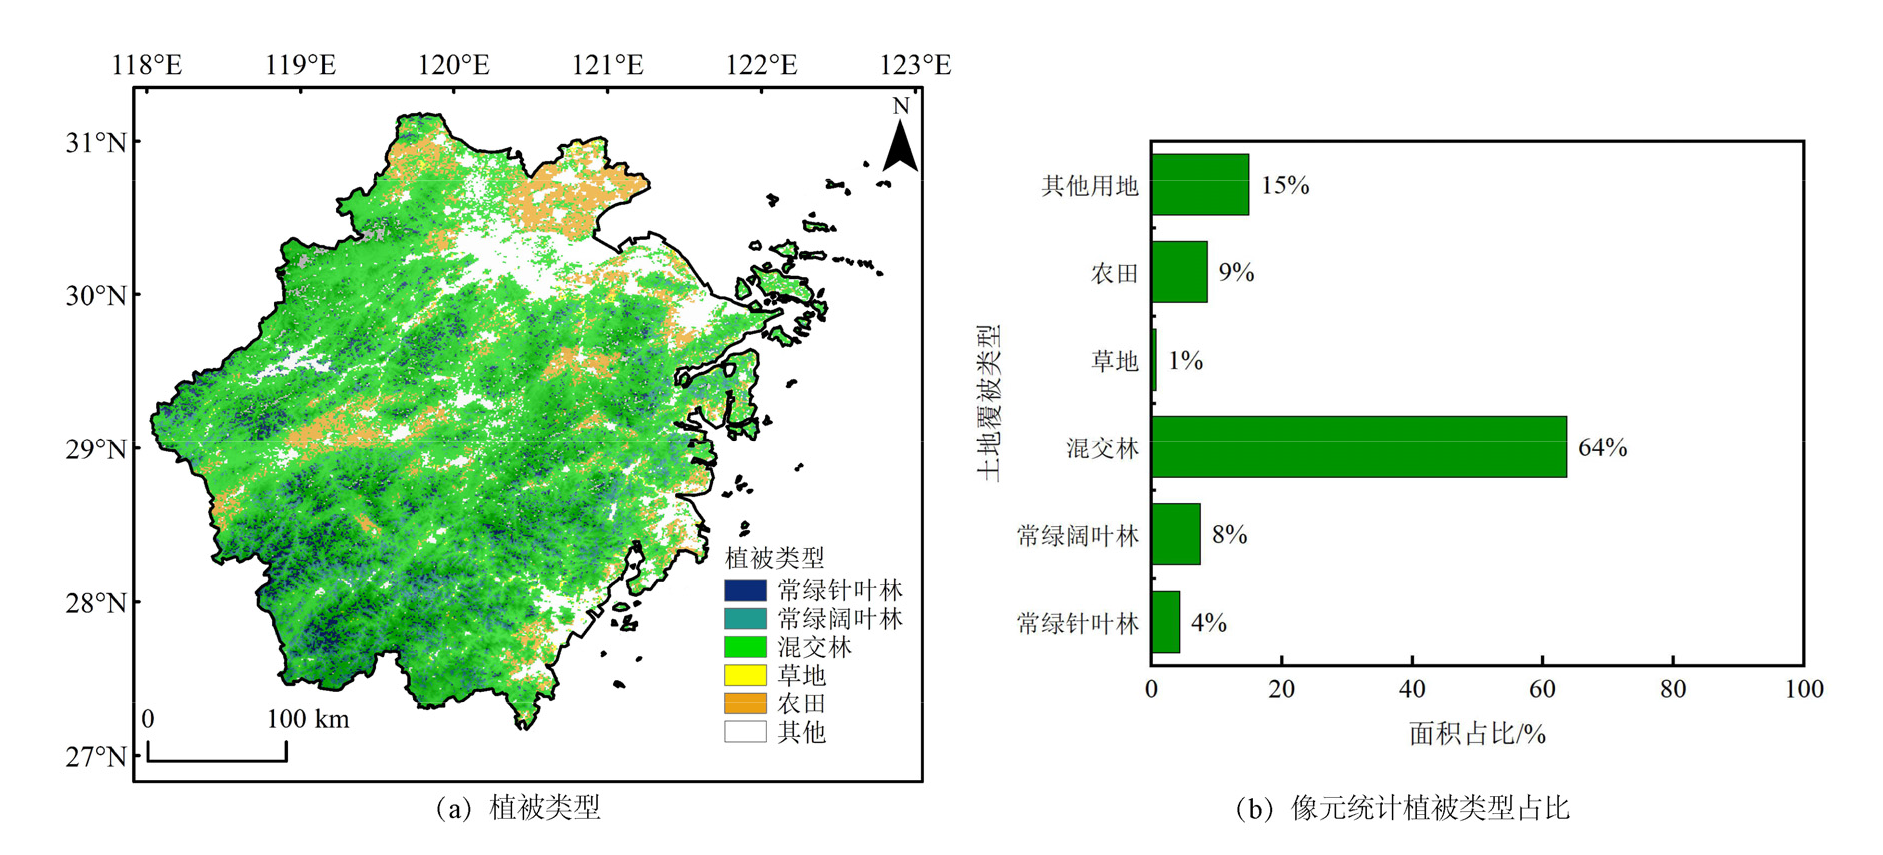
图1 2020年浙江省不同植被类型分布 审图号:GS(2024)0650号
Figure 1 Land cover distribution in 2020 over Zhejiang Province
| STI | 高温等级 | SPEI | 干旱等级 |
|---|---|---|---|
| STI<0.5 | 正常 | SPEI≥−0.5 | 无旱 |
| 0.5≤STI<1.0 | 轻度炎热 | −1.0<SPEI≤−0.5 | 轻度干旱 |
| 1.0≤STI<1.5 | 中度炎热 | −1.5<SPEI≤−1.0 | 中度干旱 |
| 1.5≤STI<2.0 | 重度炎热 | −2.0<SPEI≤−1.5 | 重度干旱 |
| STI≥2.0 | 极端炎热 | SPEI≤−2.0 | 极端干旱 |
表1 STI和SPEI等级划分标准
Table 1 Classification standard of STI and SPEI
| STI | 高温等级 | SPEI | 干旱等级 |
|---|---|---|---|
| STI<0.5 | 正常 | SPEI≥−0.5 | 无旱 |
| 0.5≤STI<1.0 | 轻度炎热 | −1.0<SPEI≤−0.5 | 轻度干旱 |
| 1.0≤STI<1.5 | 中度炎热 | −1.5<SPEI≤−1.0 | 中度干旱 |
| 1.5≤STI<2.0 | 重度炎热 | −2.0<SPEI≤−1.5 | 重度干旱 |
| STI≥2.0 | 极端炎热 | SPEI≤−2.0 | 极端干旱 |

图2 2001-2022年浙江省6-11月高温和干旱变化情况
Figure 2 Variation of high-temperature and drought in Zhejiang Province from June to November in 2001?2022

图3 2001-2022年6-11月植被CUE空间分布
Figure 3 Spatial distribution of vegetation CUE from June to November in 2001?2022
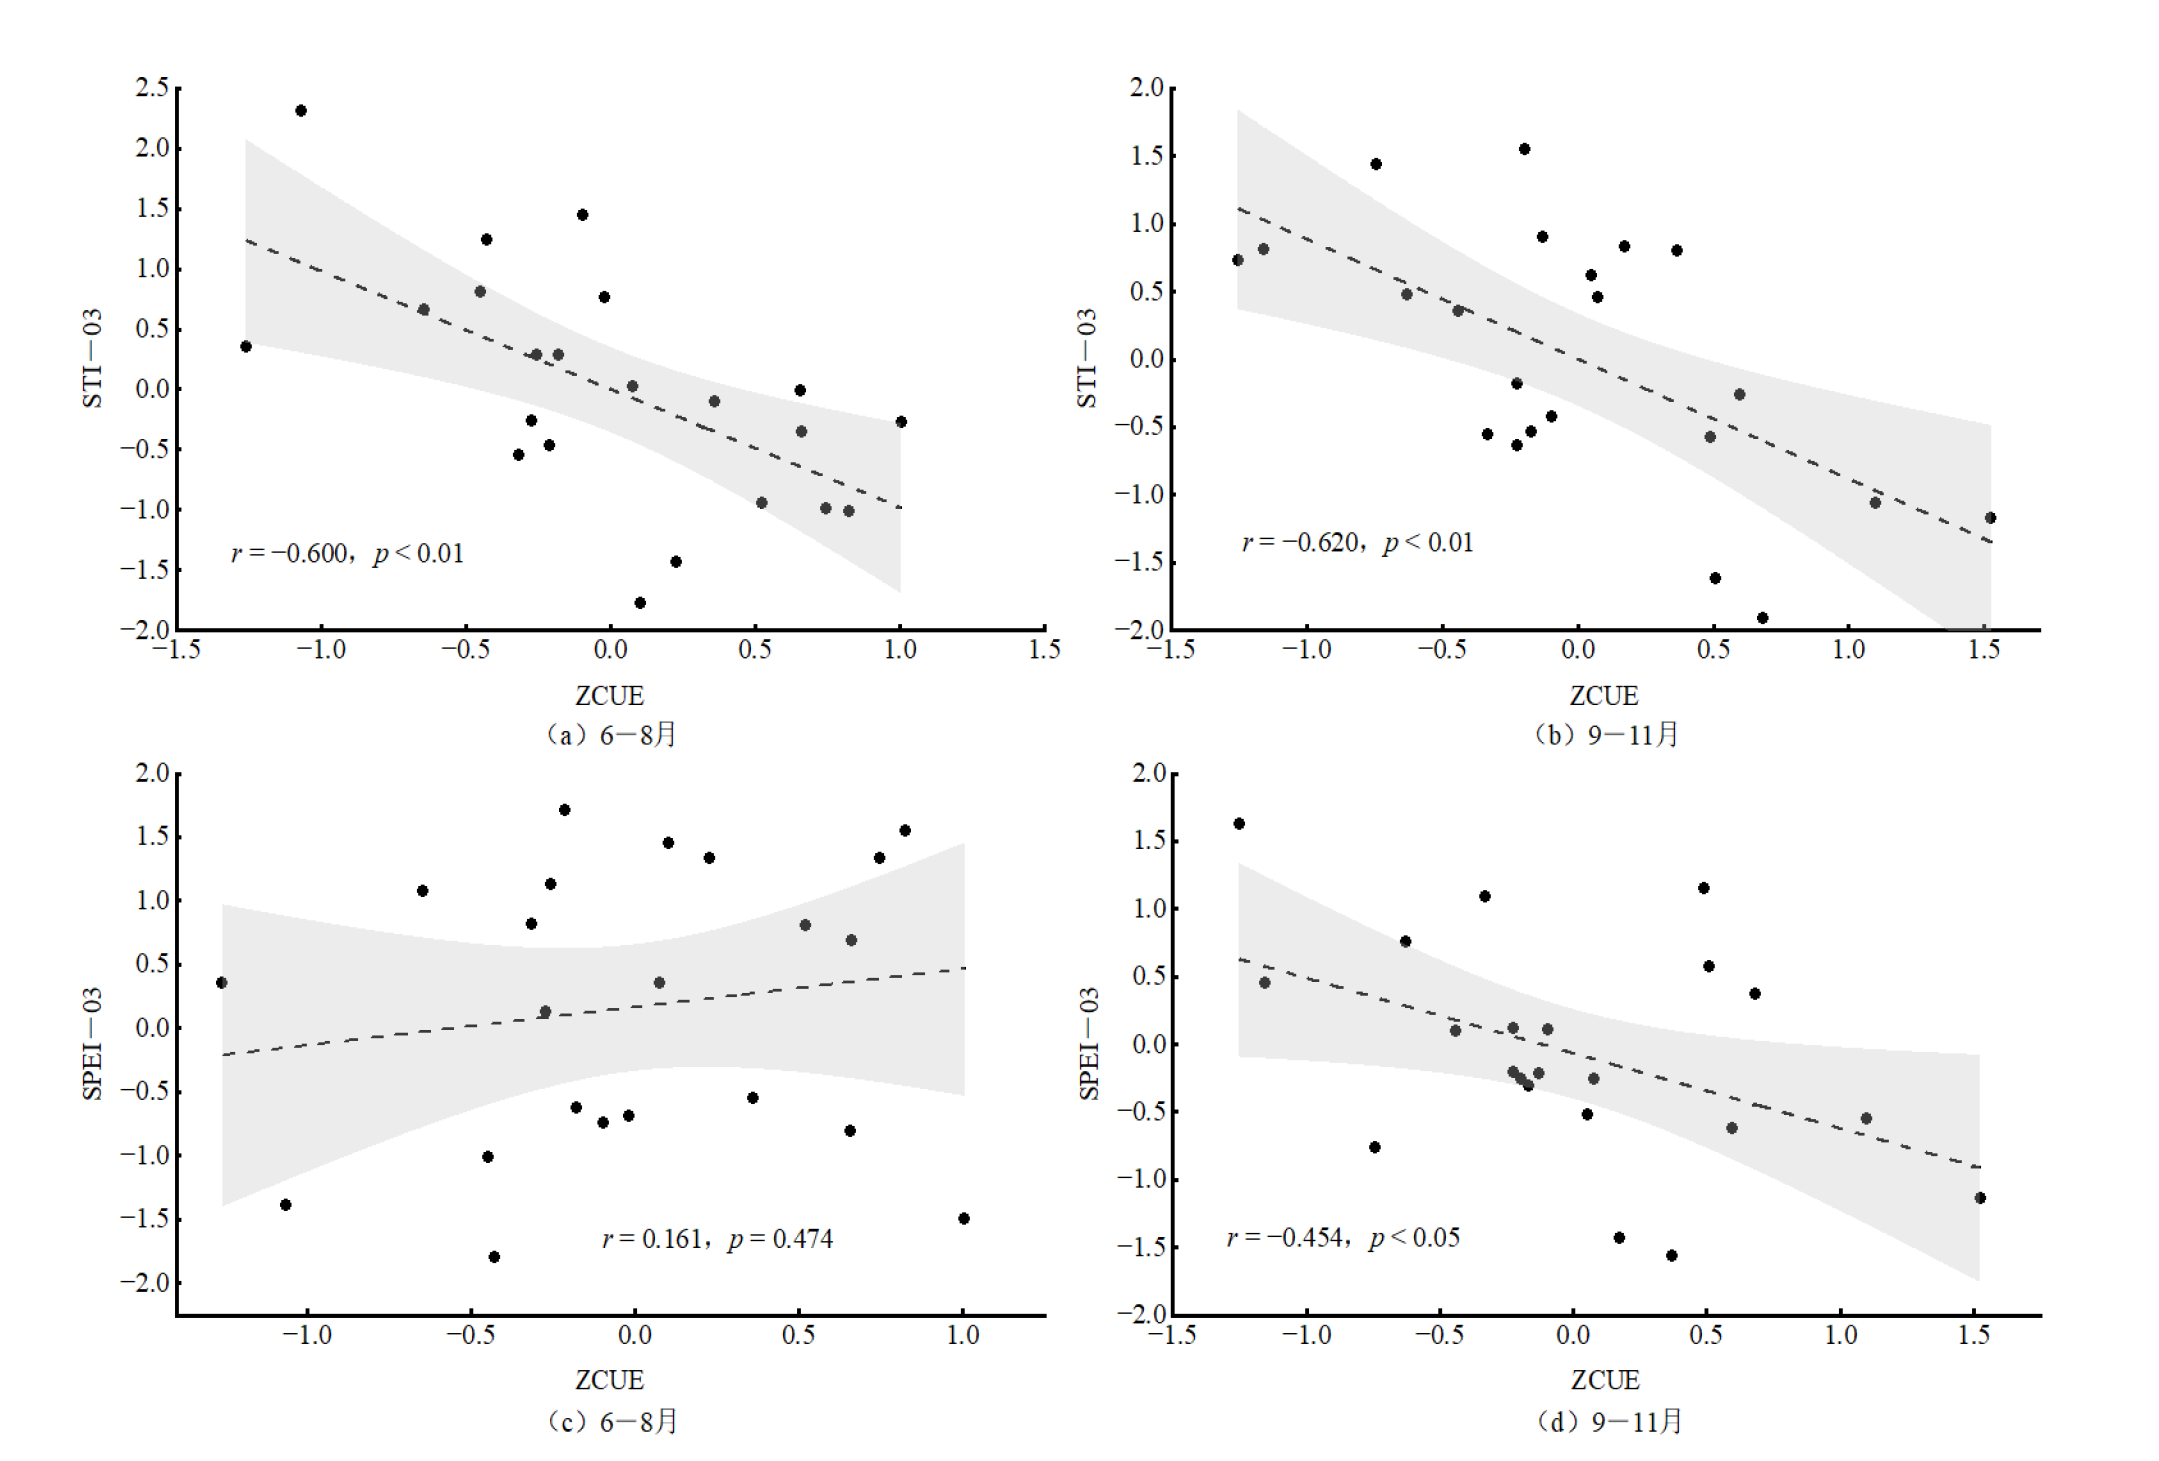
图4 CUE标准化异常指数(ZCUE)与高温和干旱的季节相关性
Figure 4 Seasonal correlation between CUE normalized anomaly (ZCUE) and high-temperature and drought
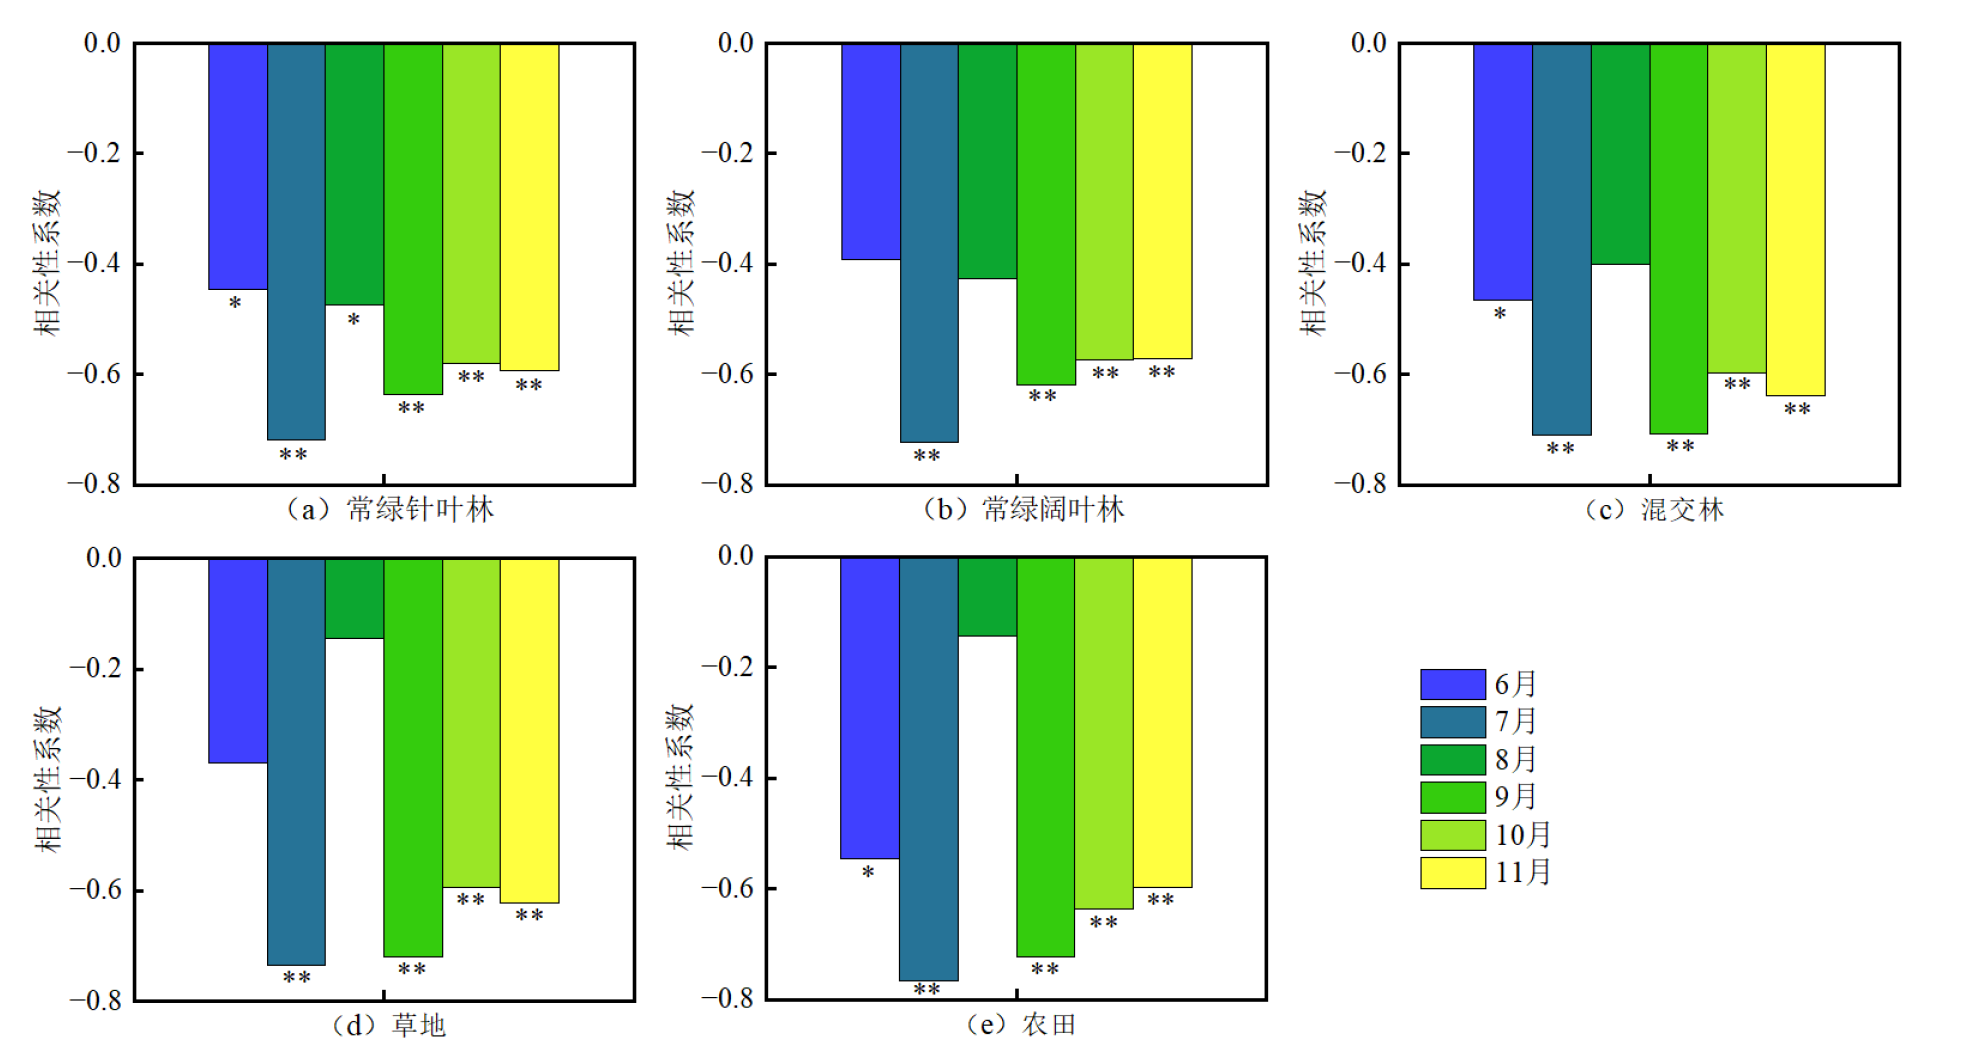
图5 不同植被类型CUE标准化异常指数(ZCUE)与STI-01的偏相关系数 *和**分别表示在0.05和0.01水平上,相关性显著。下同
Figure 5 The partial correlation coefficient between ZCUE and STI?01 in different vegetation types
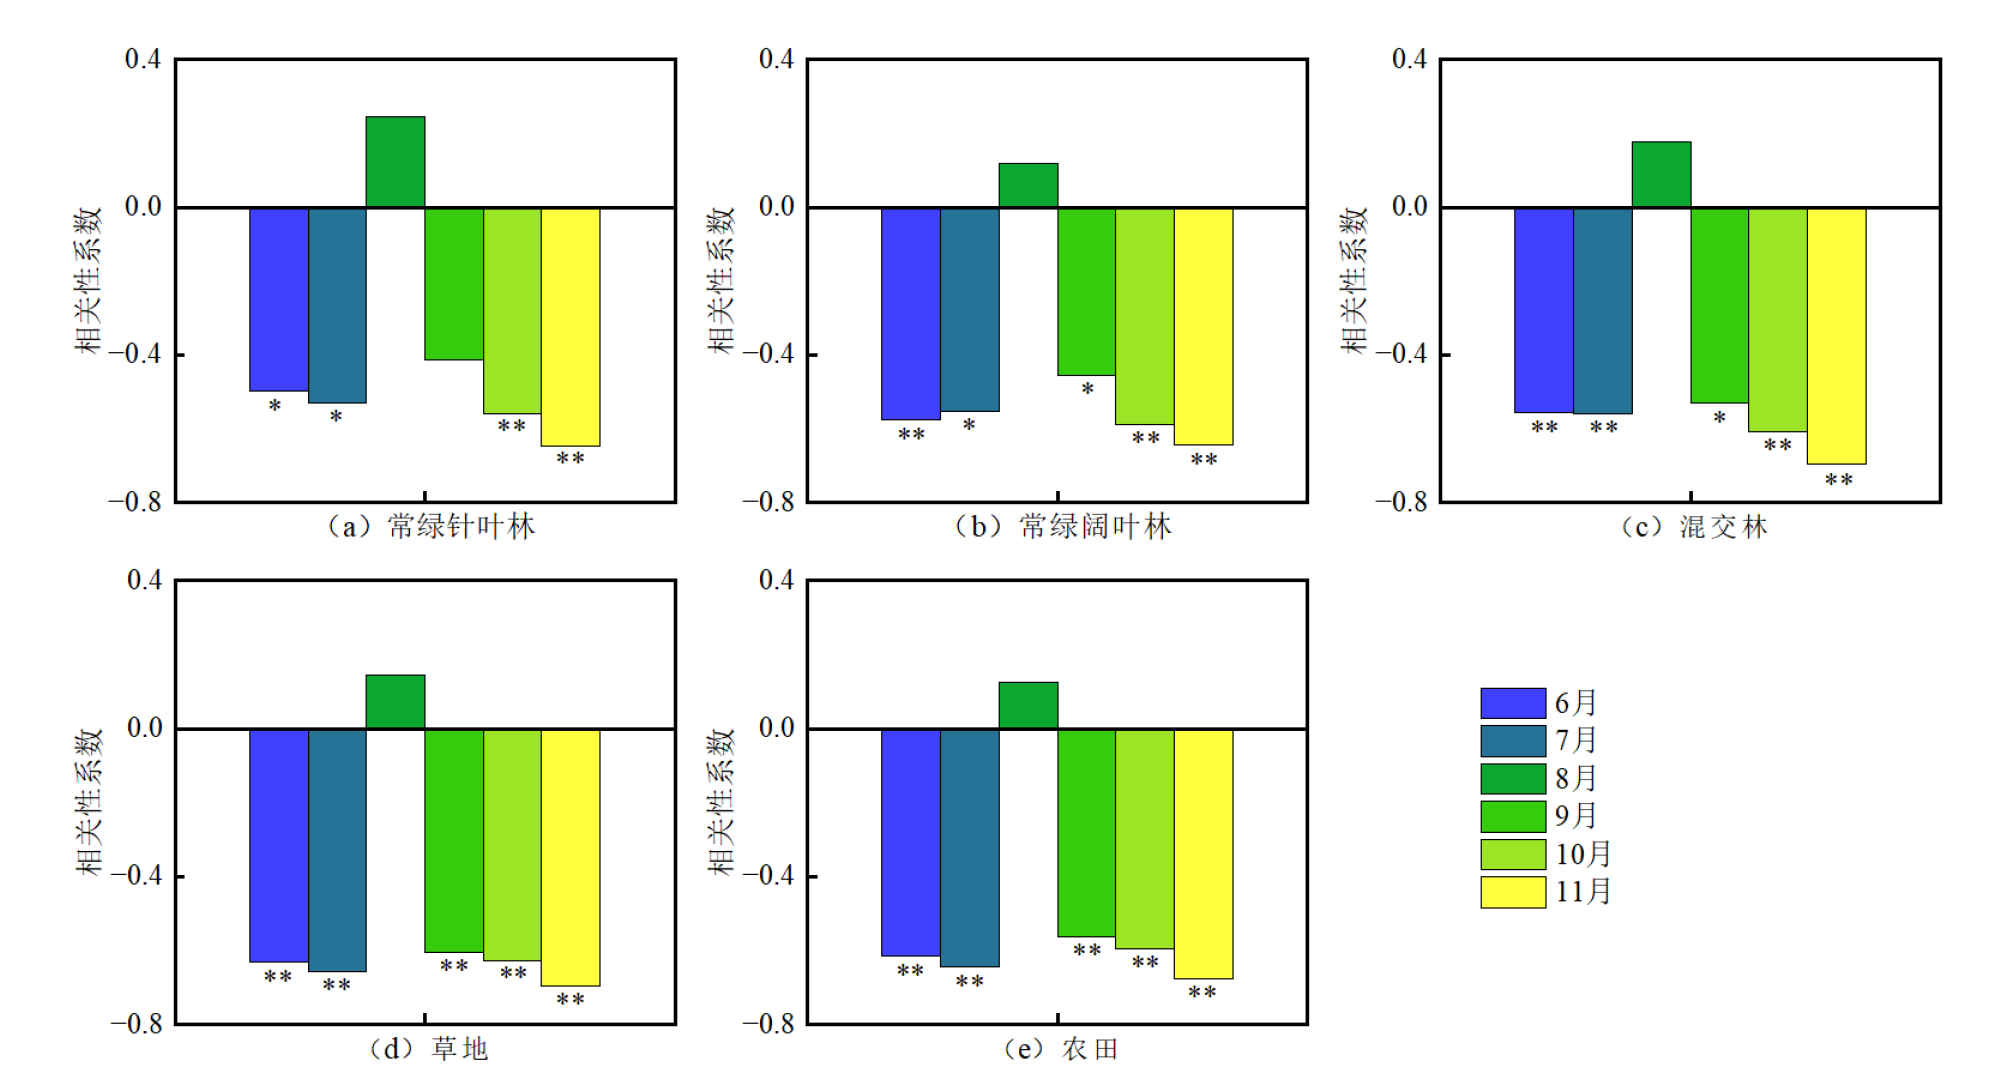
图6 不同植被类型CUE标准化异常指数(ZCUE)与SPEI-01的偏相关系数
Figure 6 The partial correlation coefficient between ZCUE and SPEI?01 in different vegetation types
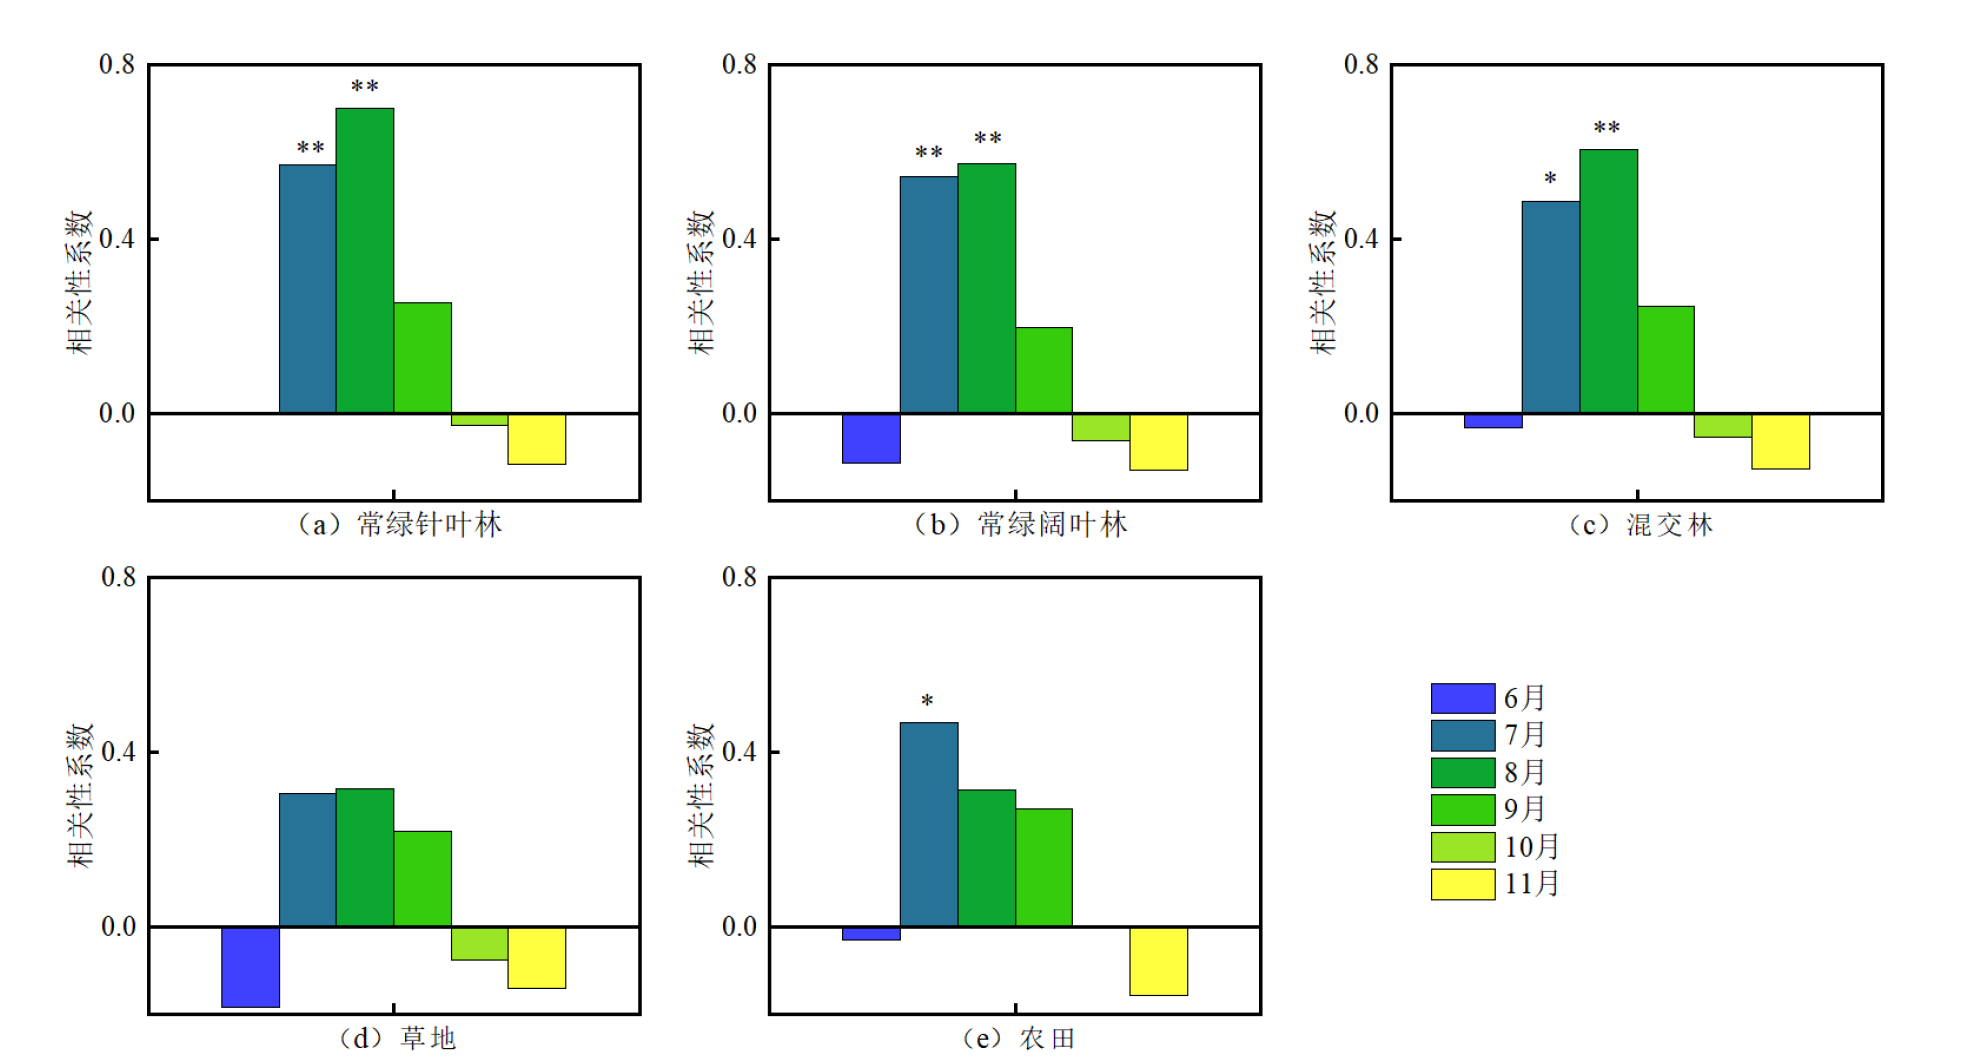
图7 不同植被类型CUE标准化异常指数(ZCUE)与BDHI的相关系数
Figure 7 The correlation coefficient between ZCUE and BDHI in different vegetation types
| STI-01 | ZCUE滞后期 | |||||
|---|---|---|---|---|---|---|
| ZCUE-0 | ZCUE-1 | ZCUE-2 | ZCUE-3 | ZCUE-4 | ZCUE-5 | |
| 常绿针叶林 | −0.546** | −0.161 | −0.114 | −0.171 | −0.132 | −0.114 |
| 常绿阔叶林 | −0.509** | −0.170 | −0.106 | −0.151 | −0.129 | −0.084 |
| 混交林 | −0.532** | −0.159 | −0.112 | −0.165 | −0.127 | −0.106 |
| 草地 | −0.436** | −0.133 | −0.105 | −0.139 | −0.090 | −0.077 |
| 农田 | −0.500** | −0.140 | −0.104 | −0.131 | −0.117 | −0.092 |
表2 STI-01与滞后0-5个月ZCUE的CCF分析
Table 2 Cross-correlation function of STI?01 and standardized abnormalities in CUE with a lag of 0?5 months
| STI-01 | ZCUE滞后期 | |||||
|---|---|---|---|---|---|---|
| ZCUE-0 | ZCUE-1 | ZCUE-2 | ZCUE-3 | ZCUE-4 | ZCUE-5 | |
| 常绿针叶林 | −0.546** | −0.161 | −0.114 | −0.171 | −0.132 | −0.114 |
| 常绿阔叶林 | −0.509** | −0.170 | −0.106 | −0.151 | −0.129 | −0.084 |
| 混交林 | −0.532** | −0.159 | −0.112 | −0.165 | −0.127 | −0.106 |
| 草地 | −0.436** | −0.133 | −0.105 | −0.139 | −0.090 | −0.077 |
| 农田 | −0.500** | −0.140 | −0.104 | −0.131 | −0.117 | −0.092 |
| SPEI-01 | ZCUE滞后期 | |||||
|---|---|---|---|---|---|---|
| ZCUE-0 | ZCUE-1 | ZCUE-2 | ZCUE-3 | ZCUE-4 | ZCUE-5 | |
| 常绿针叶林 | −0.119 | −0.085 | −0.115 | 0.059 | 0.014 | −0.081 |
| 常绿阔叶林 | −0.158 | −0.043 | −0.127 | 0.053 | 0.000 | −0.085 |
| 混交林 | −0.179* | −0.067 | −0.100 | 0.066 | 0.000 | −0.112 |
| 草地 | −0.272** | −0.029 | −0.056 | 0.128 | 0.018 | −0.134 |
| 农田 | −0.210* | −0.030 | −0.002 | 0.155 | 0.055 | −0.117 |
表3 SPEI-01与滞后0-5个月ZCUE的CCF分析
Table 3 Cross-correlation function of SPEI?01 and standardized abnormalities in CUE with a lag of 0?5 months
| SPEI-01 | ZCUE滞后期 | |||||
|---|---|---|---|---|---|---|
| ZCUE-0 | ZCUE-1 | ZCUE-2 | ZCUE-3 | ZCUE-4 | ZCUE-5 | |
| 常绿针叶林 | −0.119 | −0.085 | −0.115 | 0.059 | 0.014 | −0.081 |
| 常绿阔叶林 | −0.158 | −0.043 | −0.127 | 0.053 | 0.000 | −0.085 |
| 混交林 | −0.179* | −0.067 | −0.100 | 0.066 | 0.000 | −0.112 |
| 草地 | −0.272** | −0.029 | −0.056 | 0.128 | 0.018 | −0.134 |
| 农田 | −0.210* | −0.030 | −0.002 | 0.155 | 0.055 | −0.117 |
| BDHI | ZCUE滞后期 | |||||
|---|---|---|---|---|---|---|
| ZCUE-0 | ZCUE-1 | ZCUE-2 | ZCUE-3 | ZCUE-4 | ZCUE-5 | |
| 常绿针叶林 | 0.203* | 0.029 | −0.004 | 0.095 | 0.025 | −0.032 |
| 常绿阔叶林 | 0.155 | 0.065 | −0.018 | 0.076 | 0.020 | −0.049 |
| 混交林 | 0.161 | 0.045 | 0.001 | 0.095 | 0.010 | −0.052 |
| 草地 | 0.059 | 0.056 | 0.024 | 0.129 | 0.000 | −0.080 |
| 农田 | 0.129 | 0.060 | 0.065 | 0.148 | 0.041 | −0.053 |
表4 BDHI与滞后0-5个月ZCUE的CCF分析
Table 4 Cross-correlation function of BDHI and standardized abnormalities in CUE with a lag of 0?5 months
| BDHI | ZCUE滞后期 | |||||
|---|---|---|---|---|---|---|
| ZCUE-0 | ZCUE-1 | ZCUE-2 | ZCUE-3 | ZCUE-4 | ZCUE-5 | |
| 常绿针叶林 | 0.203* | 0.029 | −0.004 | 0.095 | 0.025 | −0.032 |
| 常绿阔叶林 | 0.155 | 0.065 | −0.018 | 0.076 | 0.020 | −0.049 |
| 混交林 | 0.161 | 0.045 | 0.001 | 0.095 | 0.010 | −0.052 |
| 草地 | 0.059 | 0.056 | 0.024 | 0.129 | 0.000 | −0.080 |
| 农田 | 0.129 | 0.060 | 0.065 | 0.148 | 0.041 | −0.053 |
| [1] |
BROICH M, TULBURE M G, VERBESSELT J, et al., 2018. Quantifying Australia’s dryland vegetation response to flooding and drought at sub-continental scale[J]. Remote Sensing of Environment. 212: 60-78.
DOI URL |
| [2] |
CHAMBERS J Q, TRIBUZY E S, TOLEDO L C, et al., 2004. Respiration from a tropical forest ecosystem: partitioning of sources and low carbon use efficiency[J]. Ecological Applications, 14(4): 72-88.
DOI URL |
| [3] |
COHEN I, ZANDALINAS S I, HUCK C, et al., 2021. Meta‐analysis of drought and high-temperature stress combination impact on crop yield and yield components[J]. Physiologia Plantarum, 171(1): 66-76.
DOI URL |
| [4] |
DONG G, ZHAO F Y, CHEN J Q, et al., 2020. Non-climatic component provoked substantial spatiotemporal changes of carbon and water use efficiency on the Mongolian Plateau[J]. Environmental Research Letters, 15(9): 095009.
DOI |
| [5] |
DOUGHTY C E, GOLDSMITH G R, RAAB N, et al., 2018. What controls variation in carbon use efficiency among Amazonian tropical forests[J]. Biotropica, 50(1): 16-25.
DOI URL |
| [6] |
DUAN H C, YAN C Z, TSUNEKAWA A, et al., 2011. Assessing vegetation dynamics in the Three-North Shelter Forest region of China using AVHRR NDVI data[J]. Environmental Earth Sciences, 64(4): 1011-1020.
DOI URL |
| [7] |
GANG C C, WANG Z Q, CHEN Y Z, et al., 2016. Drought-induced dynamics of carbon and water use efficiency of global grasslands from 2000 to 2011[J]. Ecological Indicators, 67: 788-797.
DOI URL |
| [8] |
GANG C C, WANG Z N, YOU Y F, et al., 2022. Divergent responses of terrestrial carbon use efficiency to climate variation from 2000 to 2018[J]. Global and Planetary Change, 208: 103709.
DOI URL |
| [9] |
GANG C C, ZHANG Y, GUO L, et al., 2019. Drought-induced carbon and water use efficiency responses in dryland vegetation of northern China[J]. Frontiers in Plant Science, 10: 224.
DOI PMID |
| [10] | HANSEN J, SATO M, RUEDY R, 2012. Perception of climate change[J]. Proceedings of the National Academy of Sciences, 109(37): 2415-2423. |
| [11] | HE Q N, JU W M, DAI S P, et al., 2021. Drought risk of global terrestrial gross primary productivity over the last 40 years detected by a remote sensing‐driven process model[J]. Journal of Geophysical Research: Biogeosciences, 126(6): e2020JG005944. |
| [12] | IPCC, 2021. Climate Change 2021: The physical science basis: Working group I contribution to the sixth assessment report of the intergovernmental panel on climate change[M]. Cambridge: Cambridge University Press. |
| [13] |
LIU X Y, LAI Q, YIN S, et al., 2024. Spatio-temporal patterns and control mechanism of the ecosystem carbon use efficiency across the Mongolian Plateau[J]. Science of the Total Environment, 907: 167883.
DOI URL |
| [14] | PIAO S L, WANG X H, PARK T J, et al., 2020. Characteristics, drivers and feedbacks of global greening[J]. Nature Reviews Earth & Environment, 1(1): 14-27. |
| [15] | RUNNING S W, ZHAO M, 2015. MOD17 user’s guide. Daily GPP and annual NPP (MOD17A2/A3) products NASA earth observing system MODIS land algorithm. (2015-10-07) [2025-12-28]. http://modis.gsfc.nasa.gov/. |
| [16] |
SPEHN E M, JOSHI J, SCHMID B, et al., 2000. Above-ground resource use increases with plant species richness in experimental grassland ecosystems[J]. Functional Ecology, 14(3): 326-337.
DOI URL |
| [17] |
SUN B F, ZHAO H, WANG X K, 2016. Effects of drought on net primary productivity: Roles of temperature, drought intensity, and duration[J]. Chinese Geographical Science, 26(2): 270-282.
DOI URL |
| [18] |
TANG Y K, CHEN Y M, WEN X F, et al., 2016. Variation of carbon use efficiency over ten years in a subtropical coniferous plantation in southeast China[J]. Ecological Engineering, 97: 196-206.
DOI URL |
| [19] |
TONG S Q, BAO G, BAO Y H, et al., 2023. Monitoring of long‐term vegetation dynamics and responses to droughts of various timescales in Inner Mongolia[J]. Ecosphere, 14(2): e4415.
DOI URL |
| [20] |
VICENTE-SERRANO S M, GOUVEIA C, CAMARERO J J, et al., 2013. Response of vegetation to drought time-scales across global land biomes[J]. Proceedings of the National Academy of Sciences, 110(1): 52-57.
DOI URL |
| [21] |
WANG H L, CHEN A F, WANG Q F, et al., 2015. Drought dynamics and impacts on vegetation in China from 1982 to 2011[J]. Ecological Engineering, 75: 303-307.
DOI URL |
| [22] | WU H J., SU X L, SINGH V P, 2021. Blended dry and hot events index for monitoring dry‐hot events over global land areas[J]. Geophysical Research Letters, 48(24): e2021GL096181. |
| [23] |
YANG Z Y, YU Q, YANG Z Y, et al., 2023. Spatio-temporal dynamic characteristics of carbon use efficiency in a virgin forest area of southeast Tibet[J]. Remote Sensing, 15(9): 2382.
DOI URL |
| [24] |
YIN J B, GENTINE P, SLATER L, et al., 2023. Future socio-ecosystem productivity threatened by compound drought-high-temperature wave events[J]. Nature Sustainability. 6(3): 259-72.
DOI |
| [25] |
YU Z, CIAIS P, PIAO S L, et al., 2022. Forest expansion dominates China’s land carbon sink since 1980[J]. Nature Communications, 13(1): 5374.
DOI |
| [26] | YUAN X L, CHEN X, OCHEGE F U, et al., 2025. Weakening of global terrestrial carbon sequestration capacity under increasing intensity of warm extremes[J]. Nature Ecology & Evolution. 9(1): 124-133. |
| [27] |
ZHANG M T, WANG M L, GUO H, et al., 2023. Tropospheric delay model based on VMF and ERA5 reanalysis data[J]. Applied Sciences, 13(9): 5789.
DOI URL |
| [28] |
ZHANG Y H, YE A Z, 2024. The response of terrestrial vegetation carbon use efficiency to global environmental changes[J]. Global and Planetary Change, 240: 104537.
DOI URL |
| [29] |
ZHANG Y J, YU G R, YANG J, et al., 2014. Climate‐driven global changes in carbon use efficiency[J]. Global Ecology and Biogeography, 23(2): 144-155.
DOI URL |
| [30] |
安澳华, 陈洁, 高郭平, 2025. 气候变化情景下中国东南沿海复合高温-干旱事件危险性及滞后效应研究[J]. 热带地理, 45(4): 553-566.
DOI |
|
AN A H, CHEN J, GAO G P, 2025. Hazard and lag effect of compound heat-drought events in southeastern coastal China under climate change scenarios[J]. Tropical Geography, 45(4): 553-566.
DOI |
|
| [31] | 陈涛, 张芳华, 于超, 等, 2020. 2020年6-7月长江中下游极端梅雨天气特征分析[J]. 气象, 46(11): 1415-1426. |
| CHEN T, ZHANG F H, YU C, et al., 2020. Synoptic analysis of extreme Meiyu precipitation over Yangtze River Basin during June- July 2020[J]. Meteor Mon, 46(11): 1415-1426. | |
| [32] | 杜晓铮, 赵祥, 王昊宇, 等, 2018. 陆地生态系统水分利用效率对气候变化的响应研究进展[J]. 生态学报, 38(23): 8296-8305. |
| DU X Z, ZHAO X, WANG H Y, et al., 2018. Responses of terrestrial ecosystem water use efficiency to climate change: A review[J]. Acta Ecologica Sinica, 38(23): 8296-8305. | |
| [33] |
付远, 刘汉华, 周玲丽, 等, 2025. 2022年与2013年浙江夏季极端高温特点和成因对比[J]. 干旱气象, 43(1): 76-87.
DOI |
| FU Y, LIU H H, ZHOU L L, et al., 2025. Comparative analysis of characteristics and causes of summer extreme high temperatures in Zhejiang in 2022 and 2013[J]. Journal of Arid Meteorology, 43(1): 76-87. | |
| [34] |
顾锡羚, 郭恩亮, 银山, 等, 2021. 干旱对内蒙古植被生长的累积与滞后影响评估研究[J]. 草地学报, 29(6): 1301-1310.
DOI |
| GU X L, GUO E L, YIN S, et al., 2021. Assessment of the cumulative and lagging effects of drought on vegetation growth in inner Mongolia[J]. Acta Agrestia Sinica, 29(6): 1301-1310. | |
| [35] |
李伯新, 姜超, 孙建新, 2023. CMIP6模式对中国西南部地区植被碳利用率模拟能力综合评估[J]. 植物生态学报, 47(9): 1211-1224.
DOI |
|
LI B X, JIANG C, SUN J X, 2023. Comprehensive assessment of vegetation carbon use efficiency in southwestern China simulated by CMIP6 models[J]. Chinese Journal of Plant Ecology, 47(9): 1211-1224.
DOI URL |
|
| [36] |
李新妹, 吴作航, 王震山, 等, 2024. 基于MODIS遥感数据的福建植被生产力时空分布与干旱响应分析[J]. 生态环境学报, 33(6): 841-852.
DOI |
| LI X M, WU Z H, WANG Z S, et al., 2024. Spatio-temporal dynamics of vegetation productivity and drought impacts in Fujian province using MODIS data[J]. Ecology and Environmental Sciences, 33(6): 841-852. | |
| [37] | 刘波, 刘玉冰, 黎春蕾, 等, 2022. 重庆市伏秋旱时空演变特征及其影响因素分析[J]. 长江流域资源与环境, 31(5): 1077-1085. |
| LIU B, LIU Y B, LI C L, et al., 2022. Spatial-temporal variation and impact factors of the mid summer and autumn drought events in Chongqing, China[J]. Resources and Environment in the Yangtze Basin, 31(5): 1077-1085. | |
| [38] | 刘福红, 叶许春, 郭强, 等, 2021. 鄱阳湖流域不同土地覆被碳水利用效率时空变化及其与气候因子的相关性[J]. 生态学报, 41(2): 694-706. |
| LIU F H, YE X C, GUO Q, et al., 2021. Spatio-temporal variation of carbon and water use efficiency of different land cover in the Poyang Lake Basin and their correlations with climate factors[J]. Acta Ecologica Sinica, 41(2): 694-706. | |
| [39] | 马蓉, 夏春林, 张佳琦, 等, 2023. 中国温带草原植被NDVI时空变化及其对气候变化的响应[J]. 生态学杂志, 42(2): 395-405. |
|
MA R, XIA C L, ZHANG J Q, et al., 2023. Spatiotemporal variation of vegetation NDVI and its response to climate change in the temperate grassland region of China[J]. Chinese Journal of Ecology, 42(2): 395-405.
DOI |
|
| [40] | 武新英, 郝增超, 张璇, 等, 2021. 中国夏季复合高温干旱分布及变异趋势[J]. 水利水电技术(中英文), 52(12): 90-98. |
| WU X Y, HAO Z C, ZHANG X, et al., 2021. Distribution and trends of compound hot and dry events during summer in China[J]. Water Resources and Hydropower Engineering, 52(12): 90-98. | |
| [41] | 曾兴兰, 陈田田, 2023. 西南地区植被动态变化的驱动力解析[J]. 中国环境科学, 43(12): 6561-6570. |
| ZENG X L, CHEN T T, 2023. Analysis of the driving forces of vegetation dynamic changes in southwest China[J]. China Environmental Science, 43(12): 6561-6570. | |
| [42] | 詹云军, 章文, 严岩, 等, 2021. 长江流域实际蒸散发演变趋势及影响因素[J]. 生态学报, 41(17): 6924-6935. |
| ZHAN Y J, ZHANG W, YAN Y, et al., 2021. Analysis of actual evapotranspiration evolution and influencing factors in the Yangtze River[J]. Acta Ecologica Sinica, 41(17): 6924-6935. | |
| [43] | 张蕾, 钱拴, 曹云, 等, 2024. 2022年南方高温干旱特点及其对植被净初级生产力的影响[J]. 生态学杂志, 43(7): 2182-2188. |
|
ZHANG L, QIAN S, CAO Y, et al., 2024. Characteristics of heat and drought events across southern China in 2022 and their impacts on vegetation net primary productivity[J]. Chinese Journal of Ecology, 43(7): 2182-2188.
DOI |
|
| [44] | 张雪玲, 朱美琪, 李颖, 2024. 基于标准化指数的中国东北地区复合高温干旱事件时空变化特征分析[J]. 河北省科学院学报, 41(1): 1-10. |
| ZHANG X L, ZHU M Q, LI Y, 2024. Spatiotemporal variability of compound heat and drought events in Northeast China based on standardized indice[J]. Journal of the Hebei Academy of Sciences, 41(1): 1-10. | |
| [45] | 中国气象局, 2024. 中国气候公报[G]. 北京: 国家气候中心, (2025-03-02) [2025-11-18]. https://www.cma.gov.cn/zfxxgk/gknr/qxbg/202503/t20250302_6886935.html. |
| China Meteorological Administration, 2024. China Climate Bulletin[G]. Beijing: National Climate Centre, (2025-03-02) [2025-11-16]. https://www.cma.gov.cn/zfxxgk/gknr/qxbg/202503/t20250302_6886935.html. | |
| [46] | 邹杰, 丁建丽, 秦艳, 等, 2018. 遥感分析中亚地区生态系统水分利用效率对干旱的响应[J]. 农业工程学报, 34(9): 145-152. |
| ZOU J, DING J L, QIN Y, et al., 2018. Response of water use efficiency of Central Asia ecosystem to drought based on remote sensing data[J]. Transactions of the Chinese Society of Agricultural Engineering (Transactions of the CSAE), 34(9): 145-152. |
| [1] | 张雯, 郑天, 刘永超, 钟捷, 苏杰, 李加林. 基于电路理论的浙江省生态保护修复关键区域识别[J]. 生态环境学报, 2024, 33(9): 1482-1494. |
| [2] | 李新妹, 吴作航, 王震山, 翁升恒, 孙朝锋, 关辉, 王宏. 基于MODIS遥感数据的福建植被生产力时空分布与干旱响应分析[J]. 生态环境学报, 2024, 33(6): 841-852. |
| 阅读次数 | ||||||
|
全文 |
|
|||||
|
摘要 |
|
|||||