Ecology and Environmental Sciences ›› 2026, Vol. 35 ›› Issue (1): 1-14.DOI: 10.16258/j.cnki.1674-5906.2026.01.001
• Research Article [Ecology] • Next Articles
SUN Yuhuan1( ), YANG Yichen1,*(), ZHANG Tingyu2
Received:2025-04-21
Revised:2025-08-20
Accepted:2025-09-30
Online:2026-01-18
Published:2026-01-05
孙玉环1(), 杨逸辰1,*(), 张汀昱2
通讯作者:
* E-mail: 作者简介:孙玉环(1970年生),女,教授,博士,主要研究方向为资源与环境统计、经济统计。E-mail: yhsun602@126.com
基金资助:CLC Number:
SUN Yuhuan, YANG Yichen, ZHANG Tingyu. Spatial Patterns and Evolutionary Characteristics of Ecological and Economic Efficiency in China: An Ecological Priority Perspective[J]. Ecology and Environmental Sciences, 2026, 35(1): 1-14.
孙玉环, 杨逸辰, 张汀昱. 中国生态经济效率的空间格局及演进特征研究——基于生态优先视角[J]. 生态环境学报, 2026, 35(1): 1-14.
Add to citation manager EndNote|Ris|BibTeX
URL: https://www.jeesci.com/EN/10.16258/j.cnki.1674-5906.2026.01.001
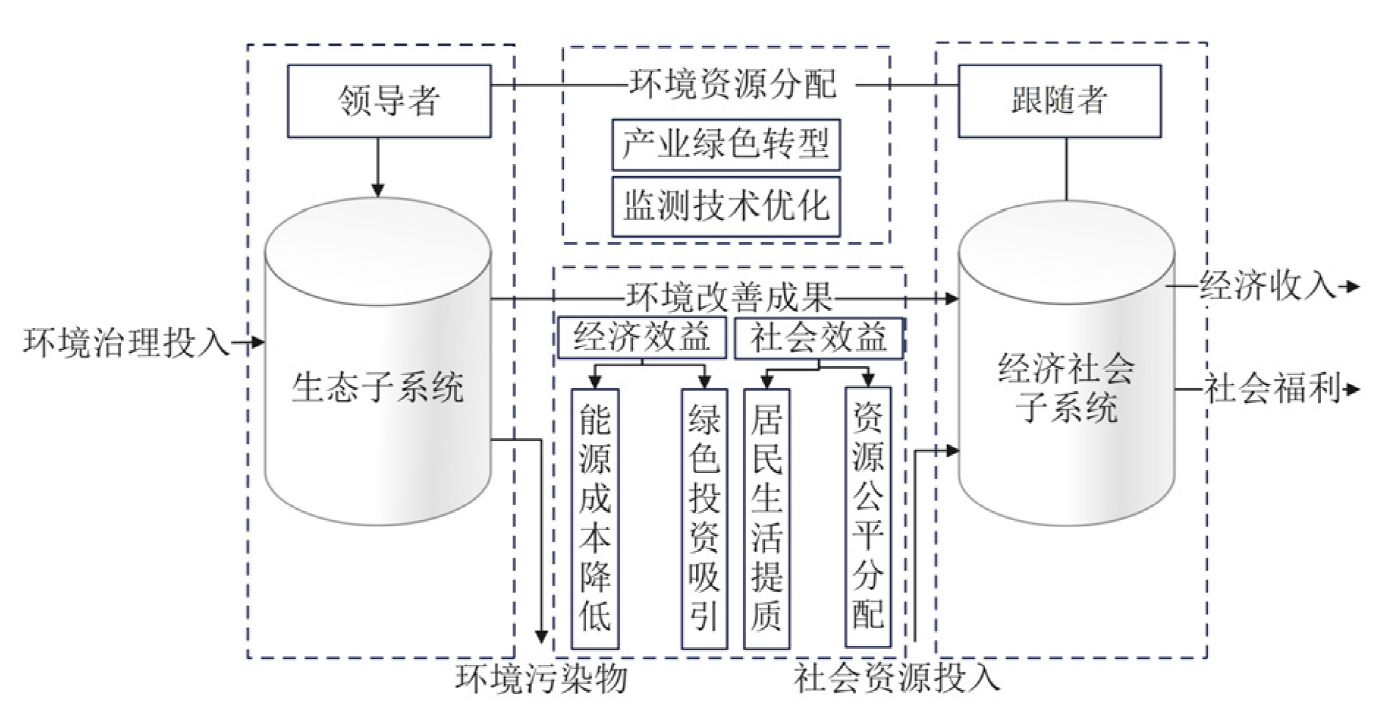
Figure 1 Framework of eco-economic system from the perspective of ecological priority
| 生态经济效率 | 生态子效率 | 经济社会子效率值 | 省域生态经济水平状态 |
|---|---|---|---|
| ≥1 | ≥1 | ≥1 | 相对有效 |
| ≥1 | ≥1 | <1 | 弱有效 |
| ≥1 | <1 | ≥1 | 弱有效 |
| <1 | <1 | <1 | 无效 |
Table 1 Evaluation criteria for ecological and economic efficiency level in provincial regions
| 生态经济效率 | 生态子效率 | 经济社会子效率值 | 省域生态经济水平状态 |
|---|---|---|---|
| ≥1 | ≥1 | ≥1 | 相对有效 |
| ≥1 | ≥1 | <1 | 弱有效 |
| ≥1 | <1 | ≥1 | 弱有效 |
| <1 | <1 | <1 | 无效 |
| 准则层 | 指标类型 | 具体指标 | 单位 | 变量代码 |
|---|---|---|---|---|
| 上层系统 (生态子系统) | 投入 | 治理项目总投资 | 万元 | X1 |
| 非期望产出 | 污染排放总量 | 万吨 | Y1 | |
| 中间过程 | 中间变量 | 空气质量日数 | d | Z1 |
| 反馈投入 | 人均公共绿地面积 | km2 | Z2 | |
| 下层系统 (经济社会 子系统) | 外部投入 | 就业人数 | 人 | X2 |
| 固定资产投资额 | 亿元 | X3 | ||
| 最终产出 | 人均GDP | 元 | Y2 | |
| 普通高等学校 在校学生数 | 万人 | Y3 | ||
| 每万人医疗床位 | 万张 | Y4 | ||
| 文化类社会 组织机构数 | 个 | Y5 |
Table 2 Eco-economic efficiency evaluation index system
| 准则层 | 指标类型 | 具体指标 | 单位 | 变量代码 |
|---|---|---|---|---|
| 上层系统 (生态子系统) | 投入 | 治理项目总投资 | 万元 | X1 |
| 非期望产出 | 污染排放总量 | 万吨 | Y1 | |
| 中间过程 | 中间变量 | 空气质量日数 | d | Z1 |
| 反馈投入 | 人均公共绿地面积 | km2 | Z2 | |
| 下层系统 (经济社会 子系统) | 外部投入 | 就业人数 | 人 | X2 |
| 固定资产投资额 | 亿元 | X3 | ||
| 最终产出 | 人均GDP | 元 | Y2 | |
| 普通高等学校 在校学生数 | 万人 | Y3 | ||
| 每万人医疗床位 | 万张 | Y4 | ||
| 文化类社会 组织机构数 | 个 | Y5 |
| 省份 | 生态经济效率 | 生态子效率 | 经济社会子效率 | 省域生态经济 效率水平 | |||||
|---|---|---|---|---|---|---|---|---|---|
| 均值 | 排名 | 均值 | 排名 | 均值 | 排名 | ||||
| 青海 | 1.54 | 1 | 1.01 | 4 | 1.48 | 1 | 有效 | ||
| 北京 | 1.17 | 2 | 0.90 | 6 | 1.36 | 3 | 弱有效 | ||
| 江苏 | 1.08 | 3 | 1.02 | 2 | 1.09 | 10 | 有效 | ||
| 宁夏 | 1.07 | 4 | 1.02 | 3 | 1.10 | 7 | 有效 | ||
| 辽宁 | 1.07 | 5 | 0.70 | 14 | 1.39 | 2 | 弱有效 | ||
| 广东 | 1.05 | 6 | 0.74 | 11 | 1.31 | 4 | 弱有效 | ||
| 陕西 | 1.03 | 7 | 0.74 | 12 | 1.23 | 5 | 弱有效 | ||
| 四川 | 0.99 | 8 | 0.97 | 5 | 1.02 | 12 | 无效 | ||
| 上海 | 0.94 | 9 | 1.23 | 1 | 0.92 | 20 | 无效 | ||
| 河南 | 0.93 | 10 | 0.86 | 7 | 1.07 | 11 | 无效 | ||
| 甘肃 | 0.93 | 11 | 0.77 | 9 | 1.15 | 6 | 无效 | ||
| 黑龙江 | 0.89 | 12 | 0.79 | 8 | 1.10 | 8 | 无效 | ||
| 山东 | 0.78 | 13 | 0.66 | 17 | 1.10 | 9 | 无效 | ||
| 天津 | 0.70 | 14 | 0.68 | 15 | 1.01 | 13 | 无效 | ||
| 湖南 | 0.66 | 15 | 0.66 | 18 | 1.00 | 14 | 无效 | ||
| 江西 | 0.60 | 16 | 0.63 | 19 | 0.90 | 22 | 无效 | ||
| 山西 | 0.60 | 17 | 0.61 | 21 | 1.00 | 15 | 无效 | ||
| 湖北 | 0.58 | 18 | 0.60 | 22 | 0.98 | 16 | 无效 | ||
| 重庆 | 0.57 | 19 | 0.74 | 13 | 0.78 | 26 | 无效 | ||
| 吉林 | 0.56 | 20 | 0.62 | 20 | 0.89 | 23 | 无效 | ||
| 贵州 | 0.54 | 21 | 0.76 | 10 | 0.73 | 28 | 无效 | ||
| 福建 | 0.54 | 22 | 0.55 | 23 | 0.98 | 17 | 无效 | ||
| 新疆 | 0.52 | 23 | 0.52 | 25 | 0.82 | 24 | 无效 | ||
| 内蒙古 | 0.50 | 24 | 0.50 | 26 | 0.97 | 18 | 无效 | ||
| 浙江 | 0.48 | 25 | 0.49 | 27 | 0.97 | 19 | 无效 | ||
| 云南 | 0.48 | 26 | 0.67 | 16 | 0.76 | 27 | 无效 | ||
| 安徽 | 0.45 | 27 | 0.47 | 28 | 0.82 | 25 | 无效 | ||
| 河北 | 0.44 | 28 | 0.34 | 29 | 0.91 | 21 | 无效 | ||
| 广西 | 0.43 | 29 | 0.54 | 24 | 0.69 | 29 | 无效 | ||
| 全域 | 0.76 | - | 0.72 | - | 1.02 | - | 无效 | ||
Table 3 Mean and ranking of eco-economic efficiency as well as two-stage sub-efficiency by provinces, 2013?2023
| 省份 | 生态经济效率 | 生态子效率 | 经济社会子效率 | 省域生态经济 效率水平 | |||||
|---|---|---|---|---|---|---|---|---|---|
| 均值 | 排名 | 均值 | 排名 | 均值 | 排名 | ||||
| 青海 | 1.54 | 1 | 1.01 | 4 | 1.48 | 1 | 有效 | ||
| 北京 | 1.17 | 2 | 0.90 | 6 | 1.36 | 3 | 弱有效 | ||
| 江苏 | 1.08 | 3 | 1.02 | 2 | 1.09 | 10 | 有效 | ||
| 宁夏 | 1.07 | 4 | 1.02 | 3 | 1.10 | 7 | 有效 | ||
| 辽宁 | 1.07 | 5 | 0.70 | 14 | 1.39 | 2 | 弱有效 | ||
| 广东 | 1.05 | 6 | 0.74 | 11 | 1.31 | 4 | 弱有效 | ||
| 陕西 | 1.03 | 7 | 0.74 | 12 | 1.23 | 5 | 弱有效 | ||
| 四川 | 0.99 | 8 | 0.97 | 5 | 1.02 | 12 | 无效 | ||
| 上海 | 0.94 | 9 | 1.23 | 1 | 0.92 | 20 | 无效 | ||
| 河南 | 0.93 | 10 | 0.86 | 7 | 1.07 | 11 | 无效 | ||
| 甘肃 | 0.93 | 11 | 0.77 | 9 | 1.15 | 6 | 无效 | ||
| 黑龙江 | 0.89 | 12 | 0.79 | 8 | 1.10 | 8 | 无效 | ||
| 山东 | 0.78 | 13 | 0.66 | 17 | 1.10 | 9 | 无效 | ||
| 天津 | 0.70 | 14 | 0.68 | 15 | 1.01 | 13 | 无效 | ||
| 湖南 | 0.66 | 15 | 0.66 | 18 | 1.00 | 14 | 无效 | ||
| 江西 | 0.60 | 16 | 0.63 | 19 | 0.90 | 22 | 无效 | ||
| 山西 | 0.60 | 17 | 0.61 | 21 | 1.00 | 15 | 无效 | ||
| 湖北 | 0.58 | 18 | 0.60 | 22 | 0.98 | 16 | 无效 | ||
| 重庆 | 0.57 | 19 | 0.74 | 13 | 0.78 | 26 | 无效 | ||
| 吉林 | 0.56 | 20 | 0.62 | 20 | 0.89 | 23 | 无效 | ||
| 贵州 | 0.54 | 21 | 0.76 | 10 | 0.73 | 28 | 无效 | ||
| 福建 | 0.54 | 22 | 0.55 | 23 | 0.98 | 17 | 无效 | ||
| 新疆 | 0.52 | 23 | 0.52 | 25 | 0.82 | 24 | 无效 | ||
| 内蒙古 | 0.50 | 24 | 0.50 | 26 | 0.97 | 18 | 无效 | ||
| 浙江 | 0.48 | 25 | 0.49 | 27 | 0.97 | 19 | 无效 | ||
| 云南 | 0.48 | 26 | 0.67 | 16 | 0.76 | 27 | 无效 | ||
| 安徽 | 0.45 | 27 | 0.47 | 28 | 0.82 | 25 | 无效 | ||
| 河北 | 0.44 | 28 | 0.34 | 29 | 0.91 | 21 | 无效 | ||
| 广西 | 0.43 | 29 | 0.54 | 24 | 0.69 | 29 | 无效 | ||
| 全域 | 0.76 | - | 0.72 | - | 1.02 | - | 无效 | ||
| 省份 | 生态子系统 | 经济社会子系统 | |||||||||||
|---|---|---|---|---|---|---|---|---|---|---|---|---|---|
| 投入 | 产出 | 投入 | 产出 | ||||||||||
| 治理投资 | 空气质量 | 污染排放 | 就业人数 | 固定资产投资 | 人均GDP | 高等学校在校学生 | 医疗床位 | 文化类组织机构数 | 公共绿地面积 | ||||
| 北京 | 0.59 | −0.12 | 0.45 | 0.00 | 0.23 | −0.70 | 0.00 | −0.03 | 0.00 | −0.10 | |||
| 天津 | −0.83 | 0.00 | −0.18 | 0.00 | 0.00 | 0.00 | 0.00 | 0.00 | 0.00 | 0.00 | |||
| 河北 | −0.69 | 0.12 | −0.32 | 0.00 | −0.07 | 0.23 | 0.04 | 0.00 | 0.73 | −0.57 | |||
| 山西 | −0.34 | 0.00 | −0.32 | 0.00 | 0.00 | 0.00 | 0.00 | 0.00 | 0.00 | 0.00 | |||
| 内蒙古 | −0.85 | 0.01 | −0.32 | 0.00 | −0.46 | 0.00 | 0.14 | 0.00 | 0.00 | 0.14 | |||
| 辽宁 | 0.00 | 0.25 | 0.00 | 0.00 | 0.00 | 0.00 | −0.35 | −0.49 | 0.00 | −0.51 | |||
| 吉林 | −0.74 | 0.15 | −0.74 | 0.00 | 0.00 | 0.16 | 0.00 | 0.01 | 0.00 | 0.16 | |||
| 黑龙江 | −0.30 | 0.00 | −0.58 | 0.00 | 0.00 | 0.00 | 0.00 | 0.00 | 0.00 | 0.00 | |||
| 上海 | 0.00 | −0.22 | 0.00 | 0.00 | 0.00 | −0.20 | 0.00 | 0.00 | −0.05 | 2.11 | |||
| 江苏 | 0.00 | −0.21 | 0.00 | 0.00 | 0.00 | −0.29 | 0.00 | 0.00 | −0.22 | −0.48 | |||
| 浙江 | −0.74 | 0.15 | −0.73 | −0.02 | −0.13 | 0.01 | 0.45 | 0.14 | 0.00 | −0.16 | |||
| 安徽 | −0.61 | 0.10 | −0.30 | −0.05 | −0.28 | 0.74 | 0.00 | 0.00 | 0.00 | −0.17 | |||
| 福建 | −0.78 | 0.00 | −0.60 | 0.00 | 0.00 | 0.00 | 0.00 | 0.00 | 0.00 | 0.00 | |||
| 江西 | −0.29 | 0.00 | −0.46 | 0.00 | 0.00 | 0.00 | 0.00 | 0.00 | 0.00 | 0.00 | |||
| 山东 | −0.77 | 0.00 | −0.77 | 0.00 | 0.00 | 0.00 | 0.00 | 0.00 | 0.00 | 0.00 | |||
| 河南 | −0.28 | 0.00 | 0.00 | 0.00 | 0.00 | 0.00 | 0.00 | 0.00 | 0.00 | 0.00 | |||
| 湖北 | −0.83 | 0.02 | −0.73 | −0.11 | −0.19 | 0.07 | 0.00 | 0.00 | 0.00 | 0.11 | |||
| 湖南 | −0.50 | 0.00 | −0.13 | 0.00 | 0.00 | 0.00 | 0.00 | 0.00 | 0.00 | 0.00 | |||
| 广东 | 0.00 | 0.52 | 0.00 | 0.00 | 0.00 | 0.00 | −0.24 | −0.06 | −0.07 | −0.16 | |||
| 广西 | −0.39 | 0.24 | −0.32 | 0.00 | 0.00 | 0.94 | 0.00 | 0.18 | 0.46 | 0.09 | |||
| 重庆 | −0.84 | −0.15 | −0.73 | 0.00 | 0.00 | 0.00 | 0.00 | 0.06 | 0.68 | 0.18 | |||
| 四川 | 0.00 | −0.45 | 0.00 | 0.00 | 0.00 | 0.00 | 0.00 | −0.11 | 0.00 | −0.25 | |||
| 贵州 | −0.66 | 0.01 | −0.60 | 0.00 | −0.50 | 0.91 | 0.12 | 0.00 | 0.01 | 0.85 | |||
| 云南 | −0.68 | 0.03 | −0.50 | −0.06 | −0.05 | 0.25 | 0.13 | 0.00 | 0.39 | 0.63 | |||
| 陕西 | 0.00 | 0.14 | 0.00 | 0.00 | 0.00 | 0.00 | 0.00 | −0.04 | −0.04 | −0.49 | |||
| 甘肃 | −0.73 | −0.05 | 0.00 | −0.03 | 0.00 | 0.94 | 0.05 | 0.00 | 0.00 | 0.23 | |||
| 青海 | 0.00 | 0.23 | 0.00 | 1.25 | 0.24 | 0.00 | 0.00 | 0.00 | −0.15 | −0.01 | |||
| 宁夏 | 0.00 | −0.11 | 0.13 | 0.22 | 0.05 | −0.10 | 0.00 | 0.00 | 0.00 | 0.68 | |||
| 新疆 | −0.92 | 0.05 | −0.76 | −0.07 | −0.35 | 1.43 | 0.00 | 0.00 | 0.67 | −0.38 | |||
Table 4 Input-output redundancy in 29 provinces in 2023
| 省份 | 生态子系统 | 经济社会子系统 | |||||||||||
|---|---|---|---|---|---|---|---|---|---|---|---|---|---|
| 投入 | 产出 | 投入 | 产出 | ||||||||||
| 治理投资 | 空气质量 | 污染排放 | 就业人数 | 固定资产投资 | 人均GDP | 高等学校在校学生 | 医疗床位 | 文化类组织机构数 | 公共绿地面积 | ||||
| 北京 | 0.59 | −0.12 | 0.45 | 0.00 | 0.23 | −0.70 | 0.00 | −0.03 | 0.00 | −0.10 | |||
| 天津 | −0.83 | 0.00 | −0.18 | 0.00 | 0.00 | 0.00 | 0.00 | 0.00 | 0.00 | 0.00 | |||
| 河北 | −0.69 | 0.12 | −0.32 | 0.00 | −0.07 | 0.23 | 0.04 | 0.00 | 0.73 | −0.57 | |||
| 山西 | −0.34 | 0.00 | −0.32 | 0.00 | 0.00 | 0.00 | 0.00 | 0.00 | 0.00 | 0.00 | |||
| 内蒙古 | −0.85 | 0.01 | −0.32 | 0.00 | −0.46 | 0.00 | 0.14 | 0.00 | 0.00 | 0.14 | |||
| 辽宁 | 0.00 | 0.25 | 0.00 | 0.00 | 0.00 | 0.00 | −0.35 | −0.49 | 0.00 | −0.51 | |||
| 吉林 | −0.74 | 0.15 | −0.74 | 0.00 | 0.00 | 0.16 | 0.00 | 0.01 | 0.00 | 0.16 | |||
| 黑龙江 | −0.30 | 0.00 | −0.58 | 0.00 | 0.00 | 0.00 | 0.00 | 0.00 | 0.00 | 0.00 | |||
| 上海 | 0.00 | −0.22 | 0.00 | 0.00 | 0.00 | −0.20 | 0.00 | 0.00 | −0.05 | 2.11 | |||
| 江苏 | 0.00 | −0.21 | 0.00 | 0.00 | 0.00 | −0.29 | 0.00 | 0.00 | −0.22 | −0.48 | |||
| 浙江 | −0.74 | 0.15 | −0.73 | −0.02 | −0.13 | 0.01 | 0.45 | 0.14 | 0.00 | −0.16 | |||
| 安徽 | −0.61 | 0.10 | −0.30 | −0.05 | −0.28 | 0.74 | 0.00 | 0.00 | 0.00 | −0.17 | |||
| 福建 | −0.78 | 0.00 | −0.60 | 0.00 | 0.00 | 0.00 | 0.00 | 0.00 | 0.00 | 0.00 | |||
| 江西 | −0.29 | 0.00 | −0.46 | 0.00 | 0.00 | 0.00 | 0.00 | 0.00 | 0.00 | 0.00 | |||
| 山东 | −0.77 | 0.00 | −0.77 | 0.00 | 0.00 | 0.00 | 0.00 | 0.00 | 0.00 | 0.00 | |||
| 河南 | −0.28 | 0.00 | 0.00 | 0.00 | 0.00 | 0.00 | 0.00 | 0.00 | 0.00 | 0.00 | |||
| 湖北 | −0.83 | 0.02 | −0.73 | −0.11 | −0.19 | 0.07 | 0.00 | 0.00 | 0.00 | 0.11 | |||
| 湖南 | −0.50 | 0.00 | −0.13 | 0.00 | 0.00 | 0.00 | 0.00 | 0.00 | 0.00 | 0.00 | |||
| 广东 | 0.00 | 0.52 | 0.00 | 0.00 | 0.00 | 0.00 | −0.24 | −0.06 | −0.07 | −0.16 | |||
| 广西 | −0.39 | 0.24 | −0.32 | 0.00 | 0.00 | 0.94 | 0.00 | 0.18 | 0.46 | 0.09 | |||
| 重庆 | −0.84 | −0.15 | −0.73 | 0.00 | 0.00 | 0.00 | 0.00 | 0.06 | 0.68 | 0.18 | |||
| 四川 | 0.00 | −0.45 | 0.00 | 0.00 | 0.00 | 0.00 | 0.00 | −0.11 | 0.00 | −0.25 | |||
| 贵州 | −0.66 | 0.01 | −0.60 | 0.00 | −0.50 | 0.91 | 0.12 | 0.00 | 0.01 | 0.85 | |||
| 云南 | −0.68 | 0.03 | −0.50 | −0.06 | −0.05 | 0.25 | 0.13 | 0.00 | 0.39 | 0.63 | |||
| 陕西 | 0.00 | 0.14 | 0.00 | 0.00 | 0.00 | 0.00 | 0.00 | −0.04 | −0.04 | −0.49 | |||
| 甘肃 | −0.73 | −0.05 | 0.00 | −0.03 | 0.00 | 0.94 | 0.05 | 0.00 | 0.00 | 0.23 | |||
| 青海 | 0.00 | 0.23 | 0.00 | 1.25 | 0.24 | 0.00 | 0.00 | 0.00 | −0.15 | −0.01 | |||
| 宁夏 | 0.00 | −0.11 | 0.13 | 0.22 | 0.05 | −0.10 | 0.00 | 0.00 | 0.00 | 0.68 | |||
| 新疆 | −0.92 | 0.05 | −0.76 | −0.07 | −0.35 | 1.43 | 0.00 | 0.00 | 0.67 | −0.38 | |||

Figure 2 Temporal and spatial distribution map of ecological and economic efficiency in the studied area for relevant years
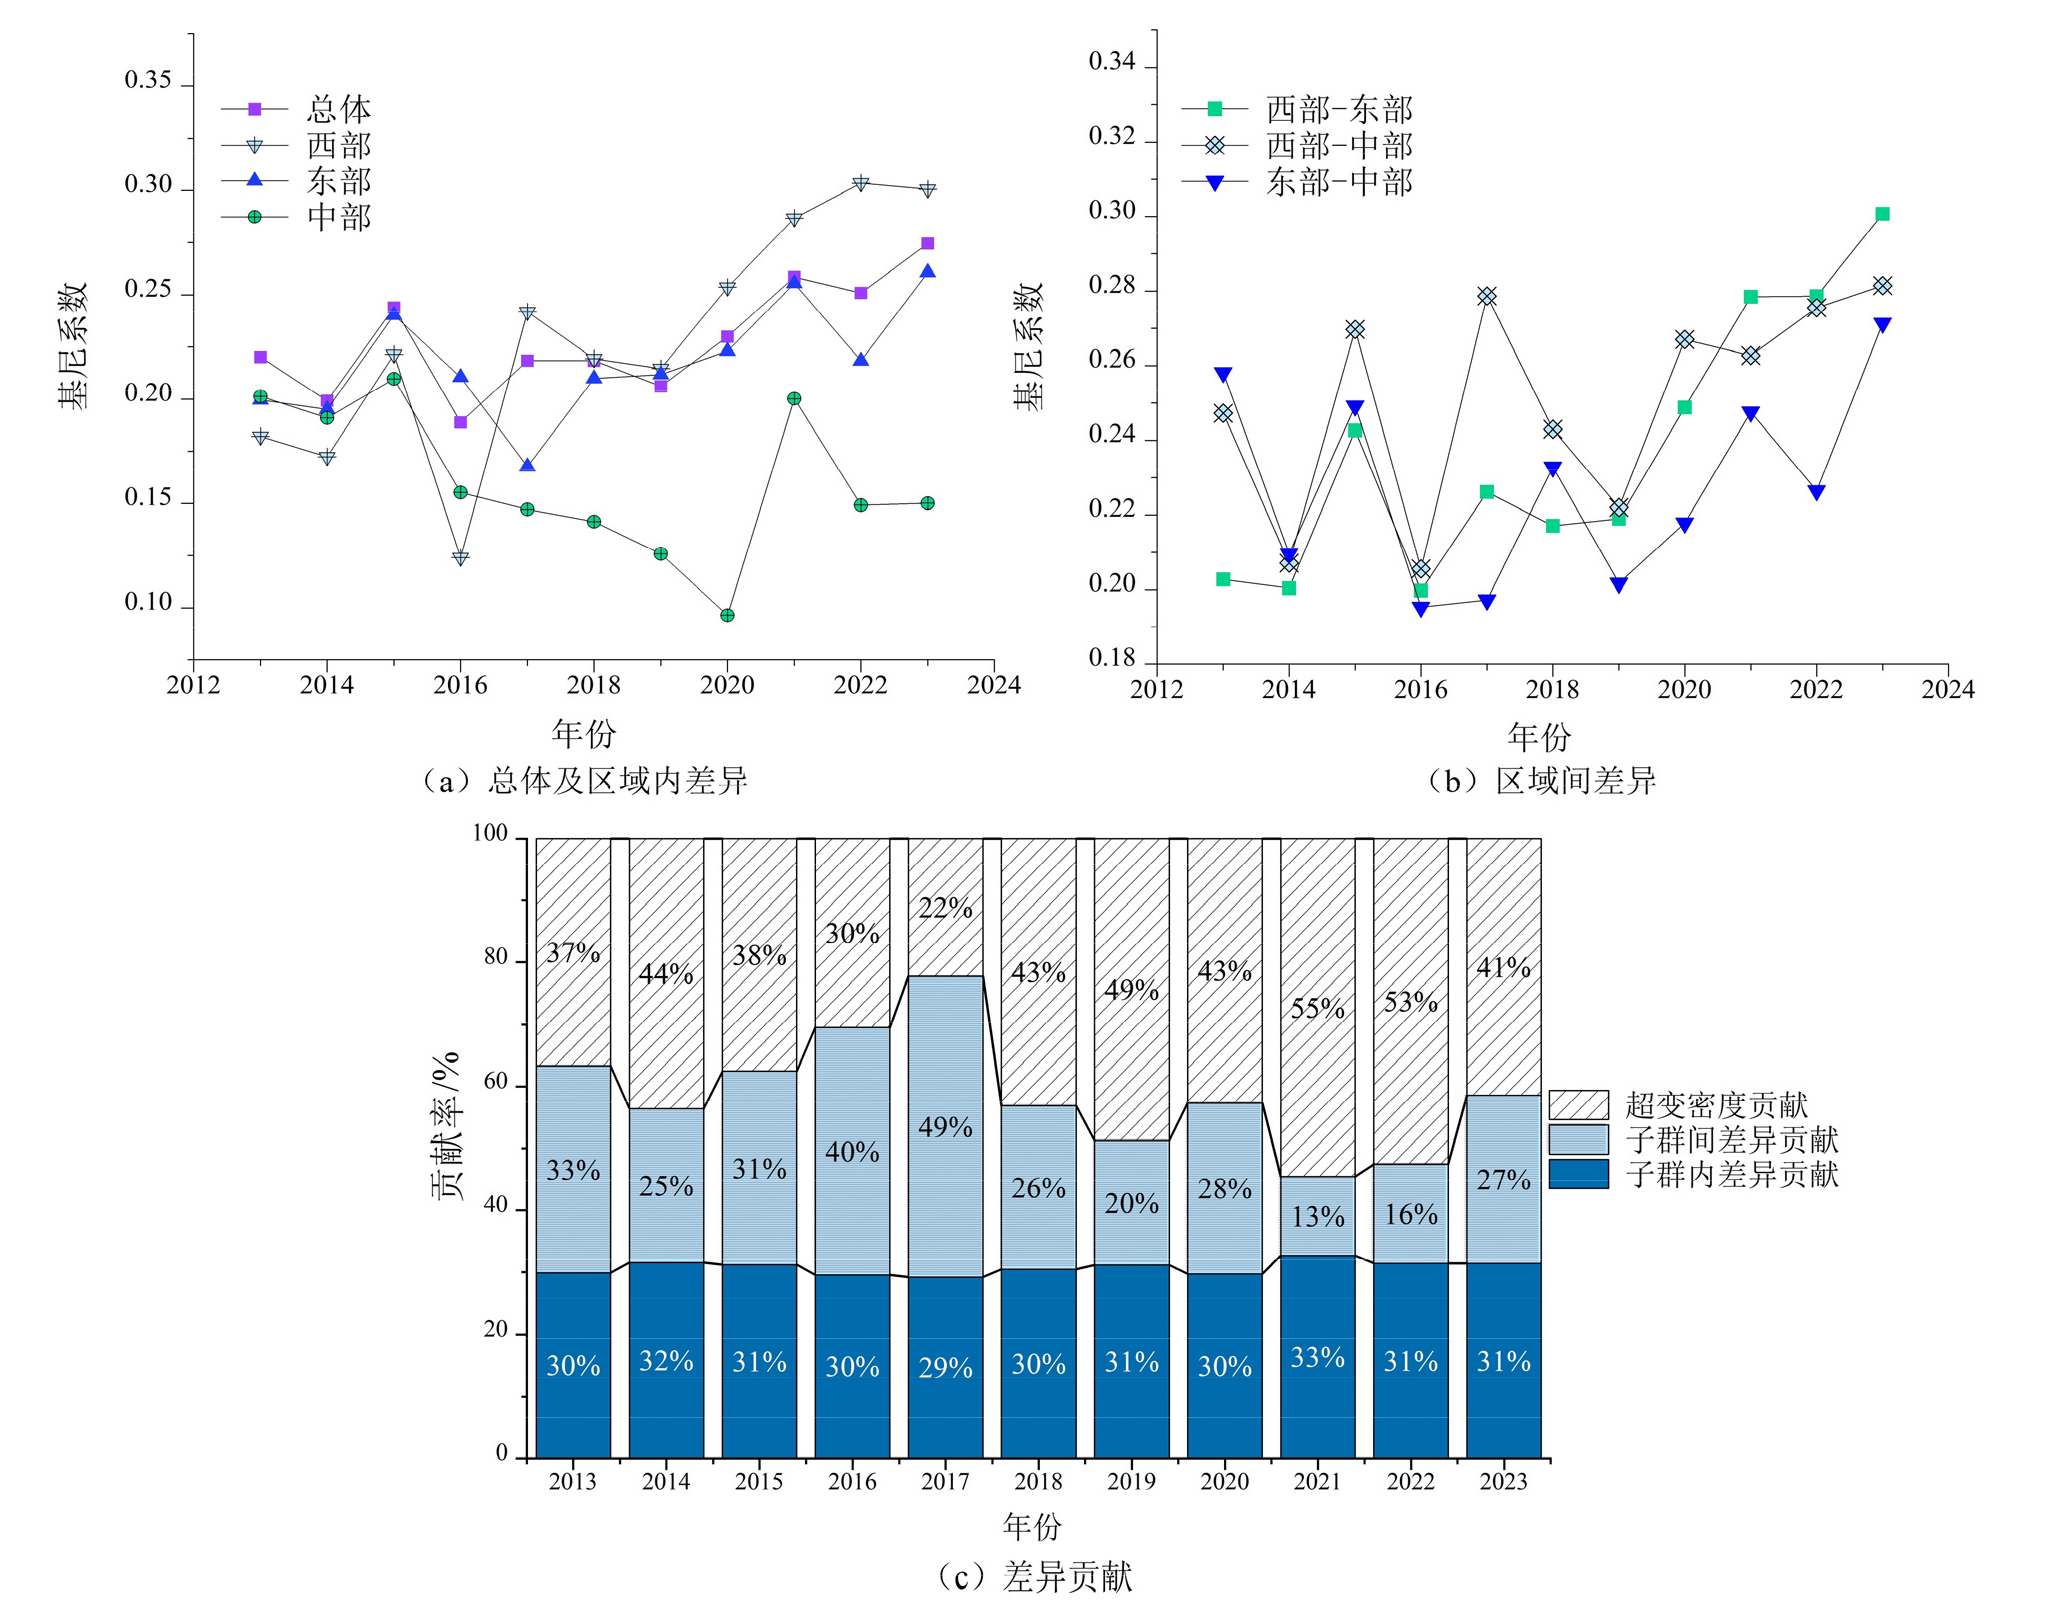
Figure 3 Sources of eco-economic efficiency differences and their contributions, 2013-2023

Figure 4 Kernel density map of eco-economic efficiency, 2013-2023
| 效率水平k | 样本量 | 低效率 | 较低效率 | 较高效率 | 高效率 |
|---|---|---|---|---|---|
| 1 | 70 | 0.60 | 0.30 | 0.09 | 0.01 |
| 2 | 73 | 0.32 | 0.48 | 0.15 | 0.05 |
| 3 | 74 | 0.09 | 0.19 | 0.55 | 0.16 |
| 4 | 73 | 0.00 | 0.05 | 0.18 | 0.77 |
Table 5 Traditional Markov transfer probability matrix for eco-economic efficiency levels, 2013-2023
| 效率水平k | 样本量 | 低效率 | 较低效率 | 较高效率 | 高效率 |
|---|---|---|---|---|---|
| 1 | 70 | 0.60 | 0.30 | 0.09 | 0.01 |
| 2 | 73 | 0.32 | 0.48 | 0.15 | 0.05 |
| 3 | 74 | 0.09 | 0.19 | 0.55 | 0.16 |
| 4 | 73 | 0.00 | 0.05 | 0.18 | 0.77 |
| 邻域类型 | 效率水平k | 样本量 | 低效率 | 较低效率 | 较高效率 | 高效率 | |
|---|---|---|---|---|---|---|---|
| 低效率 | 1 | 1 | 0.00 | 0.00 | 1.00 | 0.00 | |
| 2 | 1 | 0.00 | 1.00 | 0.00 | 0.00 | ||
| 3 | 6 | 0.00 | 0.00 | 0.67 | 0.33 | ||
| 4 | 4 | 0.00 | 0.00 | 0.00 | 1.00 | ||
| 较低效率 | 1 | 24 | 0.54 | 0.38 | 0.08 | 0.00 | |
| 2 | 23 | 0.22 | 0.43 | 0.30 | 0.04 | ||
| 3 | 20 | 0.05 | 0.25 | 0.60 | 0.10 | ||
| 4 | 27 | 0.00 | 0.04 | 0.15 | 0.81 | ||
| 较高效率 | 1 | 41 | 0.61 | 0.29 | 0.07 | 0.02 | |
| 2 | 48 | 0.35 | 0.52 | 0.06 | 0.06 | ||
| 3 | 42 | 0.14 | 0.17 | 0.50 | 0.19 | ||
| 4 | 41 | 0.00 | 0.07 | 0.22 | 0.71 | ||
| 高效率 | 1 | 4 | 1.00 | 0.00 | 0.00 | 0.00 | |
| 2 | 2 | 0.50 | 0.50 | 0.00 | 0.00 | ||
| 3 | 5 | 0.00 | 0.20 | 0.80 | 0.00 | ||
| 4 | 1 | 0.00 | 0.00 | 0.00 | 1.00 | ||
Table 6 Spatial Markov transfer probability matrix for eco-economic efficiency levels, 2013-2023
| 邻域类型 | 效率水平k | 样本量 | 低效率 | 较低效率 | 较高效率 | 高效率 | |
|---|---|---|---|---|---|---|---|
| 低效率 | 1 | 1 | 0.00 | 0.00 | 1.00 | 0.00 | |
| 2 | 1 | 0.00 | 1.00 | 0.00 | 0.00 | ||
| 3 | 6 | 0.00 | 0.00 | 0.67 | 0.33 | ||
| 4 | 4 | 0.00 | 0.00 | 0.00 | 1.00 | ||
| 较低效率 | 1 | 24 | 0.54 | 0.38 | 0.08 | 0.00 | |
| 2 | 23 | 0.22 | 0.43 | 0.30 | 0.04 | ||
| 3 | 20 | 0.05 | 0.25 | 0.60 | 0.10 | ||
| 4 | 27 | 0.00 | 0.04 | 0.15 | 0.81 | ||
| 较高效率 | 1 | 41 | 0.61 | 0.29 | 0.07 | 0.02 | |
| 2 | 48 | 0.35 | 0.52 | 0.06 | 0.06 | ||
| 3 | 42 | 0.14 | 0.17 | 0.50 | 0.19 | ||
| 4 | 41 | 0.00 | 0.07 | 0.22 | 0.71 | ||
| 高效率 | 1 | 4 | 1.00 | 0.00 | 0.00 | 0.00 | |
| 2 | 2 | 0.50 | 0.50 | 0.00 | 0.00 | ||
| 3 | 5 | 0.00 | 0.20 | 0.80 | 0.00 | ||
| 4 | 1 | 0.00 | 0.00 | 0.00 | 1.00 | ||
| [1] |
BIAN J, REN H, LIU P, 2020. Evaluation of urban ecological well-being performance in China: A case study of 30 provincial capital cities[J]. Journal of Cleaner Production, 254: 120109.
DOI URL |
| [2] |
DAGUM C, 1997. A new approach to the decomposition of the Gini income inequality ratio[J]. Empirical Economics, 22(4): 515-531.
DOI URL |
| [3] |
DALY H E, 1992. Allocation, distribution, and scale: Towards an economics that is efficient, just, and sustainable[J]. Ecological Economics, 6(3): 185-193.
DOI URL |
| [4] |
LI C Y, 2022. China’s multi-dimensional ecological well-being performance evaluation: A new method based on coupling coordination model[J]. Ecological Indicators, 143: 109321.
DOI URL |
| [5] |
LIN T Y, CHIU Y H, LU J S, et al., 2025. Evaluating European countries’ progress towards SDGs: Insights from parallel SBM DEA analysis of economic, healthcare, environmental, and educational efficiencies[J]. Journal of Environmental Management, 378: 124782.
DOI URL |
| [6] |
LIU D, LIU T G, ZHENG Y T, 2024. Study on urban green development efficiency of Jiangsu, Zhejiang and Fujian in China: A mixed network SBM approach[J]. Kybernetes, 54(8): 4436-4461.
DOI URL |
| [7] |
LIU J G, MOONEY H, HULL V, et al., 2015. Systems integration for global sustainability[J]. Science, 347(6225): 1258832.
DOI URL |
| [8] |
PARZEN E, 1962. On estimation of a probability density function and mode[J]. The Annals of Mathematical Statistics, 33(3): 1065-1076.
DOI URL |
| [9] |
ROSENBLATT M, 1956. Remarks on some nonparametric estimates of a density function[J]. The Annals of Mathematical Statistics, 27(3): 832-837.
DOI URL |
| [10] |
SHEN Z Y, WU H T, BAI K X, et al., 2022. Integrating economic, environmental and societal performance within the productivity measurement[J]. Technological Forecasting and Social Change, 176: 121463.
DOI URL |
| [11] |
TONE K, TSUTSUI M, 2009. Network DEA: A slacks-based measure approach[J]. European Journal of Operational Research, 197(1): 243-252.
DOI URL |
| [12] |
WANG H D, FENG Y, XU S G, et al., 2023. Analysis of spatial-temporal pattern, dynamic evolution and influencing factors of health tourism development in China[J]. Scientific Reports, 13(1): 15436.
DOI |
| [13] |
WANG Z, DENG X Z, WONG C, et al., 2018. Learning urban resilience from a social-economic-ecological system perspective: A case study of Beijing from 1978 to 2015[J]. Journal of Cleaner Production, 183: 343-357.
DOI URL |
| [14] |
WU J, ZHU Q Y, JI X, et al., 2016. Two-stage network processes with shared resources and resources recovered from undesirable outputs[J]. European Journal of Operational Research, 251(1): 182-197.
DOI URL |
| [15] |
YANG R, WU S M, WONG C W Y, et al., 2022. The recent ecological efficiency development in China: Interactive systems of economy, society and environment[J]. Technological and Economic Development of Economy, 29(1): 217-252.
DOI URL |
| [16] |
YU S W, LIU J, LI L X, 2020. Evaluating provincial eco-efficiency in China: An improved network data envelopment analysis model with undesirable output[J]. Environmental Science and Pollution Research, 27(7): 6886-6903.
DOI |
| [17] |
ZHANG X P, XU Q N, ZHANG F, et al., 2014. Exploring shadow prices of carbon emissions at provincial levels in China[J]. Ecological Indicators, 46: 407-414.
DOI URL |
| [18] | 边志强, 张倩华, 2025. 资源型城市土地绿色利用效率的动态演进、空间差异及收敛性[J]. 水土保持学报, 39(2): 325-337, 377. |
| BIAN Z Q, ZHANG Q H, 2025. Dynamic evolution, spatial differences, and convergence of land green use efficiency in resource-based cities[J]. Journal of Soil and Wate, 39(2): 325-337, 377. | |
| [19] | 陈晓红, 蔡思佳, 汪阳洁, 2020. 我国生态环境监管体系的制度变迁逻辑与启示[J]. 管理世界, 36(11): 160-172. |
| CHEN X H, CAI S J, WANG Y J, 2020. The institutional evolution logic and implications of China’s ecological and environmental supervision system[J]. Management World, 36(11): 160-172. | |
| [20] | 崔许锋, 熊嘉琪, 刘雍, 2024. 农业生态效率: 进展、挑战与展望[J]. 资源与生态学报, 15(5): 1358-1367. |
|
CUI X F, XIONG J Q, LIU Y, 2024. Agricultural eco-efficiency: Progress, challenges, and prospects[J]. Journal of Resources and Ecology, 15(5): 1358-1367.
DOI |
|
| [21] | 胡彪, 孙雪, 2020. 中国三大城市群生态经济效率时空演变分析[J]. 大连理工大学学报(社会科学版), 41(1): 19-27. |
| HU B, SUN X, 2020. The spatial-temporal evolution analysis of eco-economic efficiency in China’s three urban agglomerations[J]. Journal of Dalian University of Technology (Social Science Edition), 41(1): 19-27. | |
| [22] | 黄颖利, 张雨, 石健, 2022. 中国区域生态资本效率测算及创新环境的影响[J]. 统计与决策, 38(1): 68-72. |
| HUANG Y L, ZHANG Y, SHI J, 2022. Measurement of regional eco-capital efficiency and the impact of innovation environment in China[J]. Statistics & Decision, 38(1): 68-72. | |
| [23] | 韩莹, 孙丽文, 2023. 基于Super-NSBM模型区域绿色创新效率及影响因素研究[J]. 软科学, 37(5): 115-123, 130. |
| HAN Y, SUN L W, 2023. Research on regional green innovation efficiency and influencing factors based on Super-NSBM model[J]. Soft Science, 37(5): 115-123, 130. | |
| [24] | 江孝君, 杨青山, 冯婧, 等, 2019. 中国生态-经济-社会系统协调发展时空分异及影响机制[J]. 资源开发与市场, 35(6): 741-749. |
| JIANG X J, YANG Q S, FENG J, et al., 2019. Spatial and temporal differentiation and influencing mechanisms of coordinated development of China’s ecological-economic-social system[J]. Resource Development & Market, 35(6): 741-749. | |
| [25] | 匡远配, 2011. 两型经济的衡量标准与模式: 基于生态经济效率理论的分析[J]. 经济体制改革 (6): 24-27. |
| KUANG Y P, 2011. Measurement standards and models of two type economy: Analysis based on ecological economic efficiency theory[J]. Reform of the Economic System (6): 24-27. | |
| [26] |
刘军, 马勇, 问鼎, 等, 2018. 2000-2014年中国区域生态效率测度及其时空差异[J]. 生态环境学报, 27(3): 498-508.
DOI |
| LIU J, MA Y, WEN D, et al., 2018. Measuring of regional eco-efficiency in China and its spatial-temporal differences from 2000 to 2014[J]. Ecology And Environmental Sciences, 27(3): 498-508. | |
| [27] | 龙亮军, 2019. 基于两阶段Super-NSBM模型的城市生态福利绩效评价研究[J]. 中国人口·资源与环境, 29(7): 1-10. |
| LONG L J, 2019. Evaluation of urban ecological well-being performance of Chinese major cities based on two-stage super-efficiency network SBM model[J]. Chinese Journal of Population, Resources and Environment, 29(7): 1-10. | |
| [28] | 李思迪, 贾彬彬, 钟永德, 等, 2023. 长江经济带生态经济效率时空差异特征及驱动因素[J]. 统计与决策, 39(23): 74-78. |
| LI S D, JIA B B, ZHONG Y D, et al., 2023. Characteristics of spatial and temporal differences in ecological and economic efficiency in the Yangtze River economic zone and the driving factors[J]. Statistics and Decision, 39(23): 74-78. | |
| [29] | 马世骏, 王如松, 1984. 社会-经济-自然复合生态系统[J]. 生态学报, 4(1): 1-9. |
| MA S J, WANG R S, 1984. The social-economic-natural complex ecosystem[J]. Acta Ecologica Sinica, 4(1): 1-9. | |
| [30] | 马艳, 2023. 基于两阶段Super-NSBM模型的农业生态效率及影响因素研究——以长江经济带为例[J]. 长江流域资源与环境, 32(4): 883-894. |
| MA Y, 2023. Study on agricultural ecological efficiency and its influencing factors based on a two-stage Super-NSBM model: A case study of the Yangtze River economic belt[J]. Resources and Environment in the Yangtze Basin, 32(4): 883-894. | |
| [31] | 马倩倩, 陈诗一, 2023. 经济收敛与环境失衡:基于西部大开发战略的研究[J]. 世界经济, 46(8): 108-133. |
| MA Q Q, CHEN S Y, 2023. Economic convergence and environmental disparities: Evidence from the Western development program[J]. World Economy, 46(8): 108-133. | |
| [32] | 任腾, 陈晓春, 2015. 基于DEAHP模型的区域生态经济系统可持续发展评价[J]. 湖南大学学报(自然科学版), 42(3): 132-139. |
| REN T, CHEN X C, 2015. Sustainable development of regional ecological economic systems based on DEAHP model[J]. Journal of Hunan University (Natural Sciences), 42(3): 132-139. | |
| [33] | 任腾, 李姝萱, 许洪波, 等, 2020. 生态优先视角下区域生态经济系统效率评价[J]. 中南林业科技大学学报(社会科学版), 14(3): 29-37. |
| REN T, LI S X, XU H B, et al., 2020. Research on the efficiency evaluation and improvement countermeasures of regional eco-economic system from the perspective of ecological priority[J]. Journal of Central South University of Forestry & Technology (Social Sciences), 14(3): 29-37. | |
| [34] | 任腾, 李姝萱, 周忠宝, 等, 2022. 基于满意度BLP-DEA的区域可持续发展系统效率评价研究[J]. 中国管理科学, 30(7): 99-109. |
| REN T, LI S X, ZHOU Z B, et al., 2022. Study on efficiency evaluation of regional sustainable development system based on BLP-DEA and satisfaction degree[J]. Chinese Journal of Management Science, 30(7): 99-109. | |
| [35] | 田泽, 肖芊芊, 陈柯婧, 等, 2022. 绿色创新背景下长三角地区生态效率时空差异及影响因素研究[J]. 资源与产业, 24(2): 42-53. |
| TIAN Z, XIAO Q Q, CHEN K J, et al., 2022. Temporal-spatial variance and factors of ecological efficiency in Yangtze River delta under green innovation[J]. Resources & Industries, 24(2): 42-53. | |
| [36] | 王科, 刘永艳, 2020. 2020年中国碳市场回顾与展望[J]. 北京理工大学学报(社会科学版), 22(2): 10-19. |
| WANG K, LIU Y Y, 2020. China’s carbon market: reviews and prospects for 2020[J]. Journal of Beijing Institute of Technology (Social Sciences Edition), 22(2): 10-19. | |
| [37] |
王少剑, 高爽, 黄永源, 等, 2020. 基于超效率SBM模型的中国城市碳排放绩效时空演变格局及预测[J]. 地理学报, 75(6): 1316-1330.
DOI |
| WANG S J, GAO S, HUANG Y Y, et al., 2020. Spatial-temporal evolution trend prediction of urban carbon emission performance in China based on super-efficiency SBM model[J]. Journal of Geography, 75(6): 1316-1330. | |
| [38] | 尹科, 王如松, 2012. 国内外生态效率核算方法及其应用研究述评[J]. 生态学报, 32(11): 3595-3605. |
|
YIN K, WANG R S, 2012. Review of eco-efficiency accounting method and its applications[J]. Acta Ecologica Sinica, 32(11): 3595-3605.
DOI URL |
|
| [39] | 于志慧, 何昌磊, 2024. 数字金融与城市生态效率——基于长江经济带108个地级市的实证分析[J]. 华东经济管理, 38(4): 14-26. |
| YU Z H, HE C L, 2024. Digital finance and urban eco-efficiency: Empirical analysis based on 108 cities in the Yangtze river economic belt[J]. East China Economic Management, 38(4): 14-26. | |
| [40] | 袁春剑, 2024. 中国生态经济发展水平的统计测度[J]. 统计与决策, 40(3): 106-111. |
| YUAN C J, 2024. Statistical measurement of China’s ecological economic development level[J]. Statistics & Decision, 40(3): 106-111. | |
| [41] | 张煊, 王国顺, 王一苇, 2014. 生态经济效率评价及时空差异研究[J]. 经济地理, 34(12): 153-160. |
| ZHANG X, WANG G S, WANG Y W, 2014. Spatial-temporal differences of provincial eco-efficiency in China based on matrix-type network DEA[J]. Economic Geography, 34(12): 153-160. | |
| [42] | 张新林, 仇方道, 2023. 外部性视角下县域经济空间网络对生态效率的影响研究——以江苏省为例[J]. 长江流域资源与环境, 32(12): 2492-2503. |
| ZHANG X L, QIU F D, 2023. Influence of county economic spatial network on eco-efficiency in Jiangsu province from perspective of externalities[J]. Resources and Environment in The Yangtze Basin, 32(12): 2492-2503. |
| [1] | DONG Jiefang, DENG Chun, ZHANG Zhongwu. Spatio-temporal Evolution and Population Exposure Risk to PM2.5 in the Weihe River Basin [J]. Ecology and Environmental Sciences, 2023, 32(6): 1078-1088. |
| Viewed | ||||||
|
Full text |
|
|||||
|
Abstract |
|
|||||
Copyright © 2021 Editorial Office of ACTA PETROLEI SINICA
Address:No. 6 Liupukang Street, Xicheng District, Beijing, P.R.China, 510650
Tel: 86-010-62067128, 86-010-62067137, 86-010-62067139
Fax: 86-10-62067130
Email: syxb@cnpc.com.cn
Support byBeijing Magtech Co.ltd, E-mail:support@magtech.com.cn