Ecology and Environmental Sciences ›› 2025, Vol. 34 ›› Issue (11): 1675-1689.DOI: 10.16258/j.cnki.1674-5906.2025.11.002
• Papers on Carbon Cycling and Carbon Emission Reduction • Previous Articles Next Articles
LIU Jun1,2,*( ), LIU Xinyu1,2, WEN Ding3
Received:2025-03-15
Online:2025-11-18
Published:2025-11-05
刘军1,2,*(), 刘鑫宇1,2, 问鼎3
通讯作者:
作者简介:刘军(1990年生),男,副教授,博士,研究方向为生态旅游与绿色发展研究。E-mail: magicliu@hubu.edu.cn
基金资助:CLC Number:
LIU Jun, LIU Xinyu, WEN Ding. Research on the Spatiotemporal Pattern, Network Characteristics, and Synergistic Effects of Carbon Emissions Reduction in Regional Tourism in China[J]. Ecology and Environmental Sciences, 2025, 34(11): 1675-1689.
刘军, 刘鑫宇, 问鼎. 中国区域旅游碳排放网络特征及碳减排协同效应研究[J]. 生态环境学报, 2025, 34(11): 1675-1689.
Add to citation manager EndNote|Ris|BibTeX
URL: https://www.jeesci.com/EN/10.16258/j.cnki.1674-5906.2025.11.002
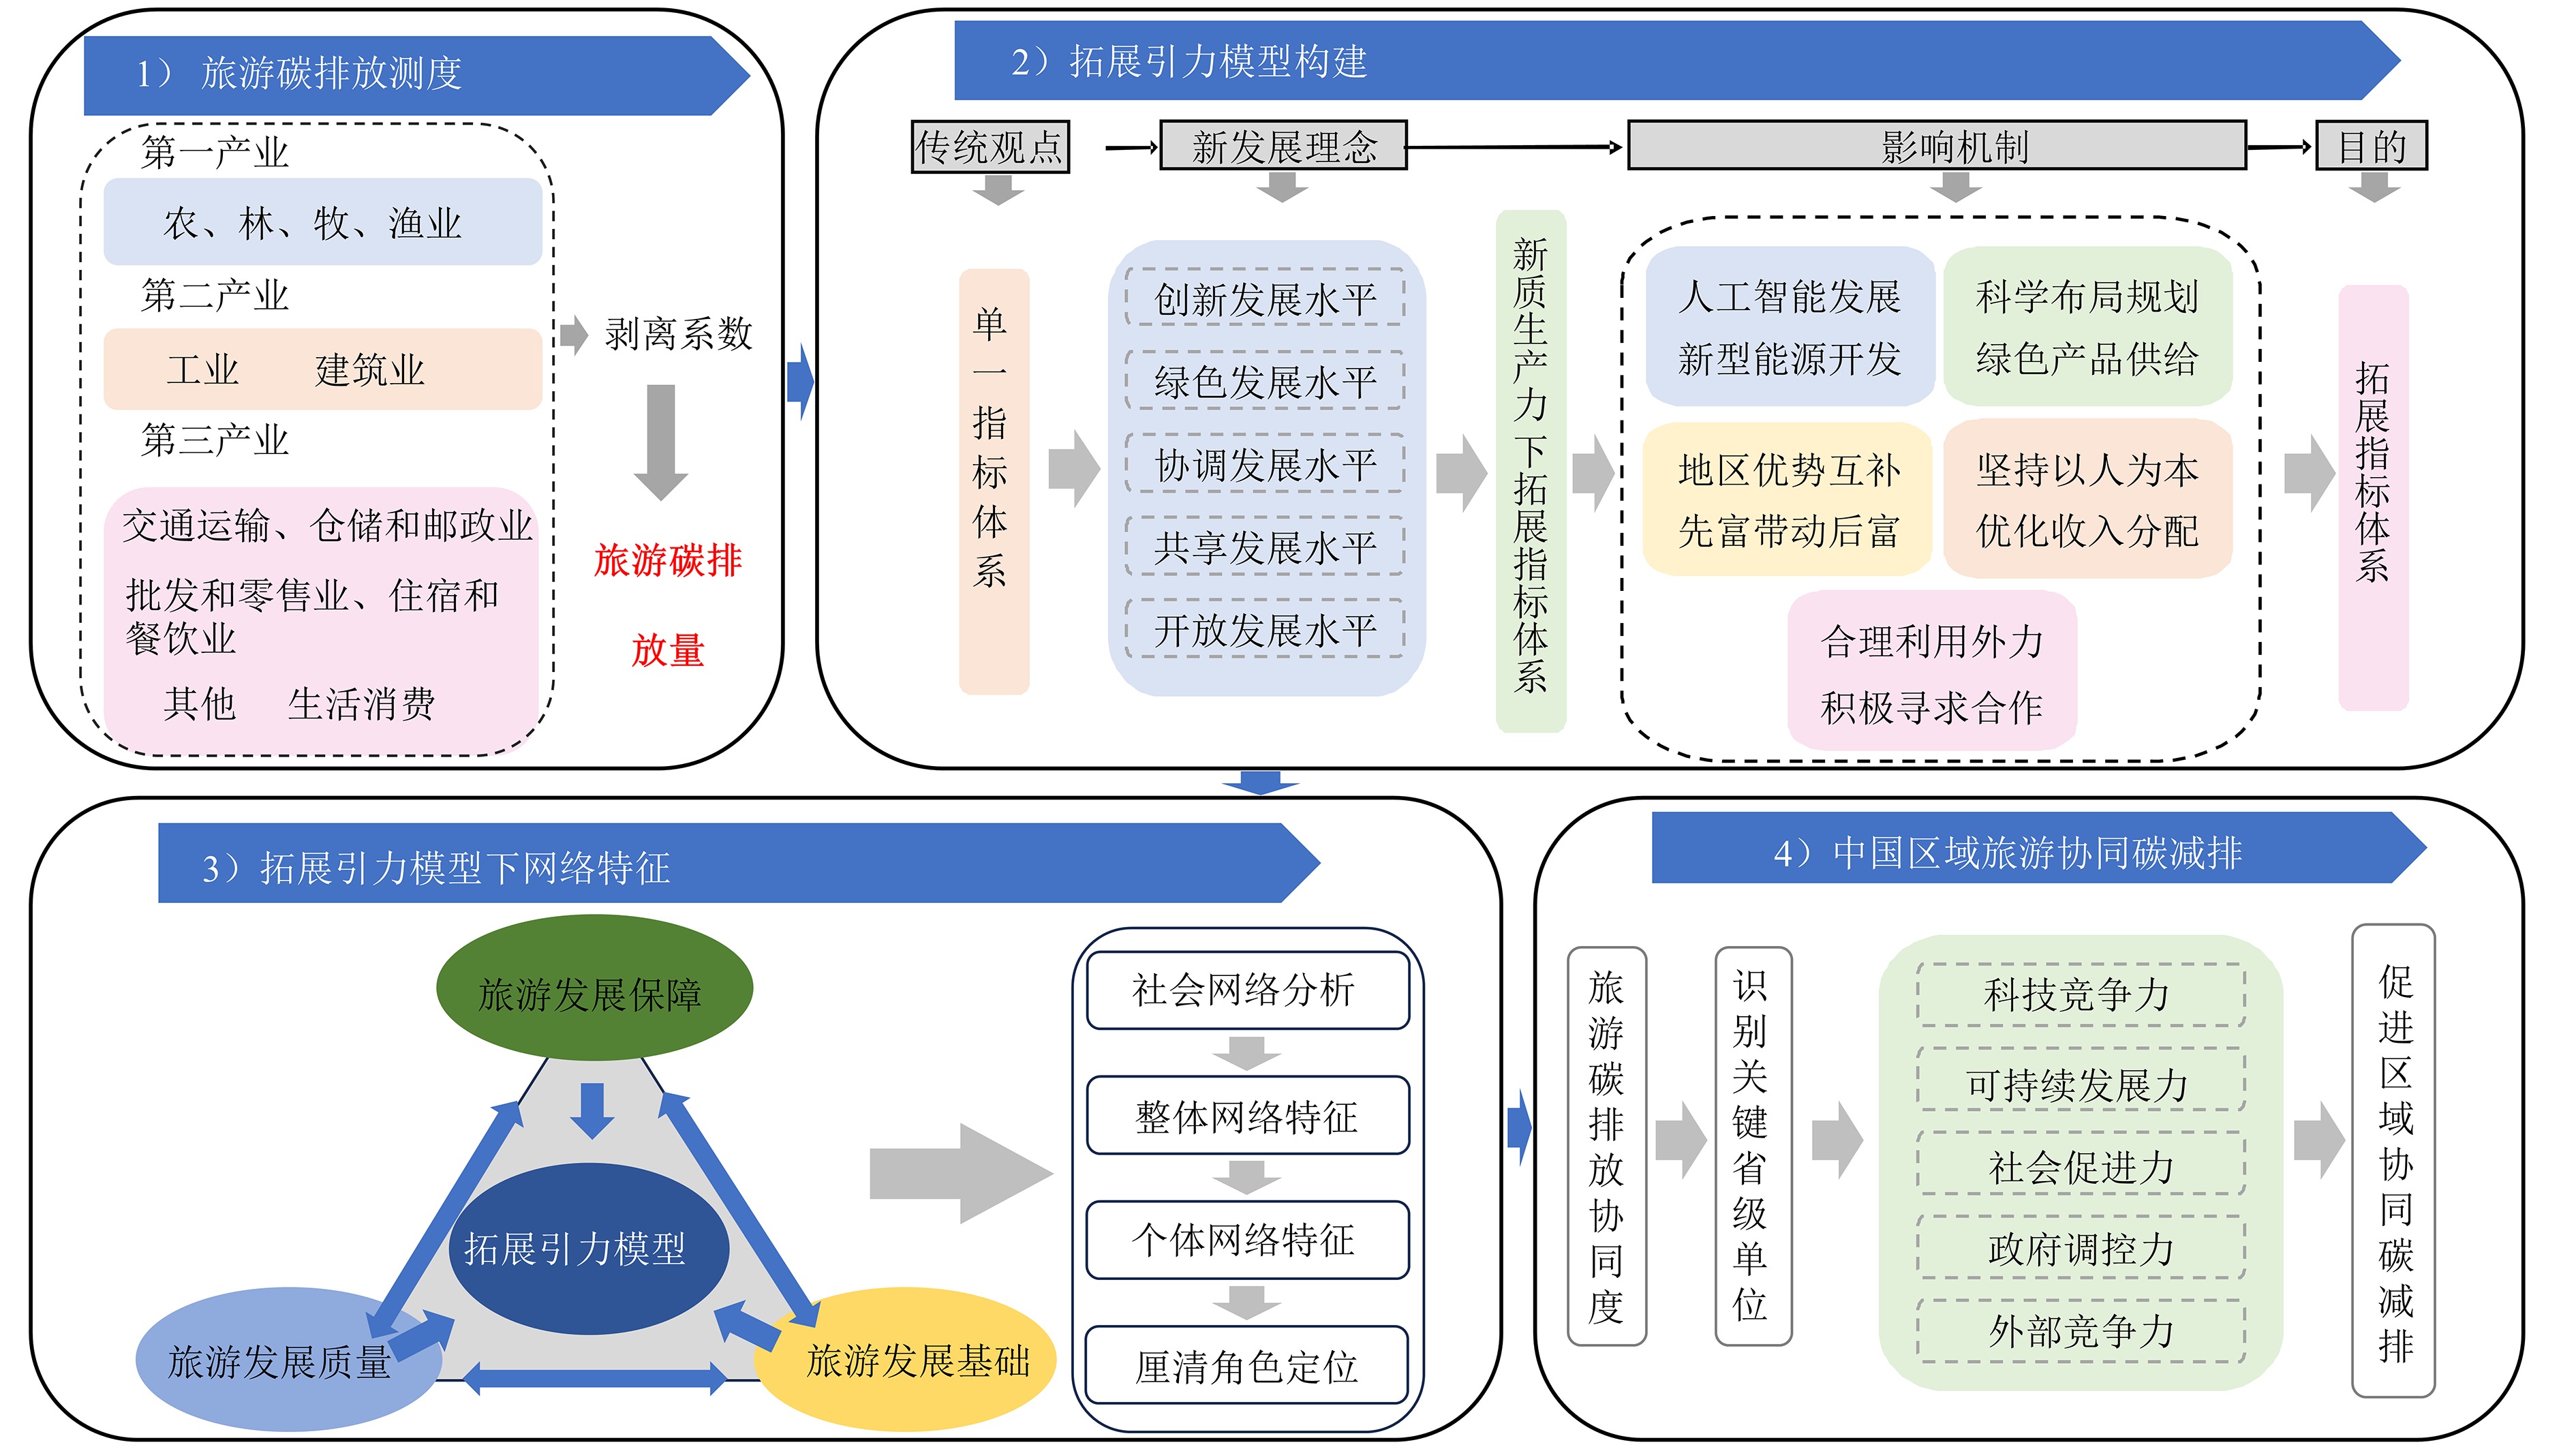
Figure 1 Comprehensive modeling framework for measuring tourism carbon emissions and synergistic emission reduction
| 一级指标 | 二级指标 | 单位 | 权重 | |
|---|---|---|---|---|
| 旅游产业发展质量 | 旅游总收入 | 亿元 | 0.0467 | |
| 旅游总人数 | 百万人 | 0.0382 | ||
| 入境旅游人数占总游客比重 | % | 0.1171 | ||
| 旅游产业发展基础 | 旅行社数量 | 个 | 0.0397 | |
| 3A以上景区数 | 个 | 0.0366 | ||
| 四星、五星饭店 | 个 | 0.0501 | ||
| 旅游产业发展保障 | 创新 | 国内发明专利申请授权量 | 项 | 0.1052 |
| 技术市场成交额占GDP比重 | % | 0.1471 | ||
| 绿色 | 人均公园陆地面积数 | 平方米/人 | 0.0241 | |
| 垃圾无害化处理率 | % | 0.0159 | ||
| 协调 | 城镇化率 | % | 0.0409 | |
| 城乡居民可支配收入比 | % | 0.0197 | ||
| 共享 | 人均拥有道路面积 | 平方米/人 | 0.0174 | |
| 公共图书馆数量 | 个 | 0.0360 | ||
| 开放 | 外商投资总额占GDP比重 | % | 0.1130 | |
| 各地区进出口总额 | 亿元 | 0.1523 | ||
Table 1 Tourism industry development evaluation indicator system and weighting
| 一级指标 | 二级指标 | 单位 | 权重 | |
|---|---|---|---|---|
| 旅游产业发展质量 | 旅游总收入 | 亿元 | 0.0467 | |
| 旅游总人数 | 百万人 | 0.0382 | ||
| 入境旅游人数占总游客比重 | % | 0.1171 | ||
| 旅游产业发展基础 | 旅行社数量 | 个 | 0.0397 | |
| 3A以上景区数 | 个 | 0.0366 | ||
| 四星、五星饭店 | 个 | 0.0501 | ||
| 旅游产业发展保障 | 创新 | 国内发明专利申请授权量 | 项 | 0.1052 |
| 技术市场成交额占GDP比重 | % | 0.1471 | ||
| 绿色 | 人均公园陆地面积数 | 平方米/人 | 0.0241 | |
| 垃圾无害化处理率 | % | 0.0159 | ||
| 协调 | 城镇化率 | % | 0.0409 | |
| 城乡居民可支配收入比 | % | 0.0197 | ||
| 共享 | 人均拥有道路面积 | 平方米/人 | 0.0174 | |
| 公共图书馆数量 | 个 | 0.0360 | ||
| 开放 | 外商投资总额占GDP比重 | % | 0.1130 | |
| 各地区进出口总额 | 亿元 | 0.1523 | ||
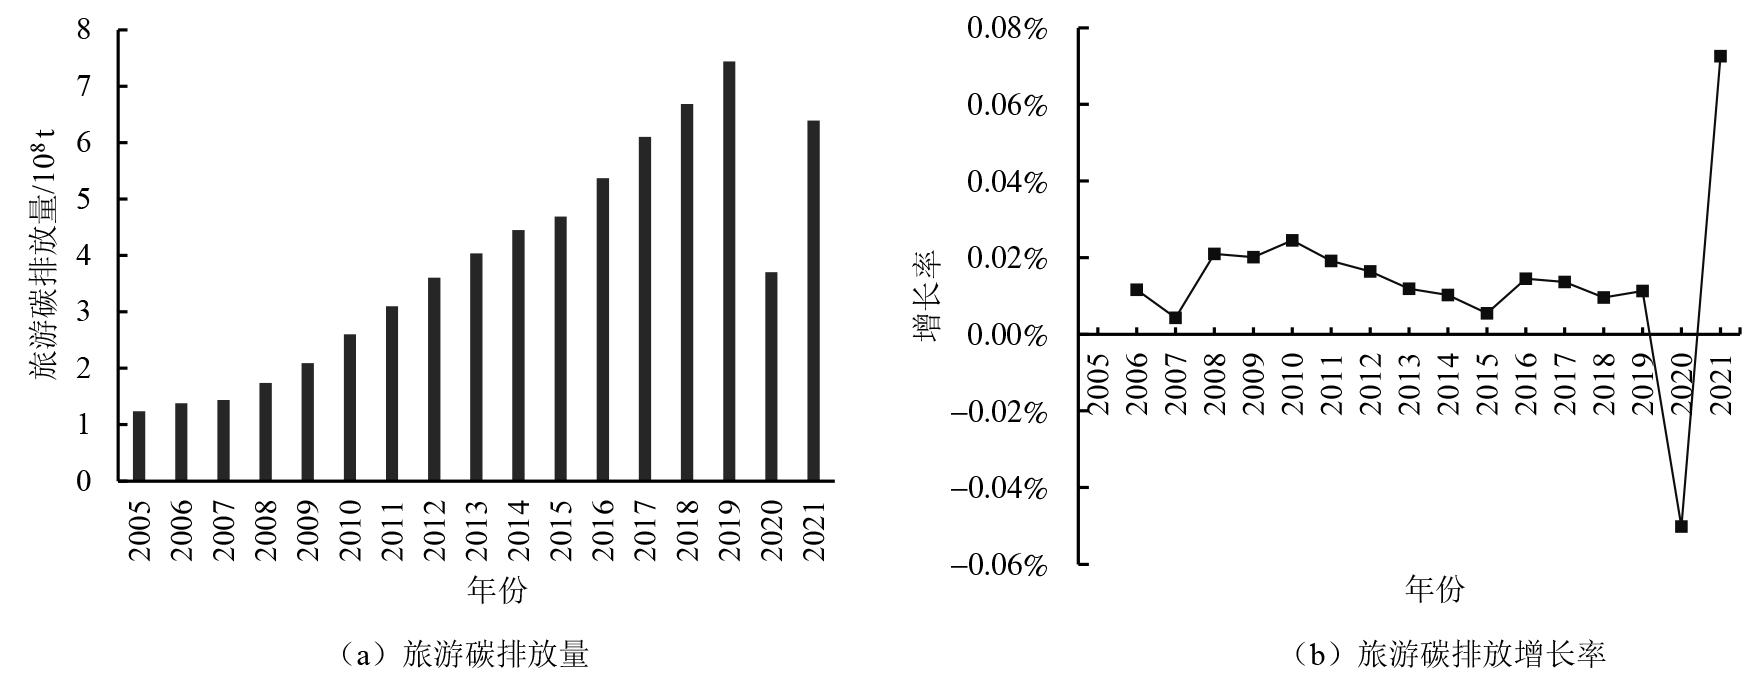
Figure 2 Total carbon emissions and growth rate from regional tourism in China

Figure 3 Spatial distribution pattern of carbon emissions from regional tourism in China

Figure 4 Results of standard deviation ellipse analysis

Figure 5 Correlation of carbon emission gravitational values of regional tourism in China
| 年份 | 网络密度 | 网络关联度 | 网络等级度 | 网络效率 |
|---|---|---|---|---|
| 2005 | 0.072 | 0.483 | 0.261 | 0.900 |
| 2006 | 0.077 | 0.437 | 0.191 | 0.877 |
| 2007 | 0.075 | 0.483 | 0.268 | 0.905 |
| 2008 | 0.082 | 0.483 | 0.199 | 0.884 |
| 2009 | 0.082 | 0.531 | 0.203 | 0.886 |
| 2010 | 0.086 | 0.531 | 0.368 | 0.862 |
| 2011 | 0.085 | 0.531 | 0.288 | 0.857 |
| 2012 | 0.087 | 0.531 | 0.288 | 0.852 |
| 2013 | 0.076 | 0.531 | 0.458 | 0.881 |
| 2014 | 0.076 | 0.437 | 0.309 | 0.848 |
| 2015 | 0.069 | 0.437 | 0.452 | 0.871 |
| 2016 | 0.072 | 0.483 | 0.455 | 0.874 |
| 2017 | 0.076 | 0.483 | 0.521 | 0.863 |
| 2018 | 0.0713 | 0.393 | 0.559 | 0.830 |
| 2019 | 0.071 | 0.437 | 0.596 | 0.848 |
| 2020 | 0.082 | 0.531 | 0.500 | 0.857 |
| 2021 | 0.078 | 0.393 | 0.435 | 0.778 |
Table 2 The overall characteristics of the tourism carbon emission network in Chinese provinces
| 年份 | 网络密度 | 网络关联度 | 网络等级度 | 网络效率 |
|---|---|---|---|---|
| 2005 | 0.072 | 0.483 | 0.261 | 0.900 |
| 2006 | 0.077 | 0.437 | 0.191 | 0.877 |
| 2007 | 0.075 | 0.483 | 0.268 | 0.905 |
| 2008 | 0.082 | 0.483 | 0.199 | 0.884 |
| 2009 | 0.082 | 0.531 | 0.203 | 0.886 |
| 2010 | 0.086 | 0.531 | 0.368 | 0.862 |
| 2011 | 0.085 | 0.531 | 0.288 | 0.857 |
| 2012 | 0.087 | 0.531 | 0.288 | 0.852 |
| 2013 | 0.076 | 0.531 | 0.458 | 0.881 |
| 2014 | 0.076 | 0.437 | 0.309 | 0.848 |
| 2015 | 0.069 | 0.437 | 0.452 | 0.871 |
| 2016 | 0.072 | 0.483 | 0.455 | 0.874 |
| 2017 | 0.076 | 0.483 | 0.521 | 0.863 |
| 2018 | 0.0713 | 0.393 | 0.559 | 0.830 |
| 2019 | 0.071 | 0.437 | 0.596 | 0.848 |
| 2020 | 0.082 | 0.531 | 0.500 | 0.857 |
| 2021 | 0.078 | 0.393 | 0.435 | 0.778 |

Figure 6 Individual network characteristics of carbon emissions from regional tourism in China
| 省份 | 年份 | 均值 | |||
|---|---|---|---|---|---|
| 2005 | 2010 | 2015 | 2021 | ||
| 北京 | 0.094 | 0.051 | 0.031 | 0.016 | 0.041 |
| 天津 | 0.202 | 0.108 | 0.060 | 0.050 | 0.089 |
| 河北 | 0.194 | 0.141 | 0.106 | 0.072 | 0.114 |
| 山西 | 0.351 | 0.530 | 0.602 | 0.422 | 0.490 |
| 内蒙古 | 0.488 | 0.626 | 0.365 | 0.292 | 0.430 |
| 辽宁 | 0.338 | 0.230 | 0.143 | 0.126 | 0.190 |
| 吉林 | 0.334 | 0.200 | 0.137 | 0.110 | 0.171 |
| 黑龙江 | 0.444 | 0.430 | 0.322 | 0.226 | 0.340 |
| 上海 | 0.118 | 0.066 | 0.040 | 0.026 | 0.055 |
| 江苏 | 0.089 | 0.056 | 0.037 | 0.027 | 0.048 |
| 浙江 | 0.123 | 0.088 | 0.057 | 0.041 | 0.071 |
| 安徽 | 0.117 | 0.102 | 0.099 | 0.071 | 0.097 |
| 福建 | 0.095 | 0.073 | 0.051 | 0.043 | 0.061 |
| 江西 | 0.146 | 0.096 | 0.062 | 0.051 | 0.080 |
| 山东 | 0.276 | 0.182 | 0.089 | 0.064 | 0.141 |
| 河南 | 0.188 | 0.129 | 0.088 | 0.068 | 0.108 |
| 湖北 | 0.149 | 0.121 | 0.058 | 0.050 | 0.088 |
| 湖南 | 0.135 | 0.097 | 0.068 | 0.045 | 0.085 |
| 广东 | 0.091 | 0.069 | 0.049 | 0.041 | 0.060 |
| 广西 | 0.114 | 0.099 | 0.062 | 0.160 | 0.085 |
| 海南 | 0.071 | 0.188 | 0.143 | 0.079 | 0.129 |
| 重庆 | 0.115 | 0.077 | 0.056 | 0.035 | 0.067 |
| 四川 | 0.153 | 0.110 | 0.046 | 0.037 | 0.080 |
| 贵州 | 0.533 | 0.457 | 0.331 | 0.178 | 0.349 |
| 云南 | 0.200 | 0.133 | 0.073 | 0.027 | 0.100 |
| 陕西 | 0.522 | 0.286 | 0.197 | 0.156 | 0.259 |
| 甘肃 | 0.291 | 0.220 | 0.144 | 0.134 | 0.182 |
| 青海 | 0.283 | 0.181 | 0.101 | 0.082 | 0.154 |
| 宁夏 | 0.513 | 0.375 | 0.204 | 0.169 | 0.289 |
| 新疆 | 0.380 | 0.328 | 0.222 | 0.213 | 0.264 |
Table 3
| 省份 | 年份 | 均值 | |||
|---|---|---|---|---|---|
| 2005 | 2010 | 2015 | 2021 | ||
| 北京 | 0.094 | 0.051 | 0.031 | 0.016 | 0.041 |
| 天津 | 0.202 | 0.108 | 0.060 | 0.050 | 0.089 |
| 河北 | 0.194 | 0.141 | 0.106 | 0.072 | 0.114 |
| 山西 | 0.351 | 0.530 | 0.602 | 0.422 | 0.490 |
| 内蒙古 | 0.488 | 0.626 | 0.365 | 0.292 | 0.430 |
| 辽宁 | 0.338 | 0.230 | 0.143 | 0.126 | 0.190 |
| 吉林 | 0.334 | 0.200 | 0.137 | 0.110 | 0.171 |
| 黑龙江 | 0.444 | 0.430 | 0.322 | 0.226 | 0.340 |
| 上海 | 0.118 | 0.066 | 0.040 | 0.026 | 0.055 |
| 江苏 | 0.089 | 0.056 | 0.037 | 0.027 | 0.048 |
| 浙江 | 0.123 | 0.088 | 0.057 | 0.041 | 0.071 |
| 安徽 | 0.117 | 0.102 | 0.099 | 0.071 | 0.097 |
| 福建 | 0.095 | 0.073 | 0.051 | 0.043 | 0.061 |
| 江西 | 0.146 | 0.096 | 0.062 | 0.051 | 0.080 |
| 山东 | 0.276 | 0.182 | 0.089 | 0.064 | 0.141 |
| 河南 | 0.188 | 0.129 | 0.088 | 0.068 | 0.108 |
| 湖北 | 0.149 | 0.121 | 0.058 | 0.050 | 0.088 |
| 湖南 | 0.135 | 0.097 | 0.068 | 0.045 | 0.085 |
| 广东 | 0.091 | 0.069 | 0.049 | 0.041 | 0.060 |
| 广西 | 0.114 | 0.099 | 0.062 | 0.160 | 0.085 |
| 海南 | 0.071 | 0.188 | 0.143 | 0.079 | 0.129 |
| 重庆 | 0.115 | 0.077 | 0.056 | 0.035 | 0.067 |
| 四川 | 0.153 | 0.110 | 0.046 | 0.037 | 0.080 |
| 贵州 | 0.533 | 0.457 | 0.331 | 0.178 | 0.349 |
| 云南 | 0.200 | 0.133 | 0.073 | 0.027 | 0.100 |
| 陕西 | 0.522 | 0.286 | 0.197 | 0.156 | 0.259 |
| 甘肃 | 0.291 | 0.220 | 0.144 | 0.134 | 0.182 |
| 青海 | 0.283 | 0.181 | 0.101 | 0.082 | 0.154 |
| 宁夏 | 0.513 | 0.375 | 0.204 | 0.169 | 0.289 |
| 新疆 | 0.380 | 0.328 | 0.222 | 0.213 | 0.264 |

Figure 7 National regional tourism carbon emission synergy
| 地区 | 省份 | 2005 | 2010 | 2015 | 2021 | 均值 |
|---|---|---|---|---|---|---|
| 东部地区 | 上海 | 0.987 | 0.709 | 0.310 | 0.950 | 0.799 |
| 江苏 | −2.104 | 0.624 | 0.999 | −2.225 | 0.003 | |
| 浙江 | −2.555 | 0.653 | 0.863 | −0.333 | 0.033 | |
| 天津 | 0.017 | 0.815 | 0.998 | 0.410 | 0.385 | |
| 河北 | −0.791 | 0.192 | 0.996 | −2.174 | −0.240 | |
| 福建 | −1.130 | 0.301 | 0.899 | −3.358 | −0.471 | |
| 山东 | −2.036 | 0.881 | 0.935 | −0.953 | 0.025 | |
| 海南 | −2.934 | 0.640 | 0.967 | −7.937 | −0.526 | |
| 广东 | −0.982 | 0.478 | 0.996 | 0.126 | 0.208 | |
| 中部地区 | 山西 | 0.980 | 0.999 | 0.888 | 0.308 | 0.880 |
| 安徽 | 0.932 | 0.991 | 0.886 | 0.908 | 0.902 | |
| 河南 | 0.864 | 0.930 | 0.915 | 0.795 | 0.863 | |
| 湖北 | 0.826 | 0.902 | 0.964 | 1.000 | 0.849 | |
| 湖南 | 0.955 | 0.998 | 0.992 | 0.893 | 0.958 | |
| 西部地区 | 四川 | 0.906 | 0.997 | 0.914 | 0.146 | 0.795 |
| 贵州 | 0.995 | 0.966 | 0.919 | −0.093 | 0.793 | |
| 云南 | 0.994 | 0.970 | 0.775 | 0.596 | 0.703 | |
| 陕西 | 0.997 | 0.953 | 0.866 | 0.295 | 0.832 | |
| 甘肃 | 1.000 | 0.943 | 0.801 | −1.708 | 0.632 | |
| 青海 | 0.975 | 0.909 | 0.844 | −0.297 | 0.819 | |
| 宁夏 | 0.812 | 0.998 | 0.857 | −2.499 | 0.620 | |
| 新疆 | 0.979 | 0.966 | 0.728 | −0.171 | 0.792 | |
| 广西 | 0.906 | 0.996 | 0.532 | −9.944 | 0.046 | |
| 内蒙古 | 0.908 | 1.000 | 0.999 | 0.852 | 0.859 | |
| 东北地区 | 辽宁 | 0.745 | 0.887 | 0.688 | −3.718 | 0.295 |
| 黑龙江 | 0.928 | 0.781 | 0.984 | 0.048 | 0.753 |
Table 4 Tourism carbon emission reduction synergies in four regions
| 地区 | 省份 | 2005 | 2010 | 2015 | 2021 | 均值 |
|---|---|---|---|---|---|---|
| 东部地区 | 上海 | 0.987 | 0.709 | 0.310 | 0.950 | 0.799 |
| 江苏 | −2.104 | 0.624 | 0.999 | −2.225 | 0.003 | |
| 浙江 | −2.555 | 0.653 | 0.863 | −0.333 | 0.033 | |
| 天津 | 0.017 | 0.815 | 0.998 | 0.410 | 0.385 | |
| 河北 | −0.791 | 0.192 | 0.996 | −2.174 | −0.240 | |
| 福建 | −1.130 | 0.301 | 0.899 | −3.358 | −0.471 | |
| 山东 | −2.036 | 0.881 | 0.935 | −0.953 | 0.025 | |
| 海南 | −2.934 | 0.640 | 0.967 | −7.937 | −0.526 | |
| 广东 | −0.982 | 0.478 | 0.996 | 0.126 | 0.208 | |
| 中部地区 | 山西 | 0.980 | 0.999 | 0.888 | 0.308 | 0.880 |
| 安徽 | 0.932 | 0.991 | 0.886 | 0.908 | 0.902 | |
| 河南 | 0.864 | 0.930 | 0.915 | 0.795 | 0.863 | |
| 湖北 | 0.826 | 0.902 | 0.964 | 1.000 | 0.849 | |
| 湖南 | 0.955 | 0.998 | 0.992 | 0.893 | 0.958 | |
| 西部地区 | 四川 | 0.906 | 0.997 | 0.914 | 0.146 | 0.795 |
| 贵州 | 0.995 | 0.966 | 0.919 | −0.093 | 0.793 | |
| 云南 | 0.994 | 0.970 | 0.775 | 0.596 | 0.703 | |
| 陕西 | 0.997 | 0.953 | 0.866 | 0.295 | 0.832 | |
| 甘肃 | 1.000 | 0.943 | 0.801 | −1.708 | 0.632 | |
| 青海 | 0.975 | 0.909 | 0.844 | −0.297 | 0.819 | |
| 宁夏 | 0.812 | 0.998 | 0.857 | −2.499 | 0.620 | |
| 新疆 | 0.979 | 0.966 | 0.728 | −0.171 | 0.792 | |
| 广西 | 0.906 | 0.996 | 0.532 | −9.944 | 0.046 | |
| 内蒙古 | 0.908 | 1.000 | 0.999 | 0.852 | 0.859 | |
| 东北地区 | 辽宁 | 0.745 | 0.887 | 0.688 | −3.718 | 0.295 |
| 黑龙江 | 0.928 | 0.781 | 0.984 | 0.048 | 0.753 |
| [1] |
BECKEN S, 2002. Analyzing international tourist flows to estimate energy use associated with air travel[J]. Journal of Sustainable Tourism, 10(2): 114-3142.
DOI URL |
| [2] |
BECKEN S, FRAMPTON C, SIMMONS D, 2001. Energy consumption patterns in the accommodation sector—the New Zealand case[J]. Ecological Economics, 39(3): 371-386.
DOI URL |
| [3] |
CADARSO M, GÓMEZ N, LÓPEZ L, et al., 2015. Quantifying Spanish tourism's carbon footprint: The contributions of residents and visitors: a longitudinal study[J]. Journal of Sustainable Tourism, 23(6): 922-946.
DOI URL |
| [4] |
GE L, ZHAO H X, YANG J Y, et al., 2022. Green finance, technological progress, and ecological performance—evidence from 30 Provinces in China[J]. Environmental Science and Pollution Research, 29(44): 66295-66314.
DOI |
| [5] |
GÖSSLING S, 2002. Global environmental consequences of tourism[J]. Global Environmental Change, 12(4): 283-302.
DOI URL |
| [6] |
GÖSSLING S, PEETERS P, CERON J P, et al., 2005. The eco-efficiency of tourism[J]. Ecological economics, 54(4): 417-434.
DOI URL |
| [7] |
HUANG C, WANG J W, WANG C M, et al., 2021. Does tourism industry agglomeration reduce carbon emissions?[J]. Environmental Science and Pollution Research, 28: 30278-30293.
DOI |
| [8] | LI X T, FENG D, LI J, ZHANG Z, 2019. Research on the spatial network characteristics and synergetic abatement effect of the carbon emissions in Beijing-Tianjin-Hebei urban agglomeration[J]. Sustainability, 11(5): 1444. |
| [9] |
LIU G Y, YANG Z F, FATH B D, et al., 2017. Time and space model of urban pollution migration: Economy-energy-environment nexus network[J]. Applied Energy, 186(Part 2): 96-114.
DOI URL |
| [10] |
MANFRED L, YEN Y S, FUTU F, et al., 2018. The carbon footprint of global tourism[J]. Nature Climate Change, 8(6): 522-528.
DOI |
| [11] | PERCH-NIELSEN S, SESARTIC A, STUCKI M, 2010. The greenhouse gas intensity of the tourism sector: The case of Switzerland[J]. Environmental Science & Policy, 13(2): 131-140. |
| [12] |
WANG L G, ZHAO H X, LIU J W, et al., 2024. How does the digital economy affect carbon emissions from tourism? Empirical evidence from China[J]. Journal of Cleaner Production, 469: 143175.
DOI URL |
| [13] |
ZHA J P, YUAN W W, DAI J Q, et al., 2020. Eco-efficiency, eco-productivity and tourism growth in China: A non-convex metafrontier DEA-based decomposition model[J]. Journal of Sustainable Tourism, 28(5): 663-685.
DOI URL |
| [14] | 查建平, 戴家权, 刘珂吉, 等, 2022. 旅游增长与碳排放脱钩状态及其驱动因素研究——一个新的脱钩分析框架[J]. 旅游学刊, 37(4): 13-24. |
| ZHA J P, DAI J Q, LIU K J, et al., 2002. Decoupling relationship between tourism growth and carbon emissions and the associated driving factors: A novel analytic framework[J]. Tourism Tribune, 37(4): 13-24. | |
| [15] | 陈玲玲, 2024. 多尺度视角下中国旅游业碳排放强度时空动态研究[J]. 生态经济, 40(5): 124-131. |
| CHEN L L, 2024. Study on the spation temporal dynamics of carbon emission intensity of China’s tourism industry from a multi-scale perspective[J]. Ecological Economy, 40(5): 124-131. | |
| [16] | 丛晓男, 王铮, 2017. 中国地级及以上行政区旅游投资潜力测度与区域分异——基于Krugman地理本性论[J]. 经济地理, 37(7): 198-207. |
| CONG X N, WANG Z, 2017. Estimation and regional heterogeneity of tourism investment potential index of prefecture-level regions in China: Based on Krugman’s Geographical Nature Principle[J]. Economic Geography, 37(7): 198-207. | |
| [17] | 高威, 魏建飞, 李强, 2022. 碳排放约束下京津冀地区建设用地利用效率时空演化特征与影响因素研究[J]. 地理与地理信息科学, 38(5): 88-95. |
| GAO W, WEI J F, LI Q, 2022. Spatio-temporal evolution and influencing factors of construction land use efficiency in Beijing-Tianjin-Hebei Region under carbon emission constraint[J]. Geography and Geo-Information Science, 38(5): 88-95. | |
| [18] |
郭丽佳, 李畅, 彭红松, 等, 2021. 节能减排约束下中国省域旅游生态效率评估及空间格局研究[J]. 地理科学进展, 40(8): 1284-1297.
DOI |
| GUO L J, LI C, PENG H S, et al., 2021. Tourism eco-efficiency at the provincial level in China in the context of conservation and emission reductiorenerdy[J]. Progress in Geography, 40(8): 1284-1297. | |
| [19] |
黄昕, 陈进, 2023. 环境规制对旅游高质量发展的影响——以湘西地区为例[J]. 经济地理, 43(10): 201-210.
DOI |
|
HUANG X, CHEN J, 2023. The impact of environmental regulation on the tourism high-quality development: A case study of western Hunan[J]. Economic Geography, 43(10): 201-210.
DOI |
|
| [20] | 李江帆, 李美云, 1999. 旅游产业与旅游增加值的测算[J]. 旅游学刊 (5): 16-19, 76. |
| LI J F, LI M Y, 1999. Measurement of tourism industry and tourism value added[J]. Tourism Tribune (5): 16-19, 76. | |
| [21] | 李敬, 陈澍, 万广华, 等, 2014. 中国区域经济增长的空间关联及其解释——基于网络分析方法[J]. 经济研究, 49(11): 4-16. |
| LI J, CHEN S, WANG G H, et al., 2014. Study on the spatial correlation and explanation of regional economic growth in China: Based on analytic network process[J]. Economic Research Journal, 49(11): 4-16. | |
| [22] |
李山, 王铮, 钟章奇, 2012. 旅游空间相互作用的引力模型及其应用[J]. 地理学报, 67(4): 526-544.
DOI |
|
LI S, WANG Z, ZHONG Z Q, 2012. Gravity model for tourism spatial interaction: Basic form, parameter estimation, and applications[J]. Acta Geographica Sinica, 67(4): 526-544.
DOI |
|
| [23] |
李姝晓, 童昀, 何彪, 2023. 多情景下海南省旅游业的碳达峰与碳中和预测[J]. 经济地理, 43(6): 230-240.
DOI |
| LI S X, TONG Y, HE B, 2023. Prediction of tourism carbon peak and carbon neutrality based on multiple scenarios: A case study of Hainan province[J]. Economic Geography, 43(6): 230-240. | |
| [24] | 厉新建, 曾博伟, 张辉, 等, 2024. 新质生产力与旅游业高质量发展[J]. 旅游学刊, 39(5):15-29. |
| LI X J, ZENG B W, ZHANG H, et al., 2024. New quality productive forces and high-quality development in tourism: Problems, cognition and optimization direction[J]. Tourism Tribune, 39(5): 15-29. | |
| [25] | 刘华军, 刘传明, 孙亚男, 2015. 中国能源消费的空间关联网络结构特征及其效应研究[J]. 中国工业经济 (5): 83-95. |
| LIU H J, LIU C M, SUN Y N, 2015. Spatial correlation network structure of energy consumption and its effect in China[J]. China Industrial Economics (5): 83-95. | |
| [26] | 刘军, 邓帆帆, 2023. 中国区域旅游生态效率测度及提升路径研究[M]. 武汉: 华中科技大学出版社. |
| LIU J, DENG F F, 2023. Research on the measurement and enhancement path of regional tourism eco-efficiency in China[M]. Wuhan: Huazhong University of Science and Technology Press. | |
| [27] | 刘军, 问鼎, 童昀, 等, 2019. 基于碳排放核算的中国区域旅游业生态效率测度及比较研究[J]. 生态学报, 39(6): 1979-1992. |
| LIU J, WEN D, TONG Y, et al., 2023. Measuring of tourism eco-efficiency and its comparative research based on carbon emissions[J]. Acta Ecologica Sinica, 39(6): 1979-1992. | |
| [28] | 刘军, 岳梦婷, 2021. 区域旅游业碳排放及其影响因素——基于旅游流动性视角[J]. 中国人口·资源与环境, 31(7): 37-48. |
| LIU J, YUE M T, 2021. Carbon emissions of regional tourism industry and their influencing factors: A tourism mobility perspective[J]. China Population Resources and Environment, 31(7): 37-48. | |
| [29] |
刘雨婧, 唐健雄, 2022. 长江经济带旅游业发展质量评价及其时空演变[J]. 经济地理, 42(4): 209-219.
DOI |
|
LIU Y J, TANG J X, 2022. Evaluation and spatial-temporal evolutionof the quality of tourism development in the Yangtze River Economic Belt[J]. Economic Geography, 42(4): 209-219.
DOI |
|
| [30] |
马斌斌, 陈兴鹏, 马凯凯, 等, 2020. 中国乡村旅游重点村空间分布、类型结构及影响因素[J]. 经济地理, 40(7): 190-199.
DOI |
| MA B B, CHEN X P, MA K K, et al., 2020. Spatial distribution, type structure and influencing factors of key rural tourism villages in China[J]. Economic Geography, 40(7): 190-199. | |
| [31] | 孟德友, 陆玉麒, 2009. 基于引力模型的江苏区域经济联系强度与方向[J]. 地理科学进展, 28(5): 697-704. |
|
MENG D Y, LU Y Q, 2009. Strength and direction of regional economic linkage in Jiangsu province based on gravity model[J]. Progress in Geography, 28(5): 697-704.
DOI |
|
| [32] |
邵海琴, 吴卫, 王兆峰, 2021. 长江经济带旅游资源绿色利用效率与新型城镇化的时空耦合协调[J]. 经济地理, 41(8): 204-213.
DOI |
|
SHAO H Q, WU W, WANG Z F, 2021. Temporal and Spatial coupling coordination of green utilization efficiency of tourism resources and new urbanization in the Yangtze River Economic Belt[J]. Economic Geography, 41(8): 204-213.
DOI |
|
| [33] |
邵帅, 徐俐俐, 杨莉莉, 2023. 千里 “碳缘” 一线牵: 中国区域碳排放空间关联网络的结构特征与形成机制[J]. 系统工程理论与实践, 43(4): 958-983.
DOI |
| SHAO S, XIU L L, YANG L L, 2023. Structural characteristics and formation mechanism of carbon emission spatial association networks within China[J]. Systems Engineering-Theory & Practice, 43(4): 958-983. | |
| [34] | 宋青, 李超群, 陈骏宇, 2024. 长三角碳排放空间网络结构及协同减排效应[J]. 环境科学与技术, 47(2): 183-194. |
| SONG Q, LI C Q, CHEN J Y, 2024. Spatial network structure of carbon emission and synergistic emission reduction effect in the Yangtze River Delta[J]. Environmental Science and Technology, 47(2): 183-194. | |
| [35] | 孙瑞红, 2013. 基于碳排放清单的九寨沟自然保护区碳足迹及碳管理研究[D]. 上海: 上海师范大学. |
| SUN R H, 2013. Research on carbon footprint and carbon management in Jiuzhaigou Nature Reserve based on carbon emission inventory[D]. Shanghai Normal University. | |
| [36] | 唐睿, 2022. 长三角数字经济和旅游业高质量发展的空间特征分析[J]. 经济体制改革 (5): 51-59. |
| TANG R, 2022. Analysis of spatial characteristics of digital economy and tourism high quality development in Yangtze River Delta[J]. Reform of Economic System (5): 51-59. | |
| [37] | 王凯, 刘美伦, 2025. 新质生产力与旅游业高质量发展耦合协调关系及影响因素[J]. 湖北民族大学学报(哲学社会科学版), 43(1): 125-137. |
| WANG K, LIU M L, 2025. Coupling coordination relationship and influencing factors of new quality productive forces and high quality development of tourism[J]. Journal of Hubei Minzu University (Philosophy and Social Sciences), 43(1): 125-137. | |
| [38] | 王凯, 张淑文, 甘畅, 等, 2019. 我国旅游业碳排放的空间关联性及其影响因素[J]. 环境科学研究, 32(6): 938-947. |
| WANG K, ZHANG S W, GAN C, et al., 2019. Spatial correlation of carbon emissions in tourism industry and its influencing factors in China[J]. Research of Environmental Sciences, 32(6): 938-947. | |
| [39] |
王凯, 张淑文, 甘畅, 等, 2020. 中国旅游业碳排放效率的空间网络结构及其效应研究[J]. 地理科学, 40(3): 344-353.
DOI |
| WANG K, ZHANG S W, GAN C, et al., 2020. Spatial network structure of carbon emission efficiency of tourism industry and its effects in China[J]. Geographical Science, 40(3): 344-353. | |
| [40] | 王松茂, 徐宣国, 马江涛, 等, 2020. 新疆旅游经济网络特征的时空演变研究——基于修正的引力模型及社会网络分析[J]. 干旱区地理, 43(2): 458-465. |
| WANG S M, XU X G, MA J T, et al., 2020. Spatial and temporal evolution of the tourism economy network in Xinjiang: Based on modified gravity model and social network analysis[J]. Arid Land Geography, 43(2): 458-465. | |
| [41] | 王兆峰, 刘庆芳, 2019. 长江经济带旅游生态效率时空演变及其影响因素[J]. 长江流域资源与环境, 28(10): 2289-2298. |
| WANG Z F, LIU Q F, 2019. Spatio-temporal evolution and influencing factors of tourism Eco-efficiency in the Yangtze River Economic Belt[J]. Resources and Environment in the Yangtze River Basin, 28(10): 2289-2298. | |
| [42] | 文艳, 孙根年, 2021. 中国入境旅游贸易效率及其影响因素研究——基于异质性随机前沿引力模型的估计[J]. 旅游学刊, 36(3): 29-43. |
| WEN Y, SUN G N, 2021. Trade efficiency of China’s inbound tourism and influencing factors: Estimating trade efficiency using a heterogeneous stochastic frontier gravity model[J]. Tourism Tribune, 36(3): 29-43. | |
| [43] | 谢园方, 赵媛, 2012. 长三角地区旅游业能源消耗的CO2排放测度研究[J]. 地理研究, 31(3): 429-438. |
| XIE Y F, ZHAO Y, 2012. Measuring carbon dioxide emissions from energy consumption by tourism in Yangtze River Delta[J]. Geography Research, 31(3): 429-438. | |
| [44] | 杨建春, 李开潮, 2024. 新质生产力赋能旅游业高质量发展: 理论逻辑与实践路径[J]. 云南民族大学学报(哲学社会科学版), 41(6): 139-146. |
| YANG J C, LI K C, 2024. New-quality productivity empowering the high-quality development of tourism: Theoretical logic and practical approaches[J]. Journal of Yunnan Minzu University (Philosophy and Social Sciences Edition), 41(6): 139-146. | |
| [45] | 杨子晖, 陈里璇, 陈雨恬, 2020. 经济政策不确定性与系统性金融风险的跨市场传染——基于非线性网络关联的研究[J]. 经济研究, 55(1): 65-81. |
| YANG Z H, CHEN L X, CHEN Y T, 2020. Cross-market contagion of economic policy uncertainty and systemic financial risk: A nonlinear network connectedness analysis[J]. Economic Research Journal, 55(1): 65-81. | |
| [46] |
张明斗, 翁爱华, 2022. 长江经济带城市水资源利用效率的空间关联网络及形成机制[J]. 地理学报, 77(9): 2353-2373.
DOI |
|
ZHANG M D, WENG A H, 2022. Spatial correlation network and its formation mechanism of urban water utilization efficiency in the Yangtze River Economic Belt[J]. Acta Geographica Sinica, 77(9): 2353-2373.
DOI |
|
| [47] | 赵先超, 滕洁, 谭书佳, 2018. 基于投入产出法的湖南省旅游业碳排放测算及GRA关联度分析[J]. 世界地理研究, 27(3): 164-174. |
| ZHAO X C, TENG J, TAN S J, 2018. Estimation of tourism carbon emissions and correlation analysis of GRA in Hunan province based on inputoutput method[J]. World Regional Studies, 27(3): 164-174. | |
| [48] | 钟永德, 石晟屹, 李世宏, 等, 2014. 中国旅游业碳排放计量框架构建与实证研究[J]. 中国人口·资源与环境, 24(1): 78-86. |
| ZHONG Y D, SHI S Y, LI S H, et al., 2014. Empirical research on construction of measurement framework for tourism carbon emission in China[J]. China Population Resources and Environment, 24(1): 78-86. | |
| [49] | 朱嘉豪, 许章华, 李诗涵, 等, 2023. 福州都市圈能源消费碳排放空间网络结构演化及其影响因素研究[J]. 地理与地理信息科学, 39(6): 75-83. |
| ZHU J H, XU Z H, LI S H, et al., 2023. Evolution of spatial network structure of carbon emissions from energy consumption and its influencing factors in the Fuzhou metropolitan area[J]. Geography and Geo-Information Science, 39(6): 75-83. |
| No related articles found! |
| Viewed | ||||||
|
Full text |
|
|||||
|
Abstract |
|
|||||
Copyright © 2021 Editorial Office of ACTA PETROLEI SINICA
Address:No. 6 Liupukang Street, Xicheng District, Beijing, P.R.China, 510650
Tel: 86-010-62067128, 86-010-62067137, 86-010-62067139
Fax: 86-10-62067130
Email: syxb@cnpc.com.cn
Support byBeijing Magtech Co.ltd, E-mail:support@magtech.com.cn