生态环境学报 ›› 2022, Vol. 31 ›› Issue (5): 969-978.DOI: 10.16258/j.cnki.1674-5906.2022.05.012
李春环1,2,3,4( ), 王攀4, 余海龙4, 李冰5, 黄菊莹1,2,3,*()
收稿日期:2021-12-15
出版日期:2022-05-18
发布日期:2022-07-12
通讯作者:
* 黄菊莹(1980年生),女,研究员,主要从事荒漠/荒漠草原应对环境变化研究。E-mail: juyinghuang@163.com作者简介:李春环(1998年生),男,硕士研究生,从事大气酸沉降及其生态效应研究。E-mail: lichunhuan318@163.com
基金资助:
LI Chunhuan1,2,3,4(), WANG Pan4, YU Hailong4, LI Bing5, HUANG Juying1,2,3,*()
Received:2021-12-15
Online:2022-05-18
Published:2022-07-12
摘要:
在全国酸沉降速率趋于平稳而西北地区持续增加的背景下,明晰西北典型区域盐基离子沉降特征有助于合理评价区域酸沉降风险。以宁东能源化工基地3个燃煤电厂为采样点,研究了电厂周围降水降尘混合沉降中盐基离子沉降特征及来源,分析了盐基离子沉降量与混合沉降酸性质和土壤性质的关系。结果表明,4种盐基离子季沉降量的变化范围均较大,Ca2+为主要的沉降形式;夏季盐基离子沉降量较高,气团主要来源为东南方向。春季和秋季沉降量较低,气团主要来源分别为西北和东南方向;混合沉降输入酸度低于其平均pH,且Ca2+中和因子最大。K+季沉降量与土壤K质量分数、Ca2+季沉降量与土壤Ca2+质量分数呈正相关(P<0.05),但4种盐基离子季沉降量均与土壤pH无显著相关性(P>0.05)。该研究区降水降尘中盐基离子沉降量与中国西北地区平均值相当,但低于东部和南部等区域;盐基离子中和了降水降尘输入酸度,其中Ca2+占主导作用。K+和Ca2+沉降促进了土壤K+和Ca2+积累,可能是酸沉降下研究区土壤盐基营养的重要来源。中重度碱性土壤环境下,盐基离子沉降较难改变研究区土壤pH。研究结果为科学评估荒漠煤矿区酸沉降风险提供了数据支撑。
中图分类号:
李春环, 王攀, 余海龙, 李冰, 黄菊莹. 西北荒漠煤矿区降水降尘中盐基离子沉降特征及其效应研究[J]. 生态环境学报, 2022, 31(5): 969-978.
LI Chunhuan, WANG Pan, YU Hailong, LI Bing, HUANG Juying. Bulk Deposition of Base Cation in the Rainfall and Dustfall and Its Effects in A Northwest Desert Coal-mining Region[J]. Ecology and Environment, 2022, 31(5): 969-978.
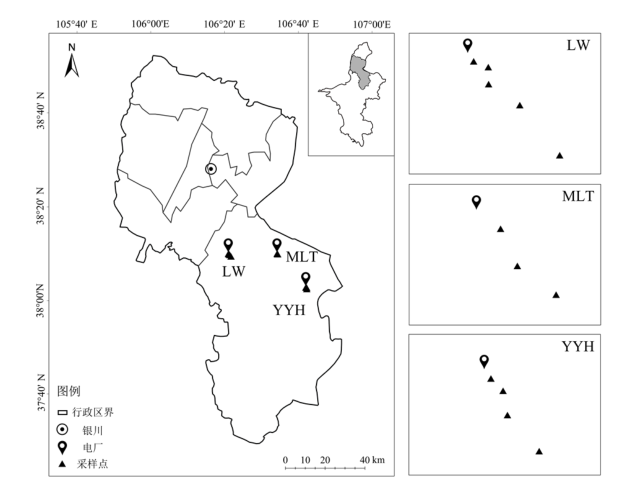
图1 研究区采样点位置图 MLT、YYH和LW分别代表马莲台电厂、鸳鸯湖电厂和灵武电厂
Figure 1 Location of the sampling points in the studied area MLT, YYH, and LW represent Maliantai power plant, Yuanyanghu power plant, and Lingwu power plant, respectively
| 土壤指标 Soil index | 参数 Parameter | 马莲台电厂 Maliantai power plant | 鸳鸯湖电厂 Yuanyanghu power plant | 灵武电厂 Lingwu power plant |
|---|---|---|---|---|
| K+ | 变化范围/(mg∙kg-1) | 1.77-7.06 | 1.73-16.34 | 2.03-32.49 |
| 平均值/(mg∙kg-1) | 3.75 | 6.98 | 11.63 | |
| 变异系数/% | 43.94 | 63.01 | 75.16 | |
| Ca2+ | 变化范围/(g∙kg-1) | 0.88-13.84 | 0.46-2.72 | 0.40-5.94 |
| 平均值/(g∙kg-1) | 4.32 | 0.94 | 2.36 | |
| 变异系数/% | 102.62 | 61.47 | 89.91 | |
| Na+ | 变化范围/(g∙kg-1) | 0.22-9.41 | 0.01-0.94 | 2.43-12.03 |
| 平均值/(g∙kg-1) | 2.50 | 0.22 | 7.83 | |
| 变异系数/% | 123.21 | 140.00 | 38.31 | |
| Mg2+ | 变化范围/(g∙kg-1) | 2.20-9.82 | 0.55-4.03 | 2.20-51.06 |
| 平均值/(g∙kg-1) | 5.84 | 2.06 | 25.48 | |
| 变异系数/% | 51.23 | 49.68 | 131.21 | |
| pH | 变化范围 | 8.55-9.15 | 8.94-9.28 | 8.14-9.94 |
| 平均值 | 8.93 | 9.13 | 8.74 | |
| 变异系数/% | 2.24 | 1.17 | 5.67 | |
| 电导率 Electrical conductivity | 变化范围/ (μS∙cm-1) | 104.70-2380.00 | 51.60-123.80 | 540.00-3890.00 |
| 平均值/(μS∙cm-1) | 477.94 | 76.16 | 2286.80 | |
| 变异系数/% | 155.80 | 31.00 | 89.31 |
表1 研究区土壤性质的变化
Table 1 Variations of soil properties in the studied area
| 土壤指标 Soil index | 参数 Parameter | 马莲台电厂 Maliantai power plant | 鸳鸯湖电厂 Yuanyanghu power plant | 灵武电厂 Lingwu power plant |
|---|---|---|---|---|
| K+ | 变化范围/(mg∙kg-1) | 1.77-7.06 | 1.73-16.34 | 2.03-32.49 |
| 平均值/(mg∙kg-1) | 3.75 | 6.98 | 11.63 | |
| 变异系数/% | 43.94 | 63.01 | 75.16 | |
| Ca2+ | 变化范围/(g∙kg-1) | 0.88-13.84 | 0.46-2.72 | 0.40-5.94 |
| 平均值/(g∙kg-1) | 4.32 | 0.94 | 2.36 | |
| 变异系数/% | 102.62 | 61.47 | 89.91 | |
| Na+ | 变化范围/(g∙kg-1) | 0.22-9.41 | 0.01-0.94 | 2.43-12.03 |
| 平均值/(g∙kg-1) | 2.50 | 0.22 | 7.83 | |
| 变异系数/% | 123.21 | 140.00 | 38.31 | |
| Mg2+ | 变化范围/(g∙kg-1) | 2.20-9.82 | 0.55-4.03 | 2.20-51.06 |
| 平均值/(g∙kg-1) | 5.84 | 2.06 | 25.48 | |
| 变异系数/% | 51.23 | 49.68 | 131.21 | |
| pH | 变化范围 | 8.55-9.15 | 8.94-9.28 | 8.14-9.94 |
| 平均值 | 8.93 | 9.13 | 8.74 | |
| 变异系数/% | 2.24 | 1.17 | 5.67 | |
| 电导率 Electrical conductivity | 变化范围/ (μS∙cm-1) | 104.70-2380.00 | 51.60-123.80 | 540.00-3890.00 |
| 平均值/(μS∙cm-1) | 477.94 | 76.16 | 2286.80 | |
| 变异系数/% | 155.80 | 31.00 | 89.31 |
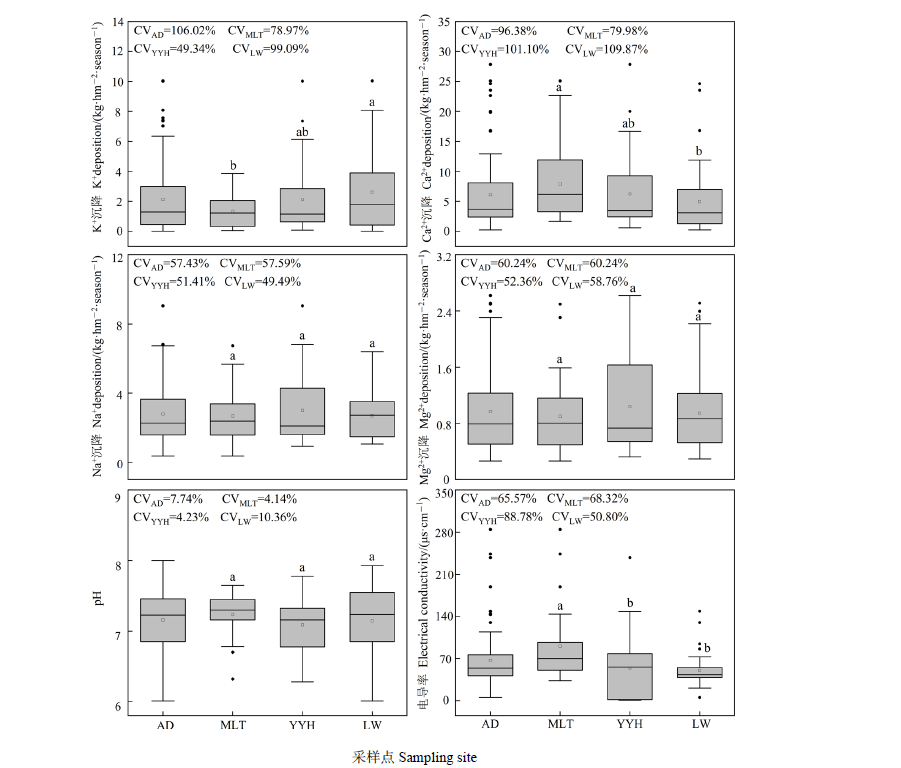
图2 研究区混合沉降中盐基离子季沉降量、pH和电导率的变化 AD代表3个电厂的所有数据。MLT、YYH和LW分别代表马莲台电厂(n=27)、鸳鸯湖电厂(n=36)和灵武电厂(n=45)。不同小写字母代表3个电厂间各指标的差异显著(P<0.05)
Figure 2 Variations of seasonal deposition of base cation, pH, and electrical conductivity in bulk deposition in the studied area AD represents all data of the three power plants. MLT, YYH, and LW represent Maliantai power plant (n=27), Yuanyanghu power plant (n=36), and Lingwu power plant (n=45), respectively. Different lowercase letters indicate significant differences of each index among the three power plants (P<0.05).
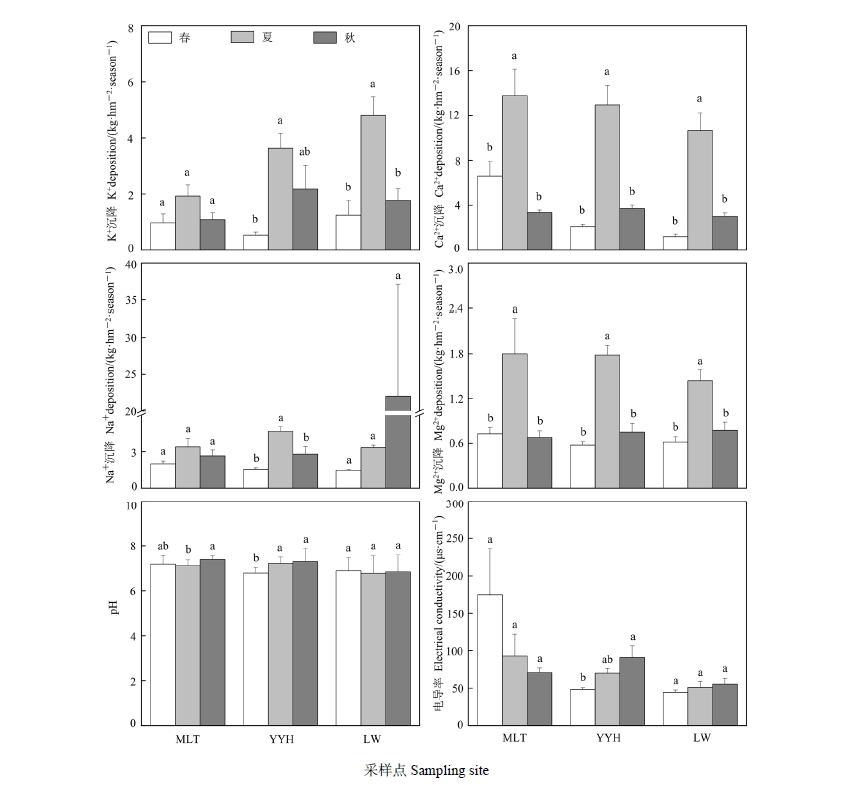
图3 研究区混合沉降中盐基离子季沉降量、pH和电导率的季节差异 MLT、YYH和LW分别代表马莲台电厂(n=9)、鸳鸯湖电厂(n=12)和灵武电厂(n=15)。不同小写字母代表同一电厂各指标在不同季节间差异显著(P<0.05)
Figure 3 Differences of seasonal deposition of base cation, pH, and electrical conductivity in the bulk deposition among the three seasons in the studied area MLT, YYH, and LW represent Maliantai power plant (n=9), Yuanyanghu power plant (n=12), and Lingwu power plant (n=15), respectively. Different lowercase letters indicate significant differences of each index among different seasons in the same power plant (P<0.05)
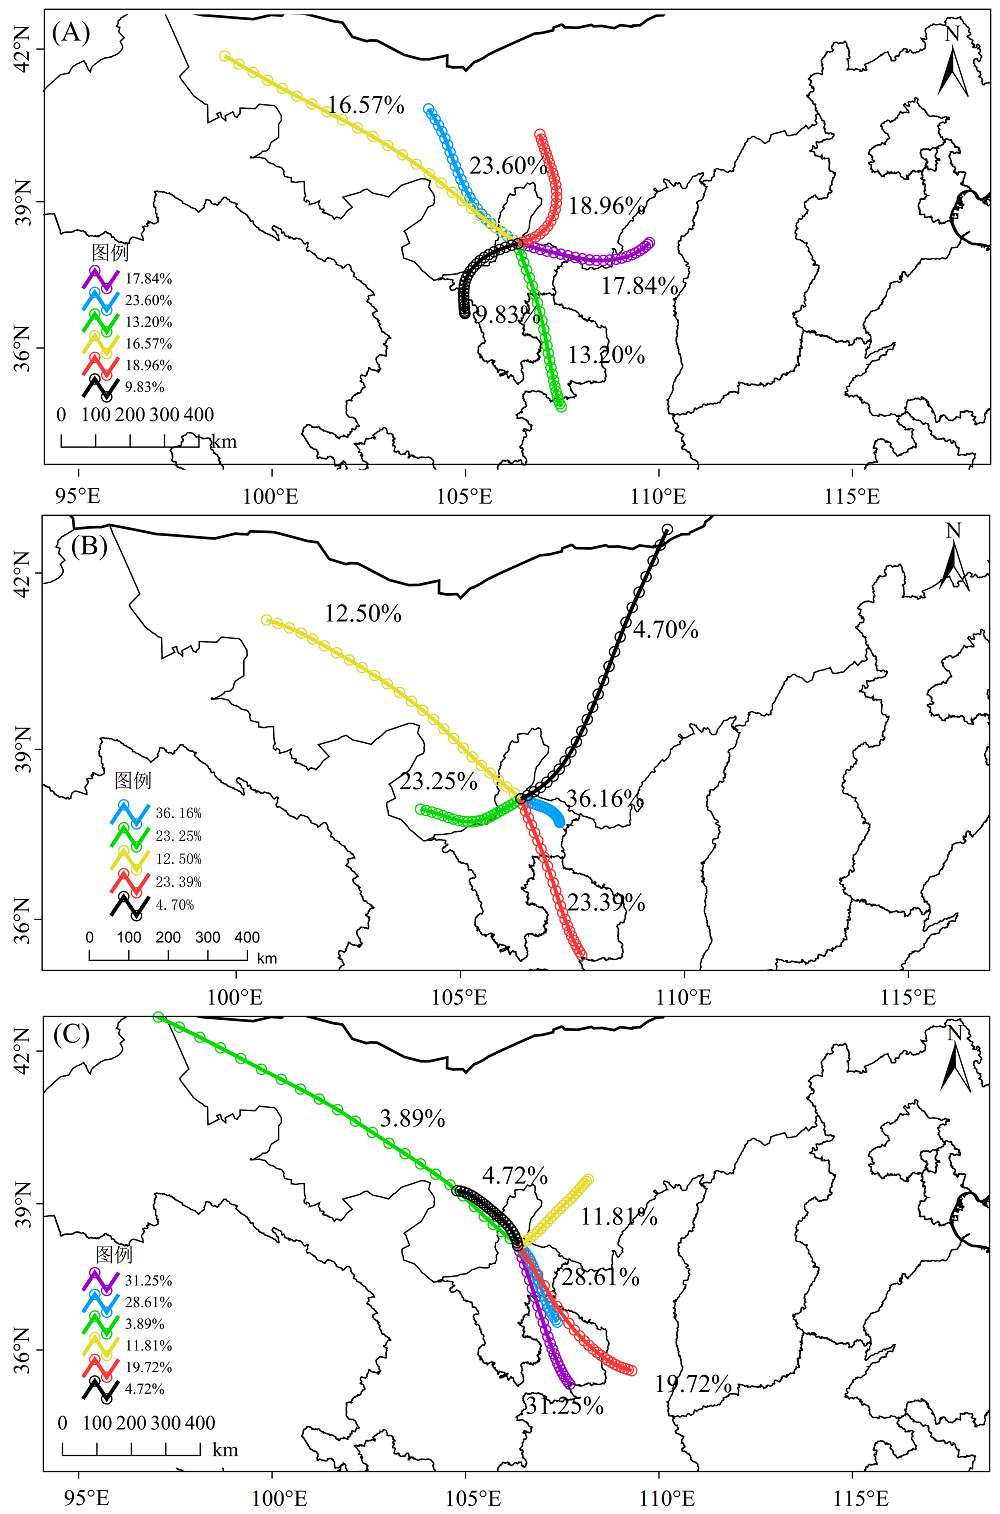
图4 研究区春(A)、夏(B)、秋季(C)气团后向轨迹聚类结果
Figure 4 Clustering results of backward trajectories of air masses in spring (A), summer (B), and autumn (C) in the studied area
| 混合沉降指标 Bulk deposition index | 研究区 The studied area | 马莲台电厂 Maliantai power plant | 鸳鸯湖电厂 Yuanyanghu power plant | 灵武电厂 Lingwu power plant |
|---|---|---|---|---|
| 平均pH Mean pH | 5.93 | 5.42 | 6.42 | 5.84 |
| 输入酸度 Input acidity (APi)/ (mol∙L-1) | 5.28 | 5.26 | 5.33 | 5.26 |
| K+中和因子 Neutralization factor of K+/(eq∙L-1) | 0.34 | 0.22 | 0.38 | 0.43 |
| Ca2+中和因子 Neutralization factor of Ca2+/(eq∙L-1) | 2.12 | 2.51 | 2.21 | 1.63 |
| Na+中和因子 Neutralization factor of Na+/(eq∙L-1) | 1.69 | 1.56 | 1.93 | 1.58 |
| Mg2+中和因子 Neutralization factor of Mg2+/(eq∙L-1) | 0.56 | 0.57 | 0.61 | 0.51 |
表2 研究区混合沉降输入酸度和中和因子
Table 2 Input acidity and neutralization factors of bulk deposition in the studied area
| 混合沉降指标 Bulk deposition index | 研究区 The studied area | 马莲台电厂 Maliantai power plant | 鸳鸯湖电厂 Yuanyanghu power plant | 灵武电厂 Lingwu power plant |
|---|---|---|---|---|
| 平均pH Mean pH | 5.93 | 5.42 | 6.42 | 5.84 |
| 输入酸度 Input acidity (APi)/ (mol∙L-1) | 5.28 | 5.26 | 5.33 | 5.26 |
| K+中和因子 Neutralization factor of K+/(eq∙L-1) | 0.34 | 0.22 | 0.38 | 0.43 |
| Ca2+中和因子 Neutralization factor of Ca2+/(eq∙L-1) | 2.12 | 2.51 | 2.21 | 1.63 |
| Na+中和因子 Neutralization factor of Na+/(eq∙L-1) | 1.69 | 1.56 | 1.93 | 1.58 |
| Mg2+中和因子 Neutralization factor of Mg2+/(eq∙L-1) | 0.56 | 0.57 | 0.61 | 0.51 |
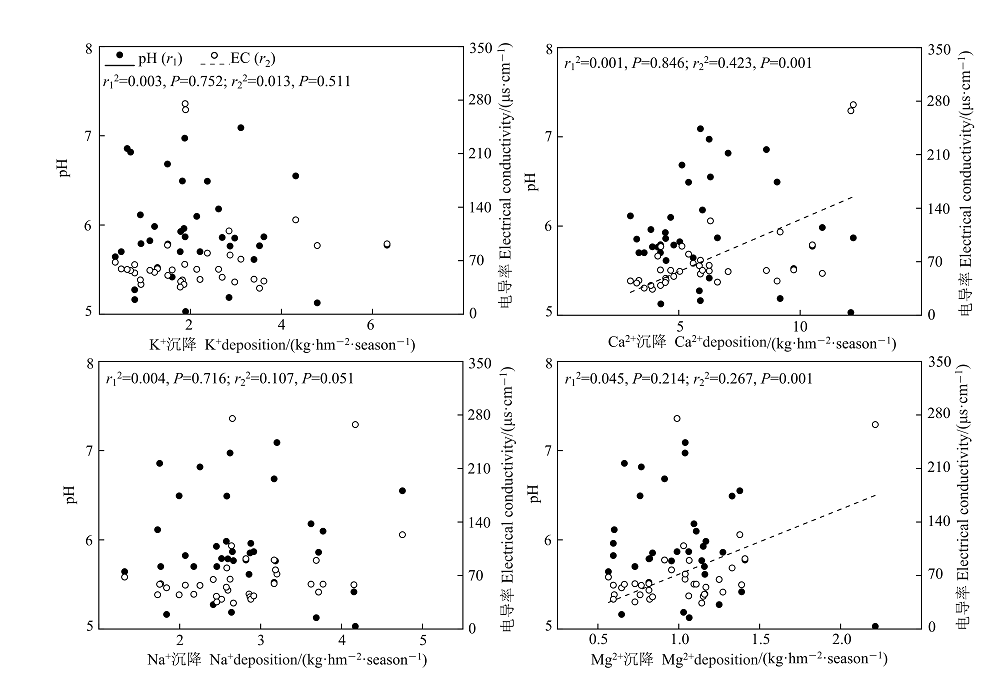
图5 研究区混合沉降中盐基离子季沉降量与pH和电导率(EC)的关系
Figure 5 Relationships of seasonal deposition of base cation with pH and electrical conductivity (EC) in bulk deposition in the studied area
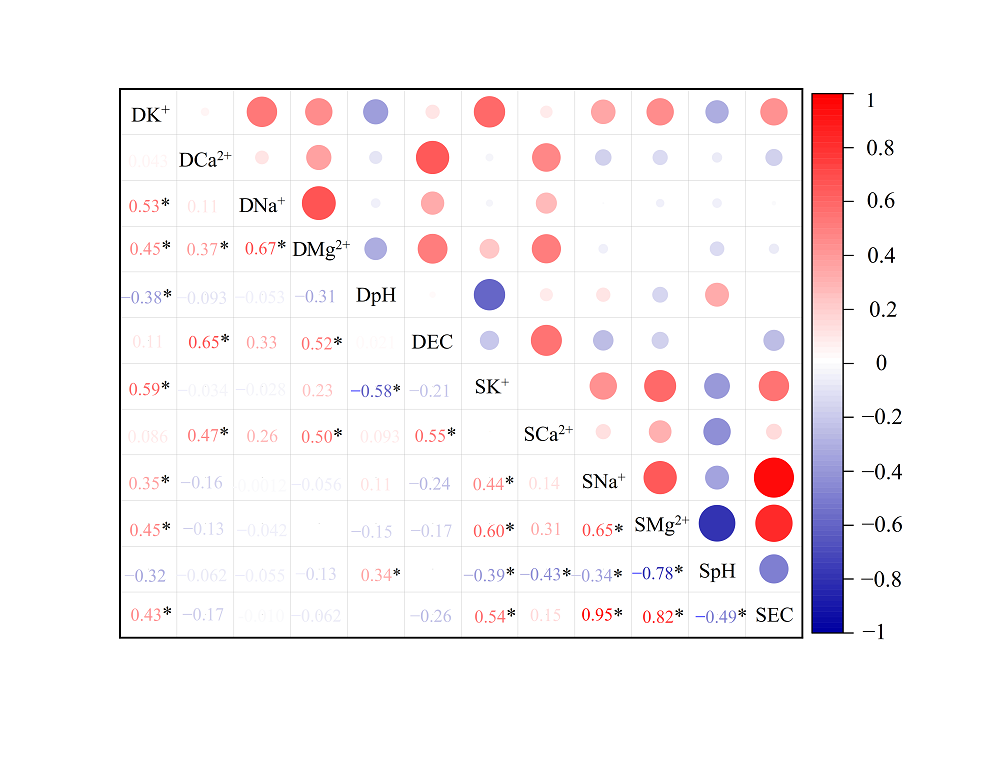
图6 研究区混合沉降性质与土壤性质的相关性 DK+、DCa2+、DNa+、DMg2+、DpH和DEC分别代表混合沉降K+季沉降量、Ca2+季沉降量、Na+季沉降量、Mg2+季沉降量、pH和电导率。SK+、SCa2+、SNa+、SMg2+、SpH、SEC分别代表土壤K+质量分数、Ca2+质量分数、Na+质量分数、Mg2+质量分数、pH和电导率。红圈和蓝圈分别代表正相关和负相关。*代表P<0.05
Figure 6 Correlations between bulk deposition properties and soil properties in the studied area DK+, DCa2+, DNa+, DMg2+, DpH, and DEC represent K+ deposition, Ca2+ deposition, Na+ deposition, Mg2+ deposition, pH, electrical conductivity of bulk deposition, respectively. SK+, SCa2+, SNa+, SMg2+, SpH, and SEC represent soil K+ mass fraction, Ca2+ mass fraction, Na+ mass fraction, Mg2+ mass fraction, pH, and electrical conductivity, respectively. red and blue circles represent positive and negative correlations, respectively. * represents P<0.05
| [1] | DANA M T, EASTER R C, 1987. Statistical summary and analyses of event precipitation chemistry from the MAP3S network, 1976-1983 [J]. Atmospheric Environment, 21(1): 113-128. |
| [2] |
DU E Z, DE VRIES W, MCNULTY S, et al., 2018. Bulk deposition of base cationic nutrients in China's forests: Annual rates and spatial characteristics[J]. Atmospheric Environment, 184: 121-128.
DOI URL |
| [3] | ERIK B, 1988. Time-trends of sulfate and nitrate in precipitation in Norway (1972-1982)[J]. Atmospheric Environment, 22(2): 333-338. |
| [4] |
HYNICKA J D, PETT-RIDGE J C, PERAKIS S S, 2016. Nitrogen enrichment regulates calcium sources in forests[J]. Global Change Biology, 22(12): 4067-4079.
DOI URL |
| [5] | KANG L T, HUANG J P, CHEN S Y, et al., 2016. Long-term trends of dust events over Tibetan Plateau during 1961-2010[J]. Atmospheric Environment, 125(Part A): 188-198. |
| [6] |
LARSSEN T, DUAN L, MULDER J, 2011. Deposition and leaching of sulfur, nitrogen and calcium in four forested catchments in China: Implications for acidification[J]. Environmental Science & Technology, 45(4): 1192-1198.
DOI URL |
| [7] |
LEE D S, PACYNA J M, 1999. An industrial emissions inventory of calcium for Europe[J]. Atmospheric Environment, 33(11): 1687-1697.
DOI URL |
| [8] | LEI Y, ZHANG Q, HE K B, et al., 2011. Primary anthropogenic aerosol emission trends for China, 1990-2005 [J]. Atmospheric Chemistry and Physics, 220(11): 931-954. |
| [9] | LI R, CUI L L, ZHAO Y L, et al., 2019. The wet deposition of the inorganic ions in the 320 cities across China: spatiotemporal variation, source apportionment, and dominant factors[J]. Atmospheric Chemistry and Physics, 1: 1-80. |
| [10] |
POSSANZINI M, BUTTINI P, PALO V D, 1988. Characterization of a rural area in terms of dry and wet deposition[J]. Science of The Total Environment, 74: 111-120.
DOI URL |
| [11] | SHEN Y J, ZHANG X D, BROOK JR, et al., 2016. Satellite remote sensing of air quality in the Energy Golden Triangle, northwest China[J]. Environmental Science & Technology Letters, 3(7): 275-279. |
| [12] |
VET R S, ARTZ S, CAROUM, et al., 2014. A global assessment of precipitation chemistry and deposition of sulfur, nitrogen, sea salt, base cations, organic acids, acidity and pH, and phosphorus[J]. Atmospheric Environment, DOI: 10.1016/j.atmosenv.2013.11.013.
DOI |
| [13] | WANG Y S, YU W P, PAN Y P, et al., 2012. Acid neutralization of precipitation in northern China[J]. Journal of the Air & Waste Management Association, 62(2): 204-211. |
| [14] |
WANG Y Q, ZHANG X Y, DRAXLER R R, 2009. TrajStat: GIS-based software that uses various trajectory statistical analysis methods to identify potential sources from long-term air pollution measurement data[J]. Environmental Modelling and Software, 24(8): 938-939.
DOI URL |
| [15] |
WANG Z F, AKIMOTO H, UNO I, 2002. Neutralization of soil aerosol and its impact on the distribution of acid rain over east Asia: Observations and model results[J]. Journal of Geophysical Research-Atmospheres, DOI: 10.1029/2001JD001040.
DOI |
| [16] |
YU Z P, CHEN H Y, SEARLE E B, et al., 2020. Whole soil acidification and base cation reduction across subtropical China[J]. Geoderma, DOI: 10.1016/j.geoderma.2019.114107.
DOI |
| [17] |
ZHANG Q Y, WANG Q F, ZHU J X, et al., 2020. Spatiotemporal variability, source apportionment, and acid-neutralizing capacity of atmospheric wet base-cation deposition in China[J]. Environmental Pollution, DOI: 10.1016/j.envpol.2020.114335.
DOI |
| [18] |
ZHANG X Y, WANG L, WANG W H, et al., 2015. Long-term trend and spatiotemporal variations of haze over China by satellite observations from 1979 to 2013[J]. Atmospheric Environment, 119: 362-373.
DOI URL |
| [19] |
ZHANG X H, LU Y, WANG Q G, et al., 2019. A high-resolution inventory of air pollutant emissions from crop residue burning in China[J]. Atmospheric Environment, 213: 207-214.
DOI URL |
| [20] | ZHANG X Y, WANG Y Q, NIU T, et al., 2012. Atmospheric aerosol compositions in China: spatial/temporal variability, chemical signature, regional haze distribution and comparisons with global aerosols[J]. Chemical Physics, 12(2): 779-799. |
| [21] |
ZHAO W X, ZHAO Y, MA M R, et al., 2021. Long-term variability in base cation, sulfur and nitrogen deposition and critical load exceedance of terrestrial ecosystems in China[J]. Environmental Pollution, DOI: 10.1016/j.envpol.2021.117974.
DOI |
| [22] |
ZHU Q C, VRIES W D, LIU X J, et al., 2016. The contribution of atmospheric deposition and forest harvesting to forest soil acidification in China since 1980[J]. Atmospheric Environment, 146(3): 215-222.
DOI URL |
| [23] | 安俊岭, 黄美元, 2000. 盐基离子沉降量变化的不确定性对酸沉降临界负荷的影响[J]. 环境科学学报, 20(增刊): 8-11. |
| AN J L, HUANG M Y, 2000. Impacts of uncertainties of changes in atmospheric base-cations deposition on assessment of critical loads of soils for acidic deposition[J]. Acta Scientiae Circumstantiae, 20(Suppl): 8-11. | |
| [24] | 鲍士旦, 2000. 土壤农化分析[M]. 北京: 中国农业出版社. |
| BAO S D, 2000. Soil and Agricultural Chemistry Analysis[M]. Beijing: China Agriculture Press. | |
| [25] | 伯鑫, 田飞, 唐伟, 等, 2019. 重点煤电基地大气污染物扩散对京津冀的影响[J]. 中国环境科学, 39(2): 514-522. |
| BO X, TIAN F, TANG W, et al., 2019. Influence of air pollutants transport from key coal and electricity production bases on Beijing-Tianjin-Hebei region[J]. China Environmental Science, 39(2): 514-522. | |
| [26] | 陈思宇, 黄建平, 李景鑫, 等, 2017. 塔克拉玛干沙漠和戈壁沙尘起沙、传输和沉降的对比研究[J]. 中国科学: 地球科学, 47(8): 939-957. |
| CHEN S Y, HUANG J P, LI J X, et al., 2017. Comparison of dust emissions, transport, and deposition between the Taklimakan Desert and Gobi Desert from 2007 to 2011[J]. Science China Earth Sciences, 47(8): 939-957. | |
| [27] | 国家环境保护总局, 国家技术监督局, 1994. 环境空气降尘标准: GB/T 15265—1994 [S]. 北京: 中国标准出版社: 1-4. |
| State Environmental Protection Bureau, State Bureau of Quality and Technical Supervision, 1994. Ambient Air Dust Reduction Standard: GB/T 15265—1994 [S]. Beijing: China Standard Press: 1-4. | |
| [28] | 国家环境保护总局, 2004. 酸沉降监测技术规范: HJ/T 165—2004 [S]. 北京: 中国环境科学出版社: 1-26. |
| State Environmental Protection Bureau, 2004. Technical Specifications for Acid Deposition Monitoring:HJ/T 165—2004 [S]. Beijing: China Environmental Science Press: 1-26. | |
| [29] | 贾润语, 2019. 施加盐基离子对土壤中Cd生物有效性及水稻Cd累积的影响[D]. 长沙: 中南林业科技大学. |
| JIA R Y, 2019. Application of base cations to regulate Cd absorption and accumulation in rice[D]. Changsha: Central South University of Forestry and Technology. | |
| [30] | 贾文雄, 李宗省, 2016. 祁连山东段降水的水化学特征及离子来源研究[J]. 环境科学, 37(9): 3322-3332. |
| JIA W X, LI Z X, 2016. Hydrochemical characteristics and sources of ions in precipitation at the east Qilian mountains[J]. Environmental Science, 37(9): 3322-3332. | |
| [31] | 姜勇, 李天鹏, 冯雪, 等, 2019. 外源硫输入对草地土壤-植物系统养分有效性的影响[J]. 生态学杂志, 38(4): 1192-1201. |
| JIANG Y, LI T P, FENG X, et al., 2019. Effects of exogenous sulfur input on nutrient availability in soil-plant system of grassland[J]. Chinese Journal of Ecology, 38(4): 1192-1201. | |
| [32] | 姜勇, 张玉革, 梁文举, 2005. 温室蔬菜栽培对土壤交换性盐基离子组成的影响[J]. 水土保持学报, 19(6): 80-83. |
| JIANG Y, ZHANG Y G, LIANG W J, 2005. Influence of greenhouse vegetable cultivation on composition of oil exchangeable base cations[J]. Journal of Soil and Water Conservation, 19(6): 80-83. | |
| [33] | 李志雄, 梁美生, 姜俊杰, 2017. 火电厂周围大气环境中硫化物分布规律的探讨[J]. 环境工程学报, 11(2): 998-1002. |
| LI Z X, LIANG M S, JIANG J J, 2017. Investigation of distribution rule of sulfide located in ambient thermal power plant[J]. Chinese Journal of Environmental Engineering, 11(2): 998-1002. | |
| [34] | 梁晓雪, 2019. 我国能源金三角宁东煤化工基地大气细颗粒物的污染特征及来源解析[D]. 兰州: 兰州大学. |
| LIANG X X, 2019. Contamination characteristics and source apportionment of fine particles in Ningdong coal chemical industrial base of the Energy Golden Triangle[D]. Lanzhou: Lanzhou University. | |
| [35] | 廖柏寒, 蒋青, 2001. 我国酸雨中盐基离子的重要性[J]. 农业环境保护, 24(3): 254-256. |
| LIAO B H, JIANG Q, 2001. Importance of base cations of acid precipitation in China[J]. Agro-Environmental Protection, 24(3): 254-256. | |
| [36] | 罗成科, 张佳瑜, 肖国举, 等, 2018. 宁东基地不同燃煤电厂周边土壤5种重金属元素污染特征及生态风险[J]. 生态环境学报, 27(7): 1285-1291. |
| LUO C K, ZHANG J Y, XIAO G J, et al., 2018. Pollution characteristics and ecological assessment of heavy metals in soil around different coal-fired power plants of Ningdong Base[J]. Ecology and Environmental Sciences, 27(7): 1285-1291. | |
| [37] | 牟世芬, 刘克纳, 2000. 离子色谱方法及应用[M]. 北京: 化学工业出版社. |
| MOU S F, LIU K N, 2000. Ion Chromatography Method and Application[M]. Beijing: Chemical Industry Press. | |
| [38] | 宁夏农业勘查设计院, 1990. 宁夏土壤[M]. 银川: 宁夏人民出版社. |
| Agricultural Survey and Design Institute of Ningxia, 1990. Soil of Ningxia[M]. Yinchuan: Ningxia People's Publishing House. | |
| [39] | 唐喜斌, 2014. 秸秆燃烧对灰霾天气的影响分析及其排放因子与颗粒物成分谱[D]. 上海: 华东理工大学. |
| TANG X B, 2014. Biomass burning impacts on the haze weather and its emission factors and PM chemical composition[D]. Shanghai: East China University of Science and Technology. | |
| [40] | 佟海, 2016. 火电厂周围土壤和水体硫化物分布规律与其排放硫的相关性探讨[D]. 太原: 太原理工大学. |
| TONG H, 2016. Investigation of the sulfides distribution charcteristics in soil and water around the thermal power plant and its relationship to sulphur emissions[D]. Taiyuan: Taiyuan University of Technology. | |
| [41] | 汪少勇, 何晓波, 吴锦奎, 等, 2019. 长江源区大气降水化学特征及离子来源[J]. 环境科学, 40(10): 4431-4439. |
| WANG S Y, HE X B, WU J K, et al., 2019. Chemical characteristics and ionic sources of precipitation in the source region of the Yangtze River[J]. Environmental Science, 40(10): 4431-4439. | |
| [42] | 王金相, 2018. 西北地区典型能源工业基地排放对局地环境空气质量的影响[D]. 兰州: 兰州大学. |
| WANG J X, 2018. Impact of emission from typical energy industry base on local air quality in northwest China[D]. Lanzhou: Lanzhou University. | |
| [43] | 王攀, 朱湾湾, 樊瑾, 等, 2020. 宁夏燃煤电厂周围降水降尘中硫氮沉降特征研究[J]. 生态环境学报, 29(6): 1189-1197. |
| WANG P, ZHU W W, FAN J, et al., 2020. Sulfur and nitrogen deposition near three coal-fired power plants in Ningxia[J]. Ecology and Environmental Sciences, 29(6): 1189-1197. | |
| [44] | 吴玉凤, 高霄鹏, 桂东伟, 等, 2019. 大气氮沉降监测方法研究进展[J]. 应用生态学报, 30(10): 3605-3614. |
| WU Y F, GAO X P, GUI D W, et al., 2019. Research progress on the monitoring methods of atmospheric nitrogen deposition[J]. Chinese Journal of Applied Ecology, 30(10): 3605-3614. | |
| [45] | 邢建伟, 宋金明, 袁华茂, 等, 2017. 胶州湾夏秋季大气湿沉降中的营养盐及其入海的生态效应[J]. 生态学报, 37(14): 4817-4830. |
| XING J W, SONG J M, YUAN H M, et al., 2017. Nutrients in atmospheric wet deposition and their ecological effects on Jiaozhou Bay in summer and autumn 2015[J]. Acta Ecologica Sinica, 37(14): 4817-4830. | |
| [46] | 薛文博, 许艳玲, 王金南, 等, 2016. 全国火电行业大气污染物排放对空气质量的影响[J]. 中国环境科学, 36(5): 1281-1288. |
| XUE W B, XU Y L, WANG J N, et al., 2016. Ambient air quality impact of emissions from thermal power industry[J]. China Environmental Science, 36(5): 1281-1288. | |
| [47] | 赵廷宁, 张玉秀, 曹兵, 等, 2018. 西北干旱荒漠区煤炭基地生态安全保障技术[J]. 水土保持学报, 32(1): 1-5. |
| ZHAO Y N, ZHANG Y X, CAO B, et al., 2018. Eco-security technology for coal mining bases in the northwestern arid desert regions in China[J]. Journal of Soil and Water Conservation, 32(1): 1-5. | |
| [48] | 朱剑兴, 王秋凤, 于海丽, 等, 2019. 2013 年中国典型生态系统大气氮、磷、酸沉降数据集[J]. 中国科学数据, 4(1): 82-89. |
| ZHU J X, WANG Q F, YU H L, et al., 2019. Atmospheric nitrogen, phosphorus, and acid deposition in Chinese terrestrial ecosystems (2013)[J]. China Scientific Data, 4(1): 82-89. |
| [1] | 茹淑华, 赵欧亚, 侯利敏, 肖广敏, 王策, 孙世友, 张国印, 王凌, 刘蕾. 8种钝化剂产品对不同镉污染土壤理化性质和镉有效性的影响[J]. 生态环境学报, 2021, 30(10): 2085-2092. |
| 阅读次数 | ||||||
|
全文 |
|
|||||
|
摘要 |
|
|||||