生态环境学报 ›› 2024, Vol. 33 ›› Issue (11): 1737-1747.DOI: 10.16258/j.cnki.1674-5906.2024.11.008
文妮1,2,3( ), 王重洋2,3,*(), 陈星达3, 陈水森3, 周霞3, 于国荣1,*()
收稿日期:2024-05-22
出版日期:2024-11-18
发布日期:2024-12-06
通讯作者:
于国荣。E-mail: YUGuo_rong6314@163.com作者简介:文妮(1999年生),女(彝族),硕士研究生,研究方向为水环境遥感。E-mail: wenn6201@gmail.com
基金资助:
WEN Ni1,2,3(), WANG Chongyang2,3,*(), CHEN Xingda3, CHEN Shuisen3, ZHOU Xia3, YU Guorong1,*()
Received:2024-05-22
Online:2024-11-18
Published:2024-12-06
摘要:
高效监测河网水系氨氮(NH3-N)的时空分布对区域水体污染防控治理和生态环境健康发展具有重要意义。基于2019年在广州市收集的204个NH3-N实测数据(0.026-6.210 mg·L-1)和8景高质量Sentinel-2 MSI遥感影像,发展了适用于大范围水域、NH3-N质量浓度差异显著的机器学习遥感反演模型。结果显示,已有的NH3-N反演模型应用于广州市水体时精度受限,但多特征输入的模型预测能力相对较好。在检索16000多种Sentinel-2波段组合的基础上,利用主成分分析方法进行了特征降维(BC-FDR),并结合极端梯度提升(XGBoost)、随机森林(RF)、支持向量回归(SVR)3种机器学习模型,构建了波段特征优化的机器学习NH3-N反演方法。其中BC-FDR_XGBoost模型表现最佳(rc2=0.6872,σRMSEc=0.617 mg·L-1,σMAEc=0.385 mg·L-1,n=102;rv2=0.5436,σRMSEv=0.438 mg·L-1,σMAEv=0.362 mg·L-1,n=44)。另外基于58个实测数据进行了独立验证(n=33)和趋势检验(n=25),结果进一步表明,BC-FDR_XGBoost模型的精度较高(r2=0.5315,σRMSE=0.459 mg·L-1,σMAE=0.287 mg·L-1),卫星遥感反演结果与实测数据在时空分布和变化趋势上具有良好的一致性。2019年,广州市河网水系NH3-N质量浓度平均为Ⅲ类水质等级,枯水期(0.795 mg·L-1)显著高于丰水期(0.552 mg·L-1)。空间上,丰水期NH3-N质量浓度整体呈南北部低、中部相对较高的特点;枯水期仅南沙区及部分干流NH3-N相对较低。该研究为建立城市尺度大区域范围水体NH3-N遥感反演模型提供了参考,有助于区域水环境的评价和治理。
中图分类号:
文妮, 王重洋, 陈星达, 陈水森, 周霞, 于国荣. 基于机器学习模型的沿海城市河网水系氨氮质量浓度高分辨率遥感估算[J]. 生态环境学报, 2024, 33(11): 1737-1747.
WEN Ni, WANG Chongyang, CHEN Xingda, CHEN Shuisen, ZHOU Xia, YU Guorong. High-Resolution Remote Sensing Estimation of Ammonia Nitrogen Concentrations in Coastal Urban River Networks Based on Machine Learning Models[J]. Ecology and Environment, 2024, 33(11): 1737-1747.
| 数据源及参考 | 波段 | 模型 | r2 | 样本数 | ρ/(mg·L-1) | 区域 |
|---|---|---|---|---|---|---|
| Sentinel-2 (Dong et al., | B3/B2 | y=0.296x2-0.224x-0.352 | 0.8510 | 70 | 0.004-0.355 | 丹江口水库 |
| Sentinel-2 (Cao et al., | B4/(B5-B12) | y=0.0585×e-0.8332x | 0.7390 | 22 | 0.060-3.390 | 支脉河 |
| Sentinel-2 (Tian et al., | B2, B3, B4, B5, B6, B7, B8, B8A | XGBoost | 0.8200 | 96 | 0.030-0.810 | 清林径水库 |
| Sentinel-2 (郭荣幸等, | B8 | y=30.545x2-13.034x+1.525 | 0.6135 | 18 | 0.110-0.350 | 小浪底水库 |
| Sentinel-2 (Shi et al., | B7/B1 | y=-2.633x3+9.269x2-10.16x+3.64 | 0.8024 | 120 | 0.025-0.400 | 淮河流域 |
| Sentinel-2 (刘轩等, | B3/B2 | BPNN | 0.8770 | 70 | 0.001-0.067 | 丹江口水库 |
| Sentinel-2 (Kuan et al., | B2, B3, B4, B5, B8 | BPNN | 0.7400 | 41 | 0.100-0.980 | 淮河流域 |
| UAV (Chen et al., | (B3+B4)/B2, (B2+B3+B4)/B2, (B3+B4)/(B1+B2), (B2+B3+B4)/(B3+B4) | GA_XGBoost | 0.6940 | 87 | 0.165-1.620 | 南淝河 |
| UAV; GF-1C (Chen et al., | B3/(B1+B4), B4/B3, (B2+B3+B4)/ (B1+B4), (B1+B2+B4)/(B2+B3), (B1+B2+B4)/ (B2+B3), (B2+B3)/B1+B2+B4), (B2+B3)/(B1+B4) | self-optimizing machine learning method | 0.7790 | 77 | 0.433-1.396 | 南淝河 |
| SPOT-5 (Wang et al., | B1, B2, B3, B4 | GA-SVR | 0.9824 | 13 | 0.150-0.500 | 渭河 |
| Landsat 8 (Zhang et al., | B1, B2, B3, B4, B5, B8, B9, B2/B3, B2/B4, B4/B3, B2/B5, (B3-B4)/(B3+B4), (B5-B4)/(B5+B4), (B5-B6)/(B5+B6), (B6-B7)/(B6+B7), (B3-B6)/(B3+B6) | ConvLSTM | 0.8800 | 138 | 0.010-0.380 | 东平湖 |
| Landsat 8 (Li et al., | B1, B2, B3, B4, B5, B7 | ANN | 0.4400 | 67 | 0.030-1.210 | 南渡河 |
| Landsat 8 (Song et al., | B1-B5, B4-B5, B6/B7, B3-B5, (B6-B7)/(B6+B7), B2-B5, (B3-B5)/(B3+B5), B5+B6 | RF | 0.7084 | 40 | 0.220-0.550 | 呼伦湖 |
表1 已有的NH3-N反演模型
Table 1 NH3-N inversion models in previous studies
| 数据源及参考 | 波段 | 模型 | r2 | 样本数 | ρ/(mg·L-1) | 区域 |
|---|---|---|---|---|---|---|
| Sentinel-2 (Dong et al., | B3/B2 | y=0.296x2-0.224x-0.352 | 0.8510 | 70 | 0.004-0.355 | 丹江口水库 |
| Sentinel-2 (Cao et al., | B4/(B5-B12) | y=0.0585×e-0.8332x | 0.7390 | 22 | 0.060-3.390 | 支脉河 |
| Sentinel-2 (Tian et al., | B2, B3, B4, B5, B6, B7, B8, B8A | XGBoost | 0.8200 | 96 | 0.030-0.810 | 清林径水库 |
| Sentinel-2 (郭荣幸等, | B8 | y=30.545x2-13.034x+1.525 | 0.6135 | 18 | 0.110-0.350 | 小浪底水库 |
| Sentinel-2 (Shi et al., | B7/B1 | y=-2.633x3+9.269x2-10.16x+3.64 | 0.8024 | 120 | 0.025-0.400 | 淮河流域 |
| Sentinel-2 (刘轩等, | B3/B2 | BPNN | 0.8770 | 70 | 0.001-0.067 | 丹江口水库 |
| Sentinel-2 (Kuan et al., | B2, B3, B4, B5, B8 | BPNN | 0.7400 | 41 | 0.100-0.980 | 淮河流域 |
| UAV (Chen et al., | (B3+B4)/B2, (B2+B3+B4)/B2, (B3+B4)/(B1+B2), (B2+B3+B4)/(B3+B4) | GA_XGBoost | 0.6940 | 87 | 0.165-1.620 | 南淝河 |
| UAV; GF-1C (Chen et al., | B3/(B1+B4), B4/B3, (B2+B3+B4)/ (B1+B4), (B1+B2+B4)/(B2+B3), (B1+B2+B4)/ (B2+B3), (B2+B3)/B1+B2+B4), (B2+B3)/(B1+B4) | self-optimizing machine learning method | 0.7790 | 77 | 0.433-1.396 | 南淝河 |
| SPOT-5 (Wang et al., | B1, B2, B3, B4 | GA-SVR | 0.9824 | 13 | 0.150-0.500 | 渭河 |
| Landsat 8 (Zhang et al., | B1, B2, B3, B4, B5, B8, B9, B2/B3, B2/B4, B4/B3, B2/B5, (B3-B4)/(B3+B4), (B5-B4)/(B5+B4), (B5-B6)/(B5+B6), (B6-B7)/(B6+B7), (B3-B6)/(B3+B6) | ConvLSTM | 0.8800 | 138 | 0.010-0.380 | 东平湖 |
| Landsat 8 (Li et al., | B1, B2, B3, B4, B5, B7 | ANN | 0.4400 | 67 | 0.030-1.210 | 南渡河 |
| Landsat 8 (Song et al., | B1-B5, B4-B5, B6/B7, B3-B5, (B6-B7)/(B6+B7), B2-B5, (B3-B5)/(B3+B5), B5+B6 | RF | 0.7084 | 40 | 0.220-0.550 | 呼伦湖 |
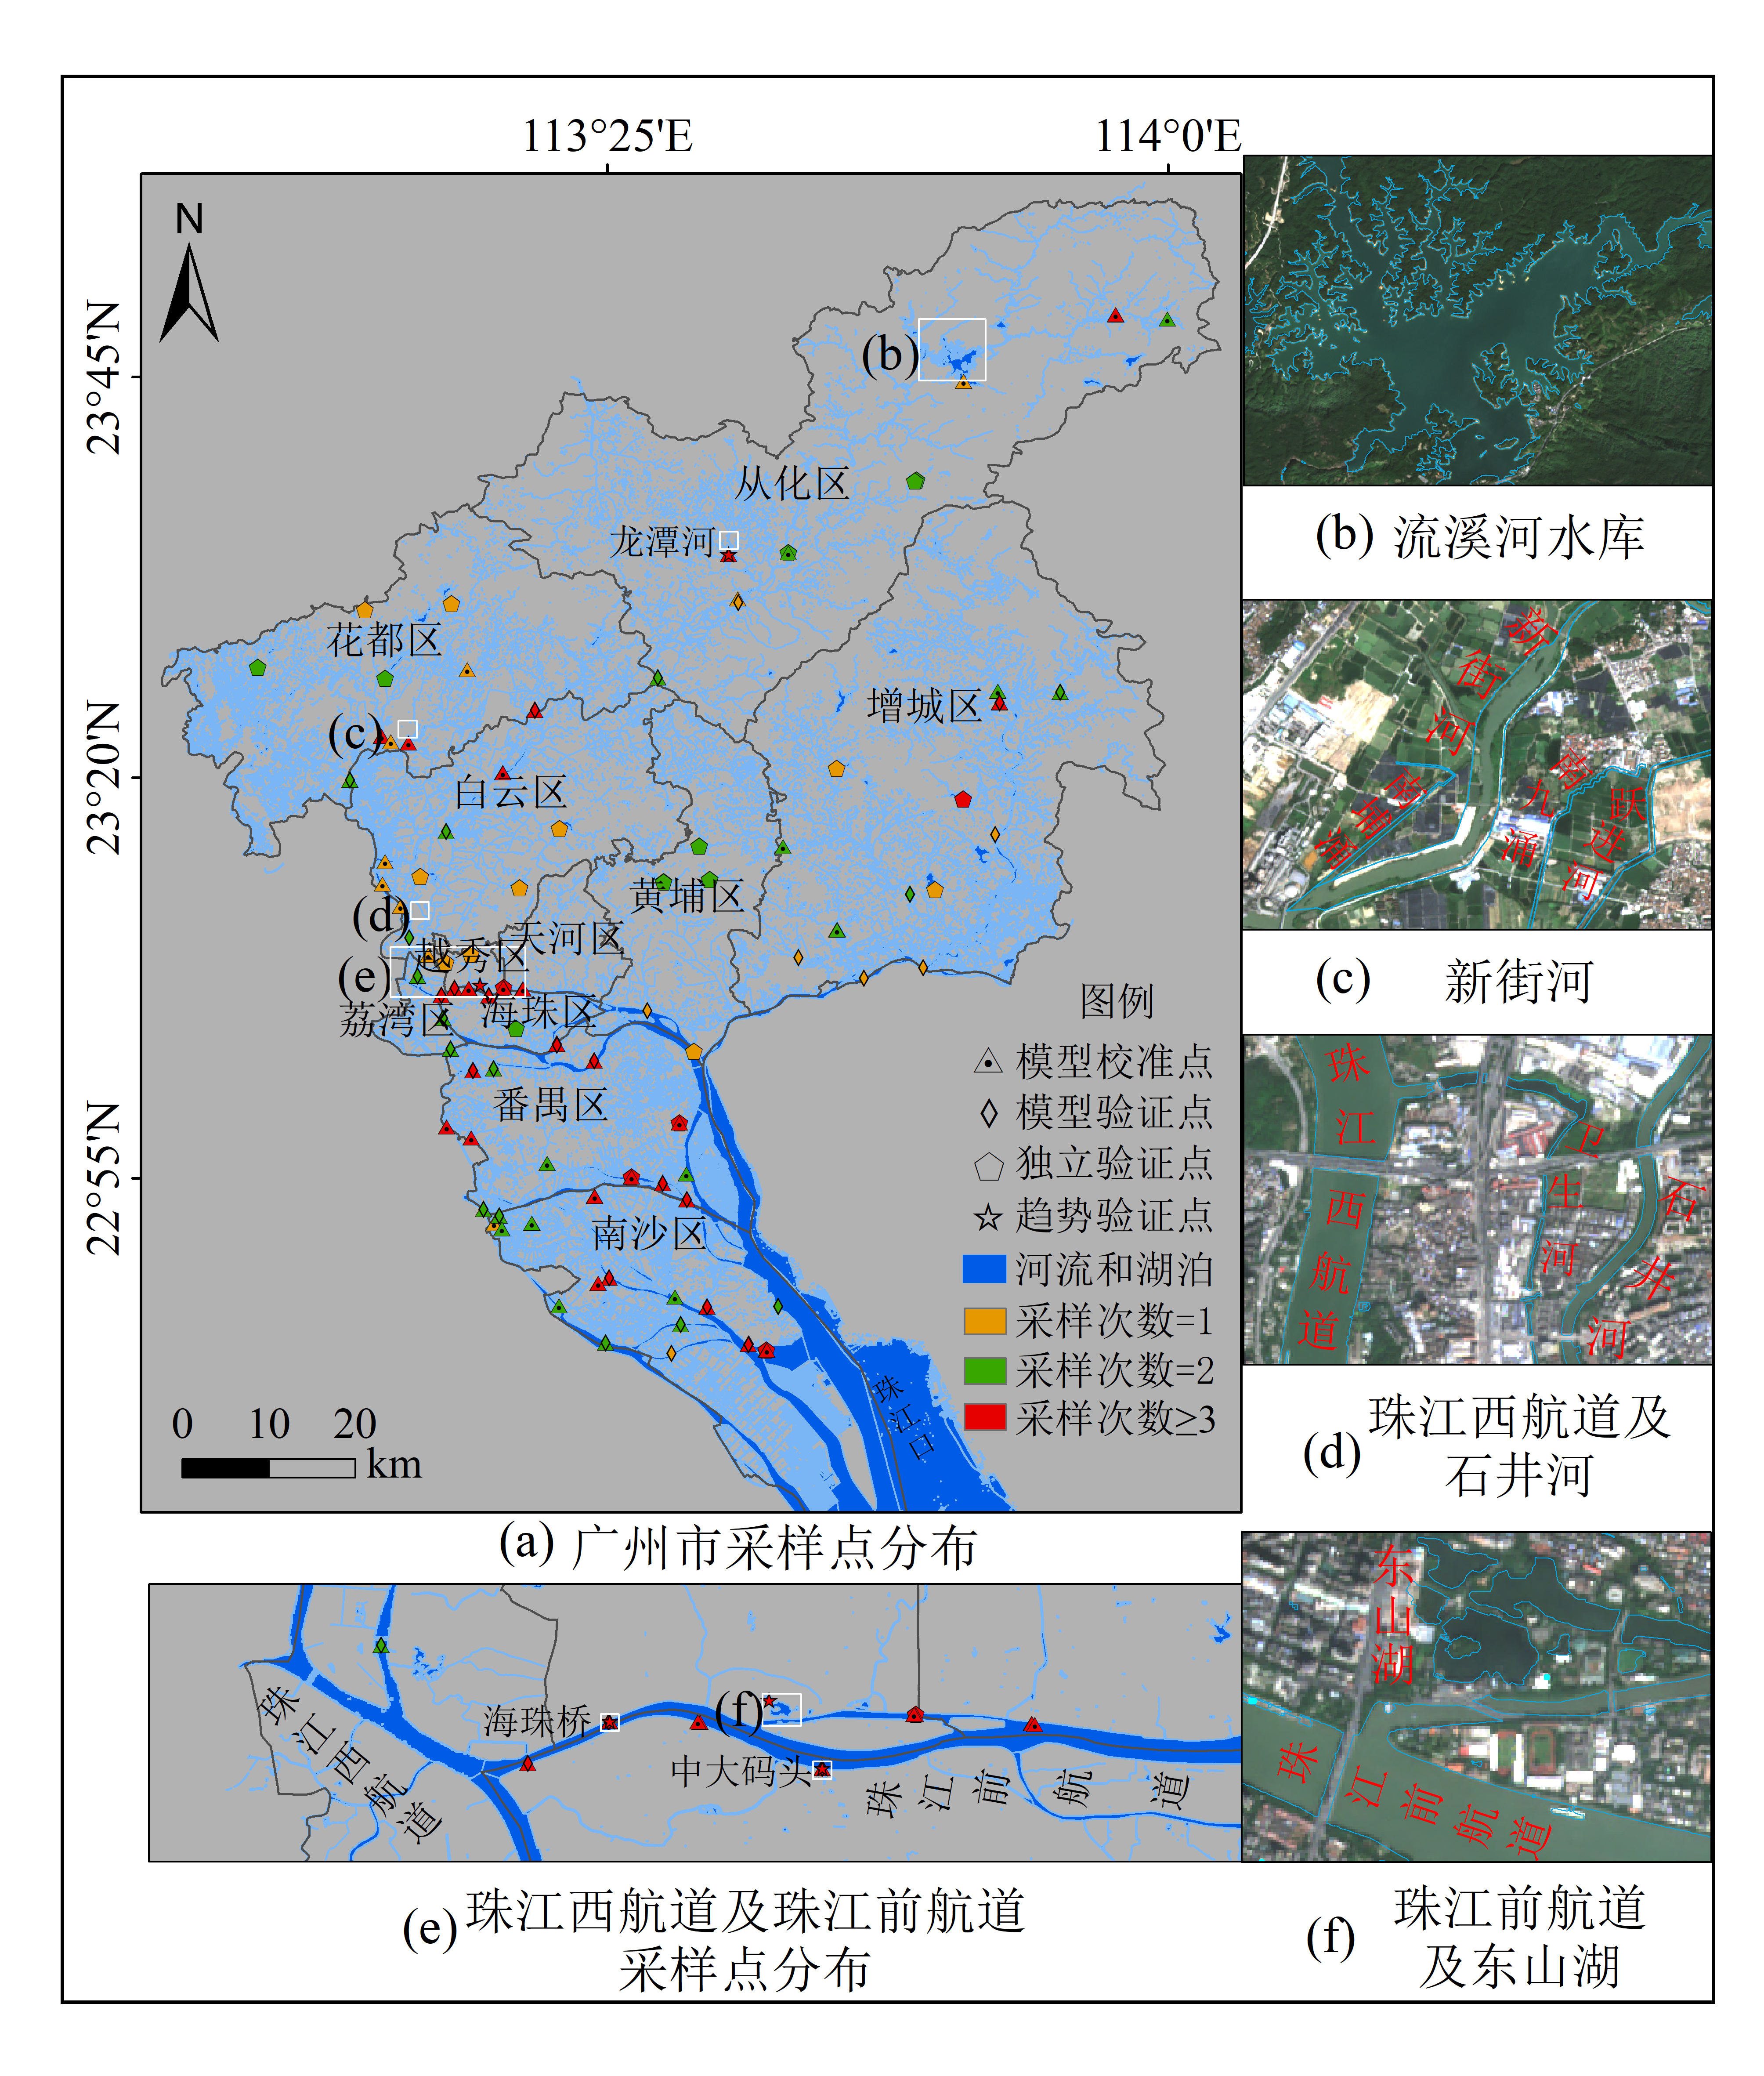
图1 研究区及采样点分布图
Figure 1 Study area and in situ data
| 样本类型 | Sentinel-2 影像日期 | 采样时间 | 样本数 | NH3-N质量浓度/(mg·L-1) | 变异系数 | |||
|---|---|---|---|---|---|---|---|---|
| 最大值 | 最小值 | 平均值 | 标准差 | |||||
| 模型校准 | 3月11日 8月8日 11月6日 11月11日 12月6日 12月11日 | 3月11‒12日 8月7‒9日 11月5‒7日 11月11‒12日 12月5‒6日 12月10日 | 102 | 6.210 | 0.034 | 0.881 | 1.104 | 1.253 |
| 模型验证 | 44 | 2.560 | 0.026 | 0.645 | 0.648 | 1.004 | ||
| 独立验证 | 33 | 3.730 | 0.081 | 0.629 | 0.670 | 1.065 | ||
| 趋势检验 | 8月8日 9月22日 10月17日 11月6日 11月11日 12月6日 | 8月13‒14日 9月6‒10日 10月14‒17日 11月8‒13日 12月10日 | 25 | 2.86 | 0.137 | 1.135 | 0.650 | 0.573 |
| 总计 | 8景 | 204 | 6.210 | 0.026 | 0.821 | 0.922 | 1.124 | |
表2 2019年NH3-N实测数据与Sentinel影像信息
Table 2 NH3-N in-situ data and Sentinel imageries in 2019
| 样本类型 | Sentinel-2 影像日期 | 采样时间 | 样本数 | NH3-N质量浓度/(mg·L-1) | 变异系数 | |||
|---|---|---|---|---|---|---|---|---|
| 最大值 | 最小值 | 平均值 | 标准差 | |||||
| 模型校准 | 3月11日 8月8日 11月6日 11月11日 12月6日 12月11日 | 3月11‒12日 8月7‒9日 11月5‒7日 11月11‒12日 12月5‒6日 12月10日 | 102 | 6.210 | 0.034 | 0.881 | 1.104 | 1.253 |
| 模型验证 | 44 | 2.560 | 0.026 | 0.645 | 0.648 | 1.004 | ||
| 独立验证 | 33 | 3.730 | 0.081 | 0.629 | 0.670 | 1.065 | ||
| 趋势检验 | 8月8日 9月22日 10月17日 11月6日 11月11日 12月6日 | 8月13‒14日 9月6‒10日 10月14‒17日 11月8‒13日 12月10日 | 25 | 2.86 | 0.137 | 1.135 | 0.650 | 0.573 |
| 总计 | 8景 | 204 | 6.210 | 0.026 | 0.821 | 0.922 | 1.124 | |
| 名称 | 波长/nm | 空间分辨率/ m | 描述 | |
|---|---|---|---|---|
| S2A | S2B | |||
| B1 | 443.9 | 442.3 | 60 | 气溶胶 |
| B2 | 496.6 | 492.1 | 10 | 蓝色 |
| B3 | 560 | 559 | 10 | 绿色 |
| B4 | 664.5 | 665 | 10 | 红色 |
| B5 | 703.9 | 703.8 | 20 | 红边1 |
| B6 | 740.2 | 739.1 | 20 | 红边2 |
| B7 | 728.5 | 779.7 | 20 | 红边3 |
| B8 | 835.1 | 833 | 10 | 近红外 |
| B8A | 864.8 | 864 | 20 | 红边4 |
| B9 | 945 | 943.2 | 60 | 水汽 |
| B10 | 1373.5 | 1376.9 | 60 | 卷云 |
| B11 | 1613.7 | 1610.4 | 20 | 短波红外1 |
| B12 | 2202.4 | 2185.7 | 20 | 短波红外2 |
表3 Sentinel-2波段信息
Table 3 Sentinel-2 bands information
| 名称 | 波长/nm | 空间分辨率/ m | 描述 | |
|---|---|---|---|---|
| S2A | S2B | |||
| B1 | 443.9 | 442.3 | 60 | 气溶胶 |
| B2 | 496.6 | 492.1 | 10 | 蓝色 |
| B3 | 560 | 559 | 10 | 绿色 |
| B4 | 664.5 | 665 | 10 | 红色 |
| B5 | 703.9 | 703.8 | 20 | 红边1 |
| B6 | 740.2 | 739.1 | 20 | 红边2 |
| B7 | 728.5 | 779.7 | 20 | 红边3 |
| B8 | 835.1 | 833 | 10 | 近红外 |
| B8A | 864.8 | 864 | 20 | 红边4 |
| B9 | 945 | 943.2 | 60 | 水汽 |
| B10 | 1373.5 | 1376.9 | 60 | 卷云 |
| B11 | 1613.7 | 1610.4 | 20 | 短波红外1 |
| B12 | 2202.4 | 2185.7 | 20 | 短波红外2 |
| 参照 | 反演模型 | 输入变量 | rc2 | σRMSEc/(mg·L-1) | σMAEc/(mg·L-1) | rv2 | σRMSEv/(mg·L-1) | σMAEv/(mg·L-1) |
|---|---|---|---|---|---|---|---|---|
| Dong et al., | y=0.25x2-0.62x+1.25 | B3/B2 | 0.0003 | 1.104 | 0.799 | -0.1256 | 0.688 | 0.594 |
| 郭荣幸等, | y=27.37x2-8.11x+1.25 | B8 | 0.0164 | 1.095 | 0.775 | -0.1960 | 0.709 | 0.618 |
| Shi et al., | y=0.05x3-0.45x2+0.95x +0.42 | B7/B1 | 0.0235 | 1.091 | 0.783 | -0.1516 | 0.696 | 0.613 |
| Tian et al., | XGBoost | B2‒B8A | 0.4907 | 0.788 | 0.533 | 0.2146 | 0.575 | 0.456 |
| 刘轩等, | BPNN | B3/B2 | 0.0001 | 1.105 | 0.802 | 0.0171 | 0.687 | 0.592 |
| Kuan et al., | BPNN | B2‒B5, B8 | 0.1543 | 1.021 | 0.720 | 0.2473 | 0.584 | 0.491 |
表4 基于已有的NH3-N模型反演结果
Table 4 The results based on the previous NH3-N models
| 参照 | 反演模型 | 输入变量 | rc2 | σRMSEc/(mg·L-1) | σMAEc/(mg·L-1) | rv2 | σRMSEv/(mg·L-1) | σMAEv/(mg·L-1) |
|---|---|---|---|---|---|---|---|---|
| Dong et al., | y=0.25x2-0.62x+1.25 | B3/B2 | 0.0003 | 1.104 | 0.799 | -0.1256 | 0.688 | 0.594 |
| 郭荣幸等, | y=27.37x2-8.11x+1.25 | B8 | 0.0164 | 1.095 | 0.775 | -0.1960 | 0.709 | 0.618 |
| Shi et al., | y=0.05x3-0.45x2+0.95x +0.42 | B7/B1 | 0.0235 | 1.091 | 0.783 | -0.1516 | 0.696 | 0.613 |
| Tian et al., | XGBoost | B2‒B8A | 0.4907 | 0.788 | 0.533 | 0.2146 | 0.575 | 0.456 |
| 刘轩等, | BPNN | B3/B2 | 0.0001 | 1.105 | 0.802 | 0.0171 | 0.687 | 0.592 |
| Kuan et al., | BPNN | B2‒B5, B8 | 0.1543 | 1.021 | 0.720 | 0.2473 | 0.584 | 0.491 |
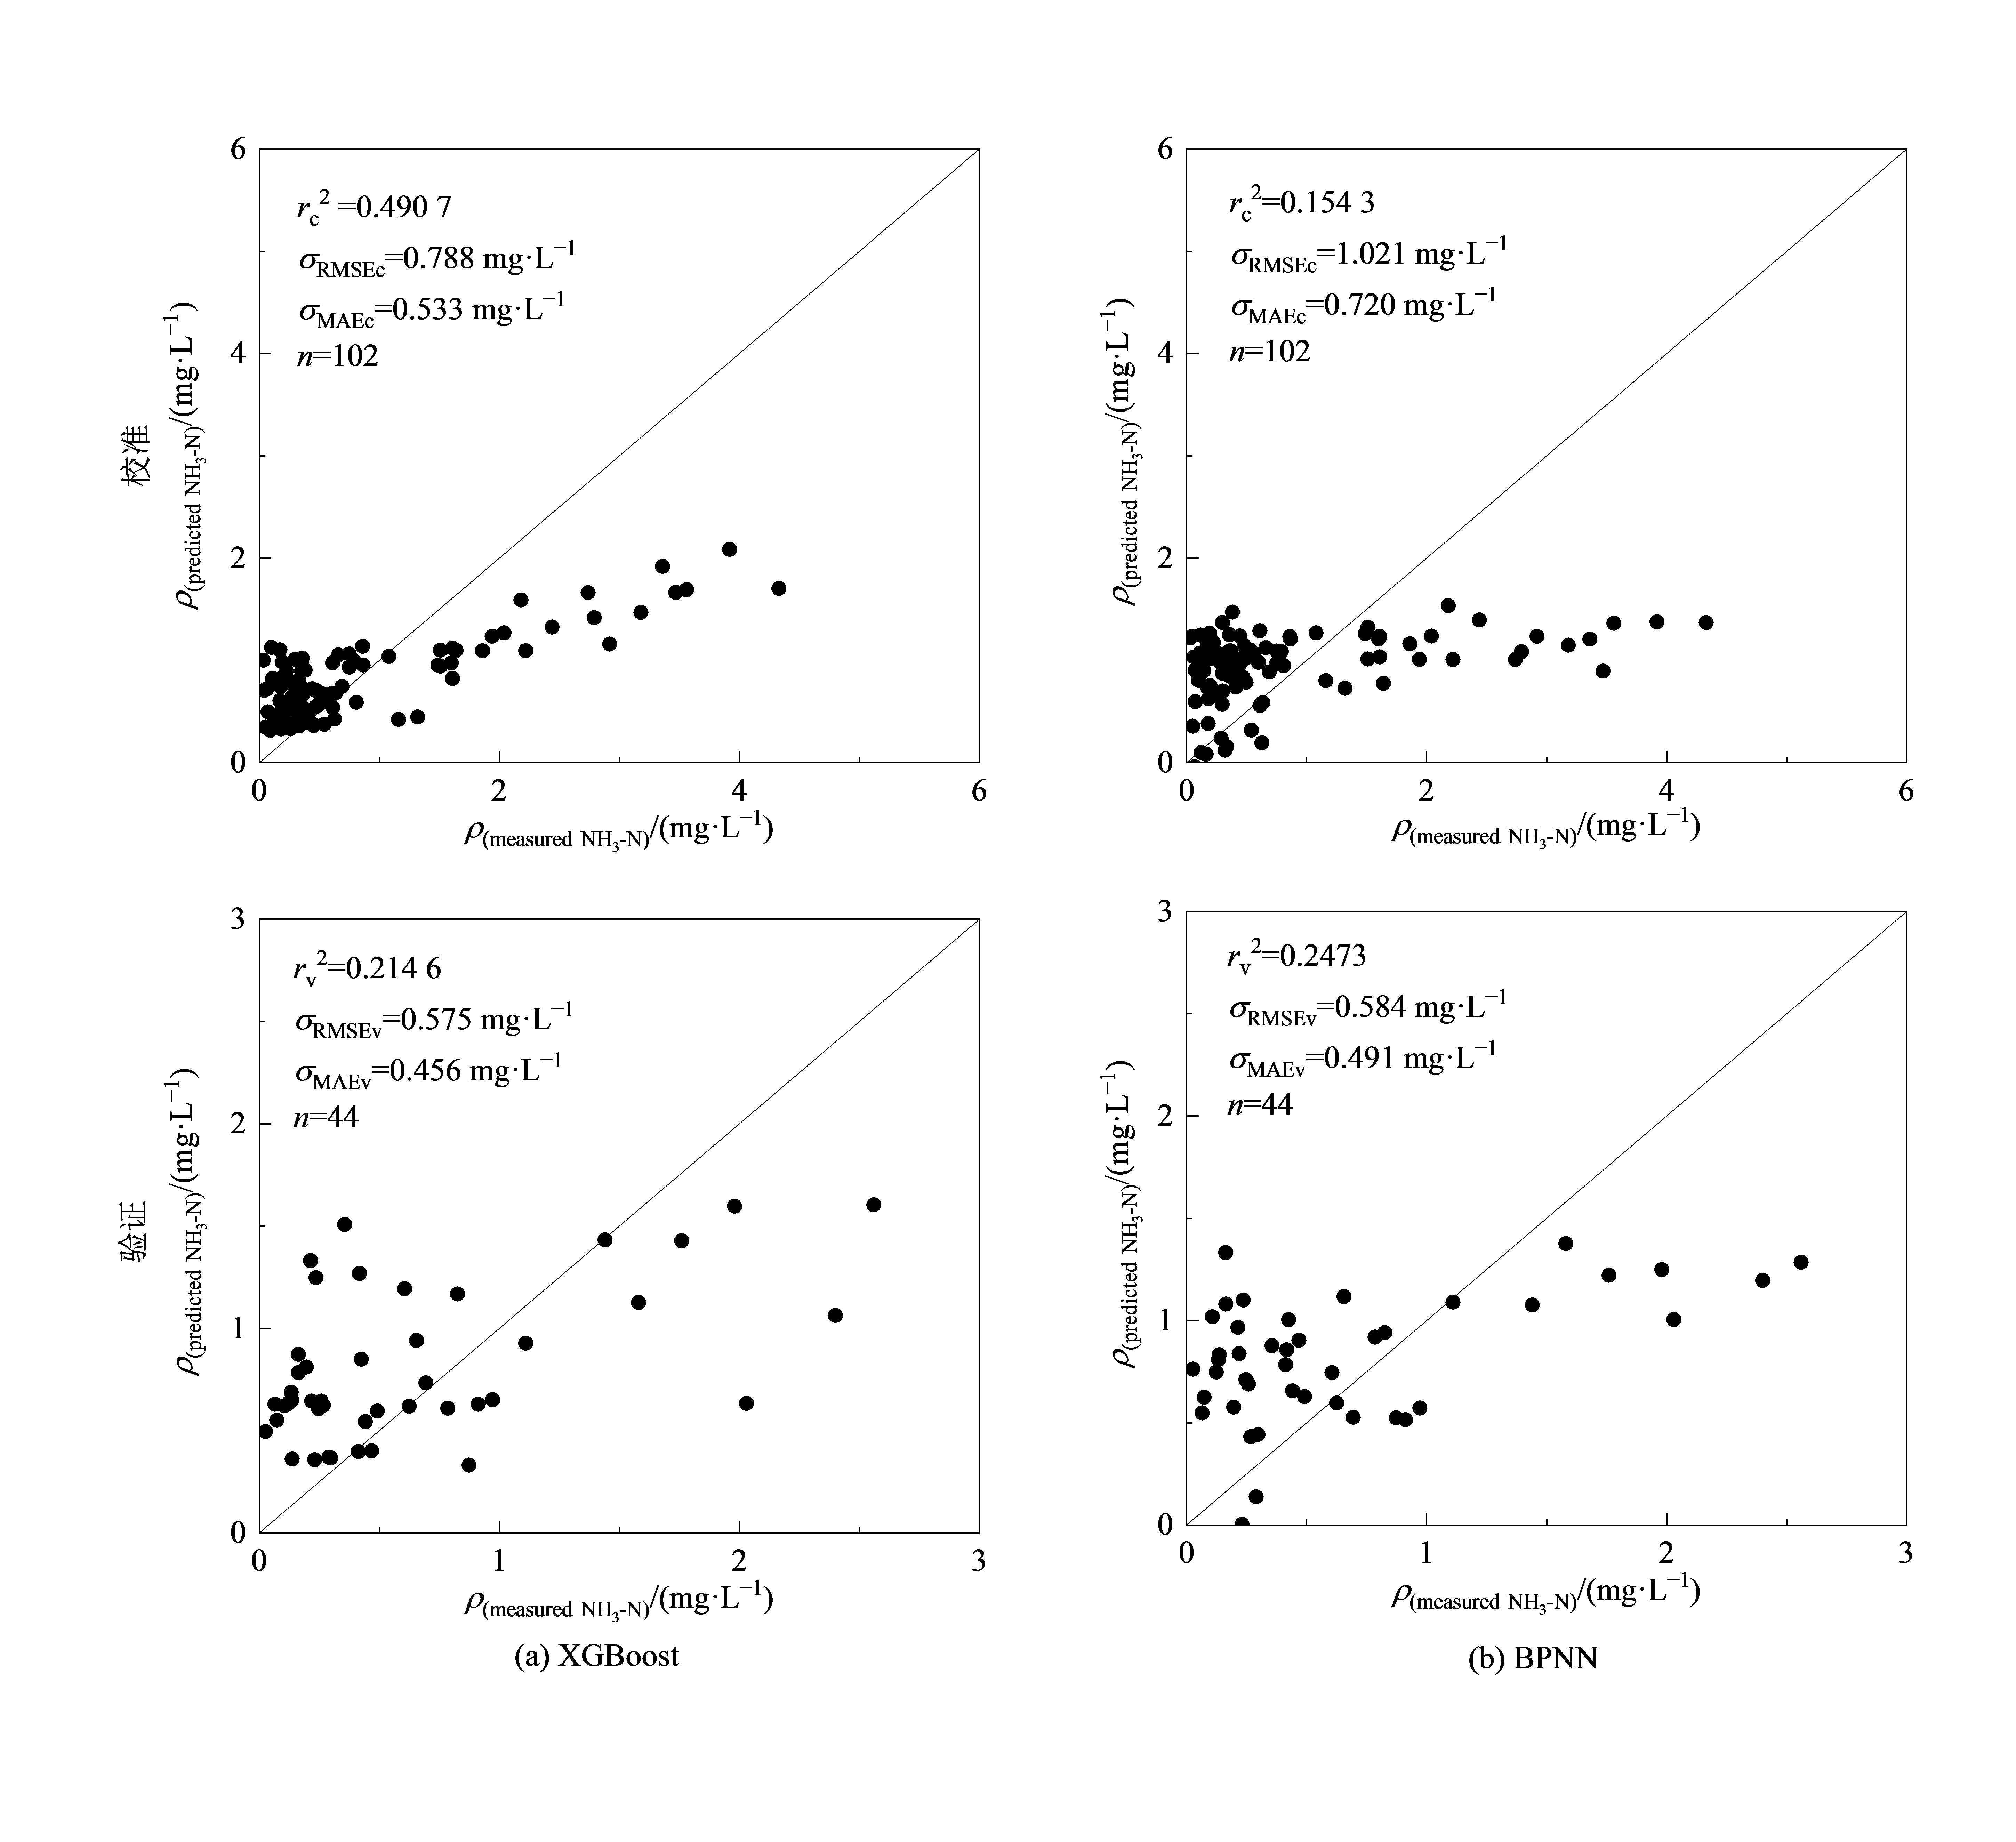
图2 对已有的NH3-N反演模型重新校准及验证 (a) 引自Tian et al., 2023; (b) 引自Kuan et al., 2020
Figure 2 The re-calibration and validation for the previous NH3-N inversion models
| 指数 | 形式 | 指数 | 形式 |
|---|---|---|---|
| S1 | Bi | S18 | (Bi-Bj)/Bk |
| S2 | Bi+Bj | S19 | (Bi×Bj)+Bk |
| S3 | Bi-Bj | S20 | (Bi×Bj)-Bk |
| S4 | Bi×Bj | S21 | Bi×Bj×Bk |
| S5 | Bi/Bj | S22 | Bi×Bj/Bk |
| S6 | (Bi+Bj)0.5 | S23 | Bi/Bj+Bk |
| S7 | (Bi/Bj)0.5 | S24 | Bi/Bj-Bk |
| S8 | (Bi×Bj)0.5 | S25 | Bi+1/Bj+1/Bk |
| S9 | (Bi2+Bj2)0.5 | S26 | Bi-1/Bj+1/Bk |
| S10 | (1/Bj+1/Bk) | S27 | Bi×(1/Bj+1/Bk) |
| S11 | (1/Bj-1/Bk) | S28 | Bi/(1/Bj+1/Bk) |
| S12 | Bi+Bj+Bk | S29 | Bi+1/Bj-1/Bk |
| S13 | Bi+Bj-Bk | S30 | Bi-1/Bj-1/Bk |
| S14 | (Bi+Bj)×Bk | S31 | Bi×(1/Bj-1/Bk) |
| S15 | (Bi+Bj)/Bk | S32 | Bi/(1/Bj-1/Bk) |
| S16 | Bi-Bj-Bk | S33 | (Bi-Bj)/(Bi+Bj) |
| S17 | (Bi-Bj)×Bk | S34 | (Bi+Bj)/(Bk+Bm) |
表5 波段组合形式
Table 5 Band combinations
| 指数 | 形式 | 指数 | 形式 |
|---|---|---|---|
| S1 | Bi | S18 | (Bi-Bj)/Bk |
| S2 | Bi+Bj | S19 | (Bi×Bj)+Bk |
| S3 | Bi-Bj | S20 | (Bi×Bj)-Bk |
| S4 | Bi×Bj | S21 | Bi×Bj×Bk |
| S5 | Bi/Bj | S22 | Bi×Bj/Bk |
| S6 | (Bi+Bj)0.5 | S23 | Bi/Bj+Bk |
| S7 | (Bi/Bj)0.5 | S24 | Bi/Bj-Bk |
| S8 | (Bi×Bj)0.5 | S25 | Bi+1/Bj+1/Bk |
| S9 | (Bi2+Bj2)0.5 | S26 | Bi-1/Bj+1/Bk |
| S10 | (1/Bj+1/Bk) | S27 | Bi×(1/Bj+1/Bk) |
| S11 | (1/Bj-1/Bk) | S28 | Bi/(1/Bj+1/Bk) |
| S12 | Bi+Bj+Bk | S29 | Bi+1/Bj-1/Bk |
| S13 | Bi+Bj-Bk | S30 | Bi-1/Bj-1/Bk |
| S14 | (Bi+Bj)×Bk | S31 | Bi×(1/Bj-1/Bk) |
| S15 | (Bi+Bj)/Bk | S32 | Bi/(1/Bj-1/Bk) |
| S16 | Bi-Bj-Bk | S33 | (Bi-Bj)/(Bi+Bj) |
| S17 | (Bi-Bj)×Bk | S34 | (Bi+Bj)/(Bk+Bm) |
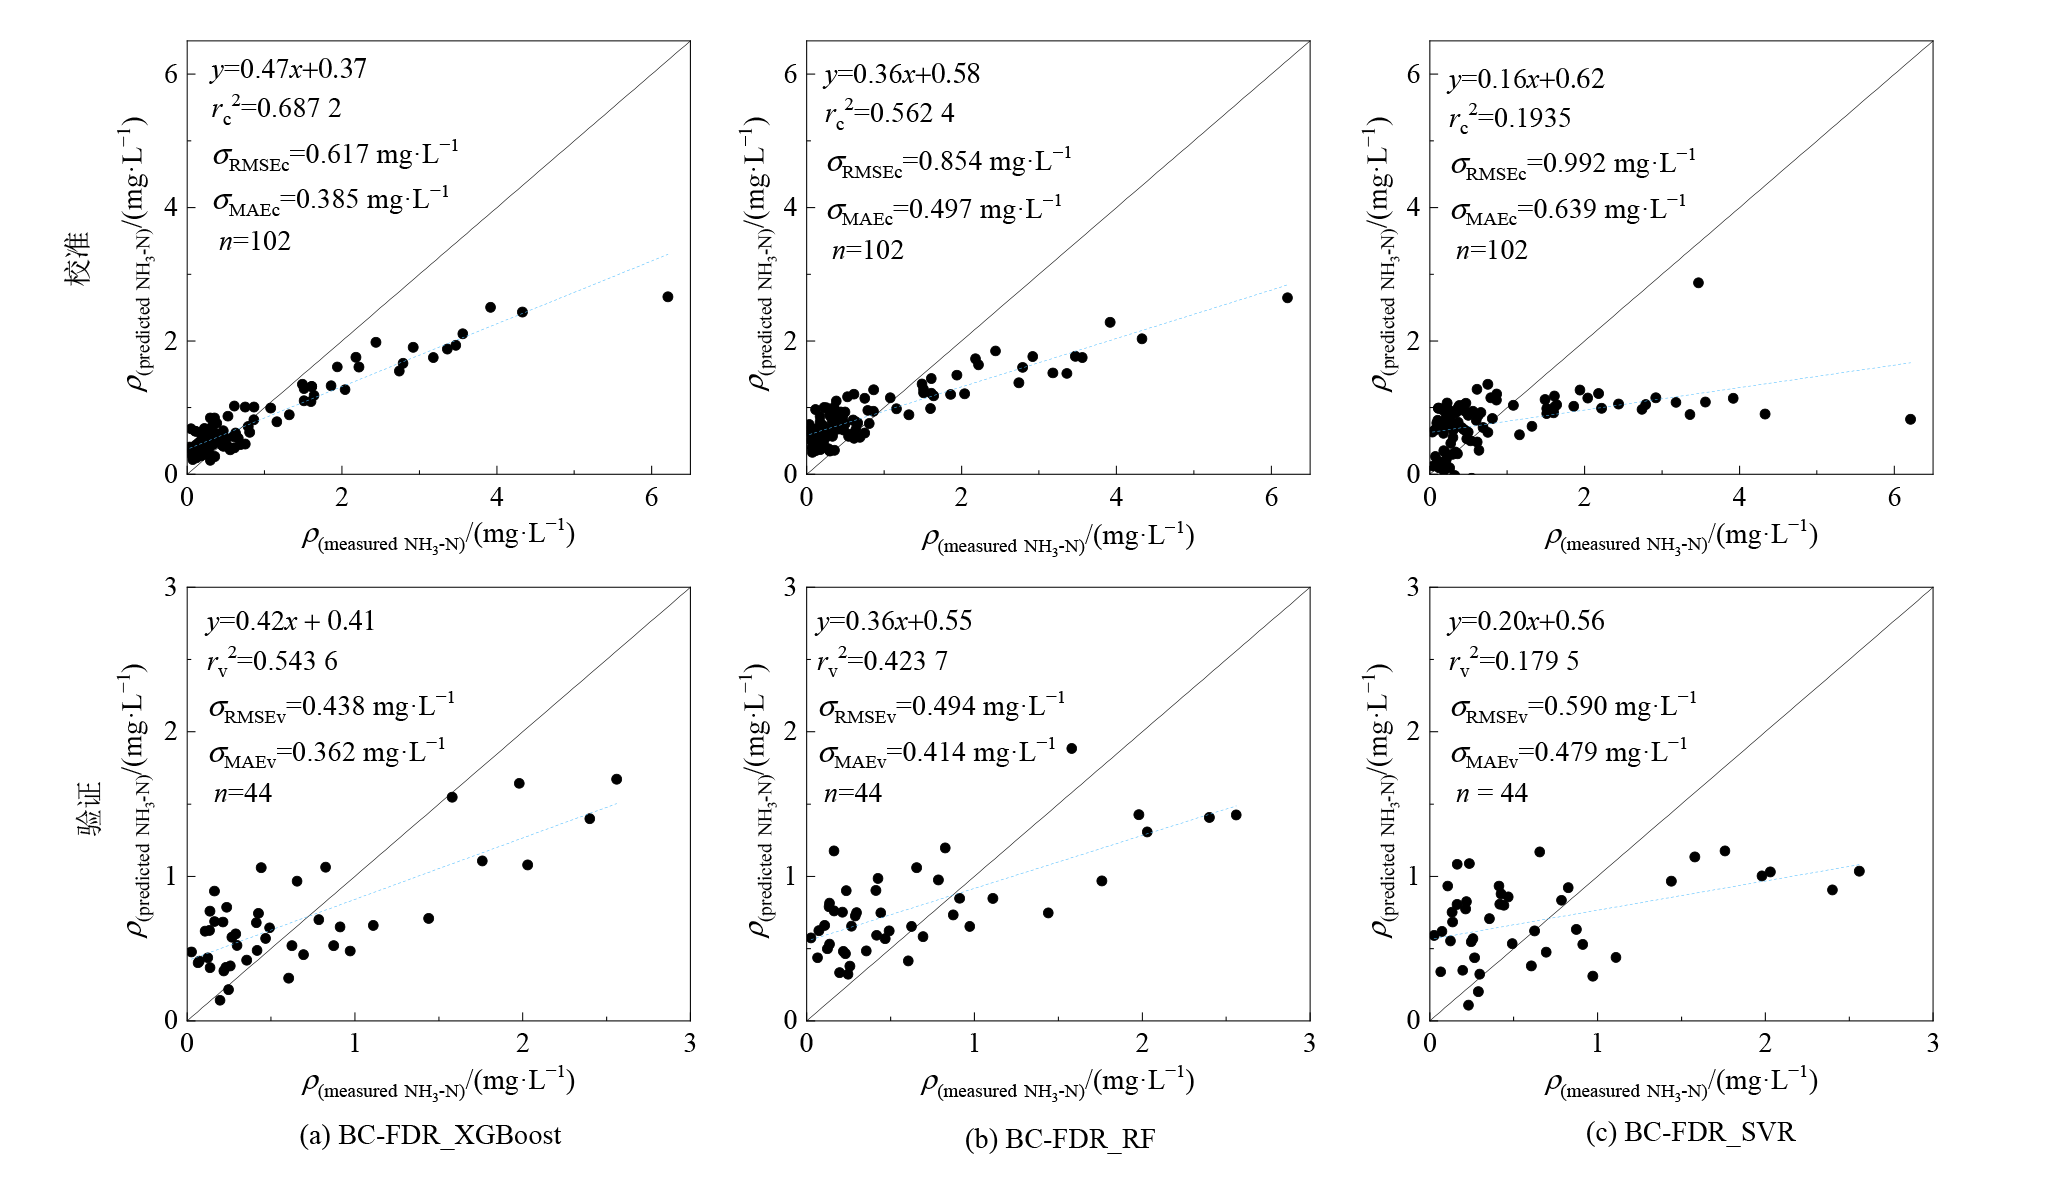
图3 波段特征优化的机器学习NH3-N反演模型
Figure 3 The performance of the BC-FDR_XGBoost/RF/SVR NH3-N inversion model
| 模型 | rc2 | σRMSEc/ (mg·L-1) | σMAEc/ (mg·L-1) | rv2 | σRMSEv/ (mg·L-1) | σMAEv/ (mg·L-1) |
|---|---|---|---|---|---|---|
| BC-FDR_XGBoost | 0.6872 | 0.617 | 0.385 | 0.5436 | 0.438 | 0.362 |
| BC-FDR_RF | 0.5624 | 0.854 | 0.497 | 0.4237 | 0.494 | 0.414 |
| BC-FDR_SVR | 0.1935 | 0.992 | 0.639 | 0.1795 | 0.590 | 0.479 |
表6 本文建立的氨氮模型回归结果
Table 6 The results of the NH3-N inversion model in this study
| 模型 | rc2 | σRMSEc/ (mg·L-1) | σMAEc/ (mg·L-1) | rv2 | σRMSEv/ (mg·L-1) | σMAEv/ (mg·L-1) |
|---|---|---|---|---|---|---|
| BC-FDR_XGBoost | 0.6872 | 0.617 | 0.385 | 0.5436 | 0.438 | 0.362 |
| BC-FDR_RF | 0.5624 | 0.854 | 0.497 | 0.4237 | 0.494 | 0.414 |
| BC-FDR_SVR | 0.1935 | 0.992 | 0.639 | 0.1795 | 0.590 | 0.479 |
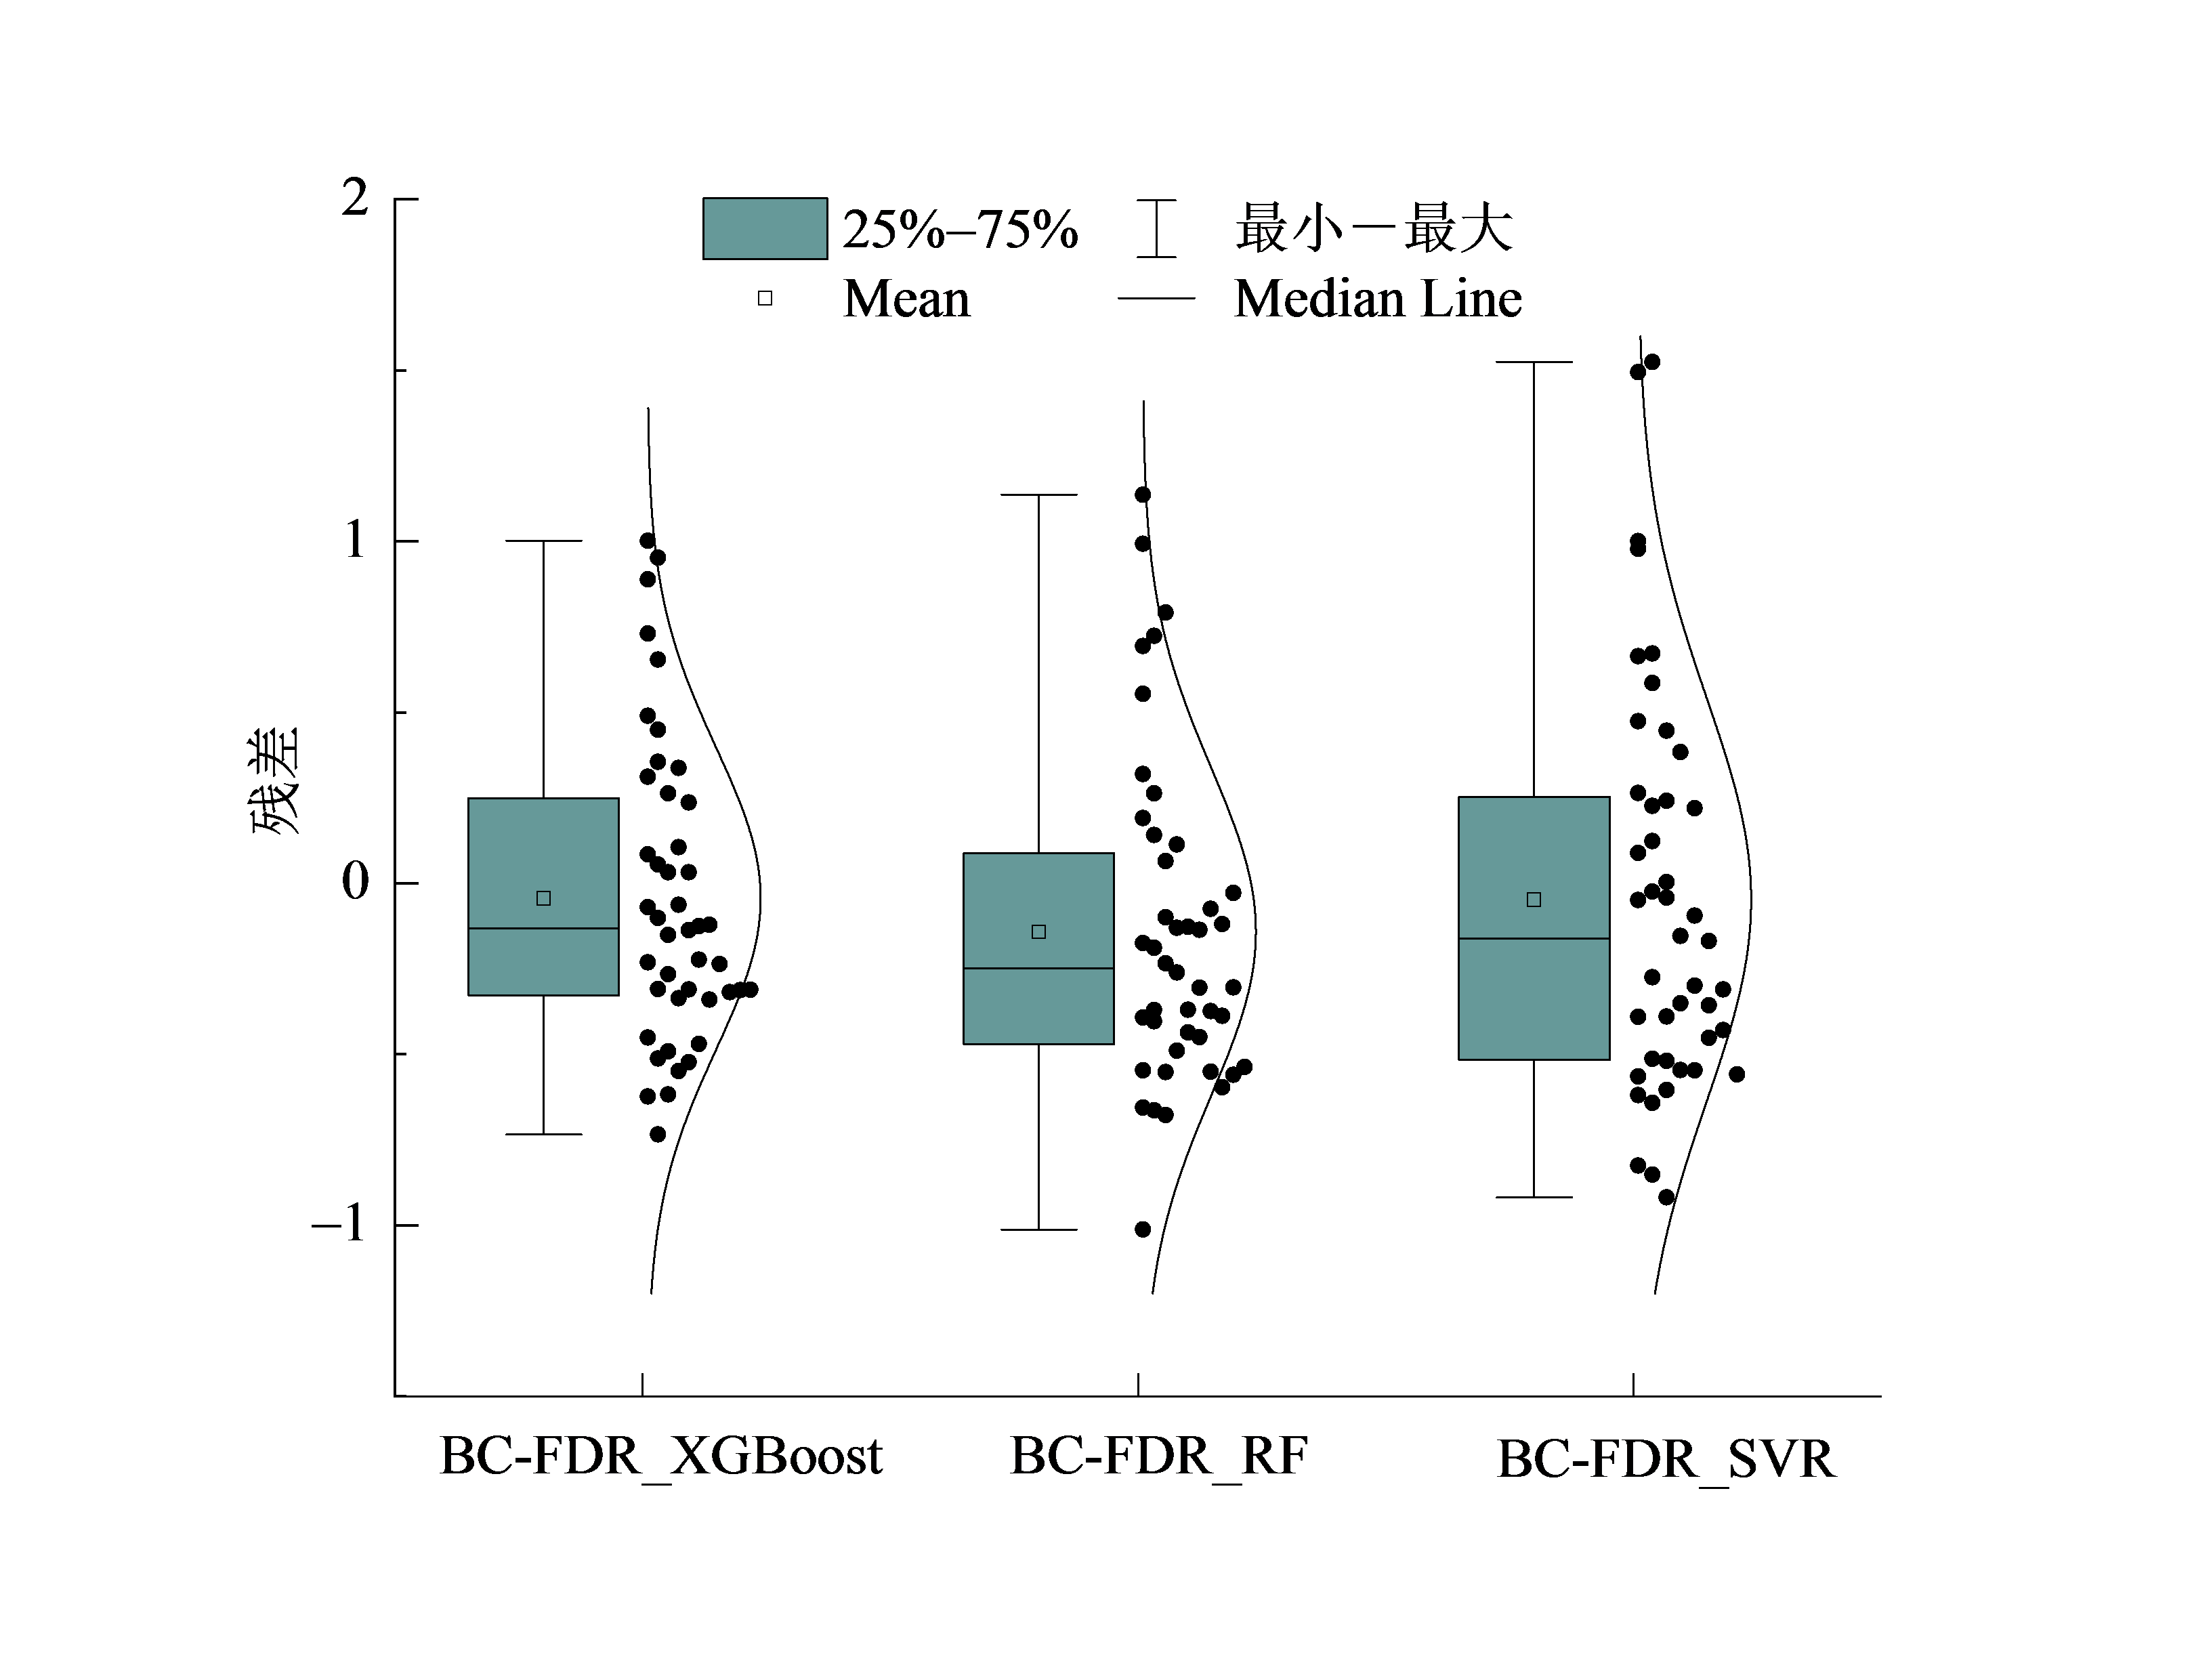
图4 不同模型验证数据集残差分布
Figure 4 Residual distribution of different models

图5 基于BC-FDR_XGBoost模型估算广州市河网水系NH3-N质量浓度
Figure 5 Estimating NH3-N concentrations in Guangzhou using the BC-FDR_XGBoost model
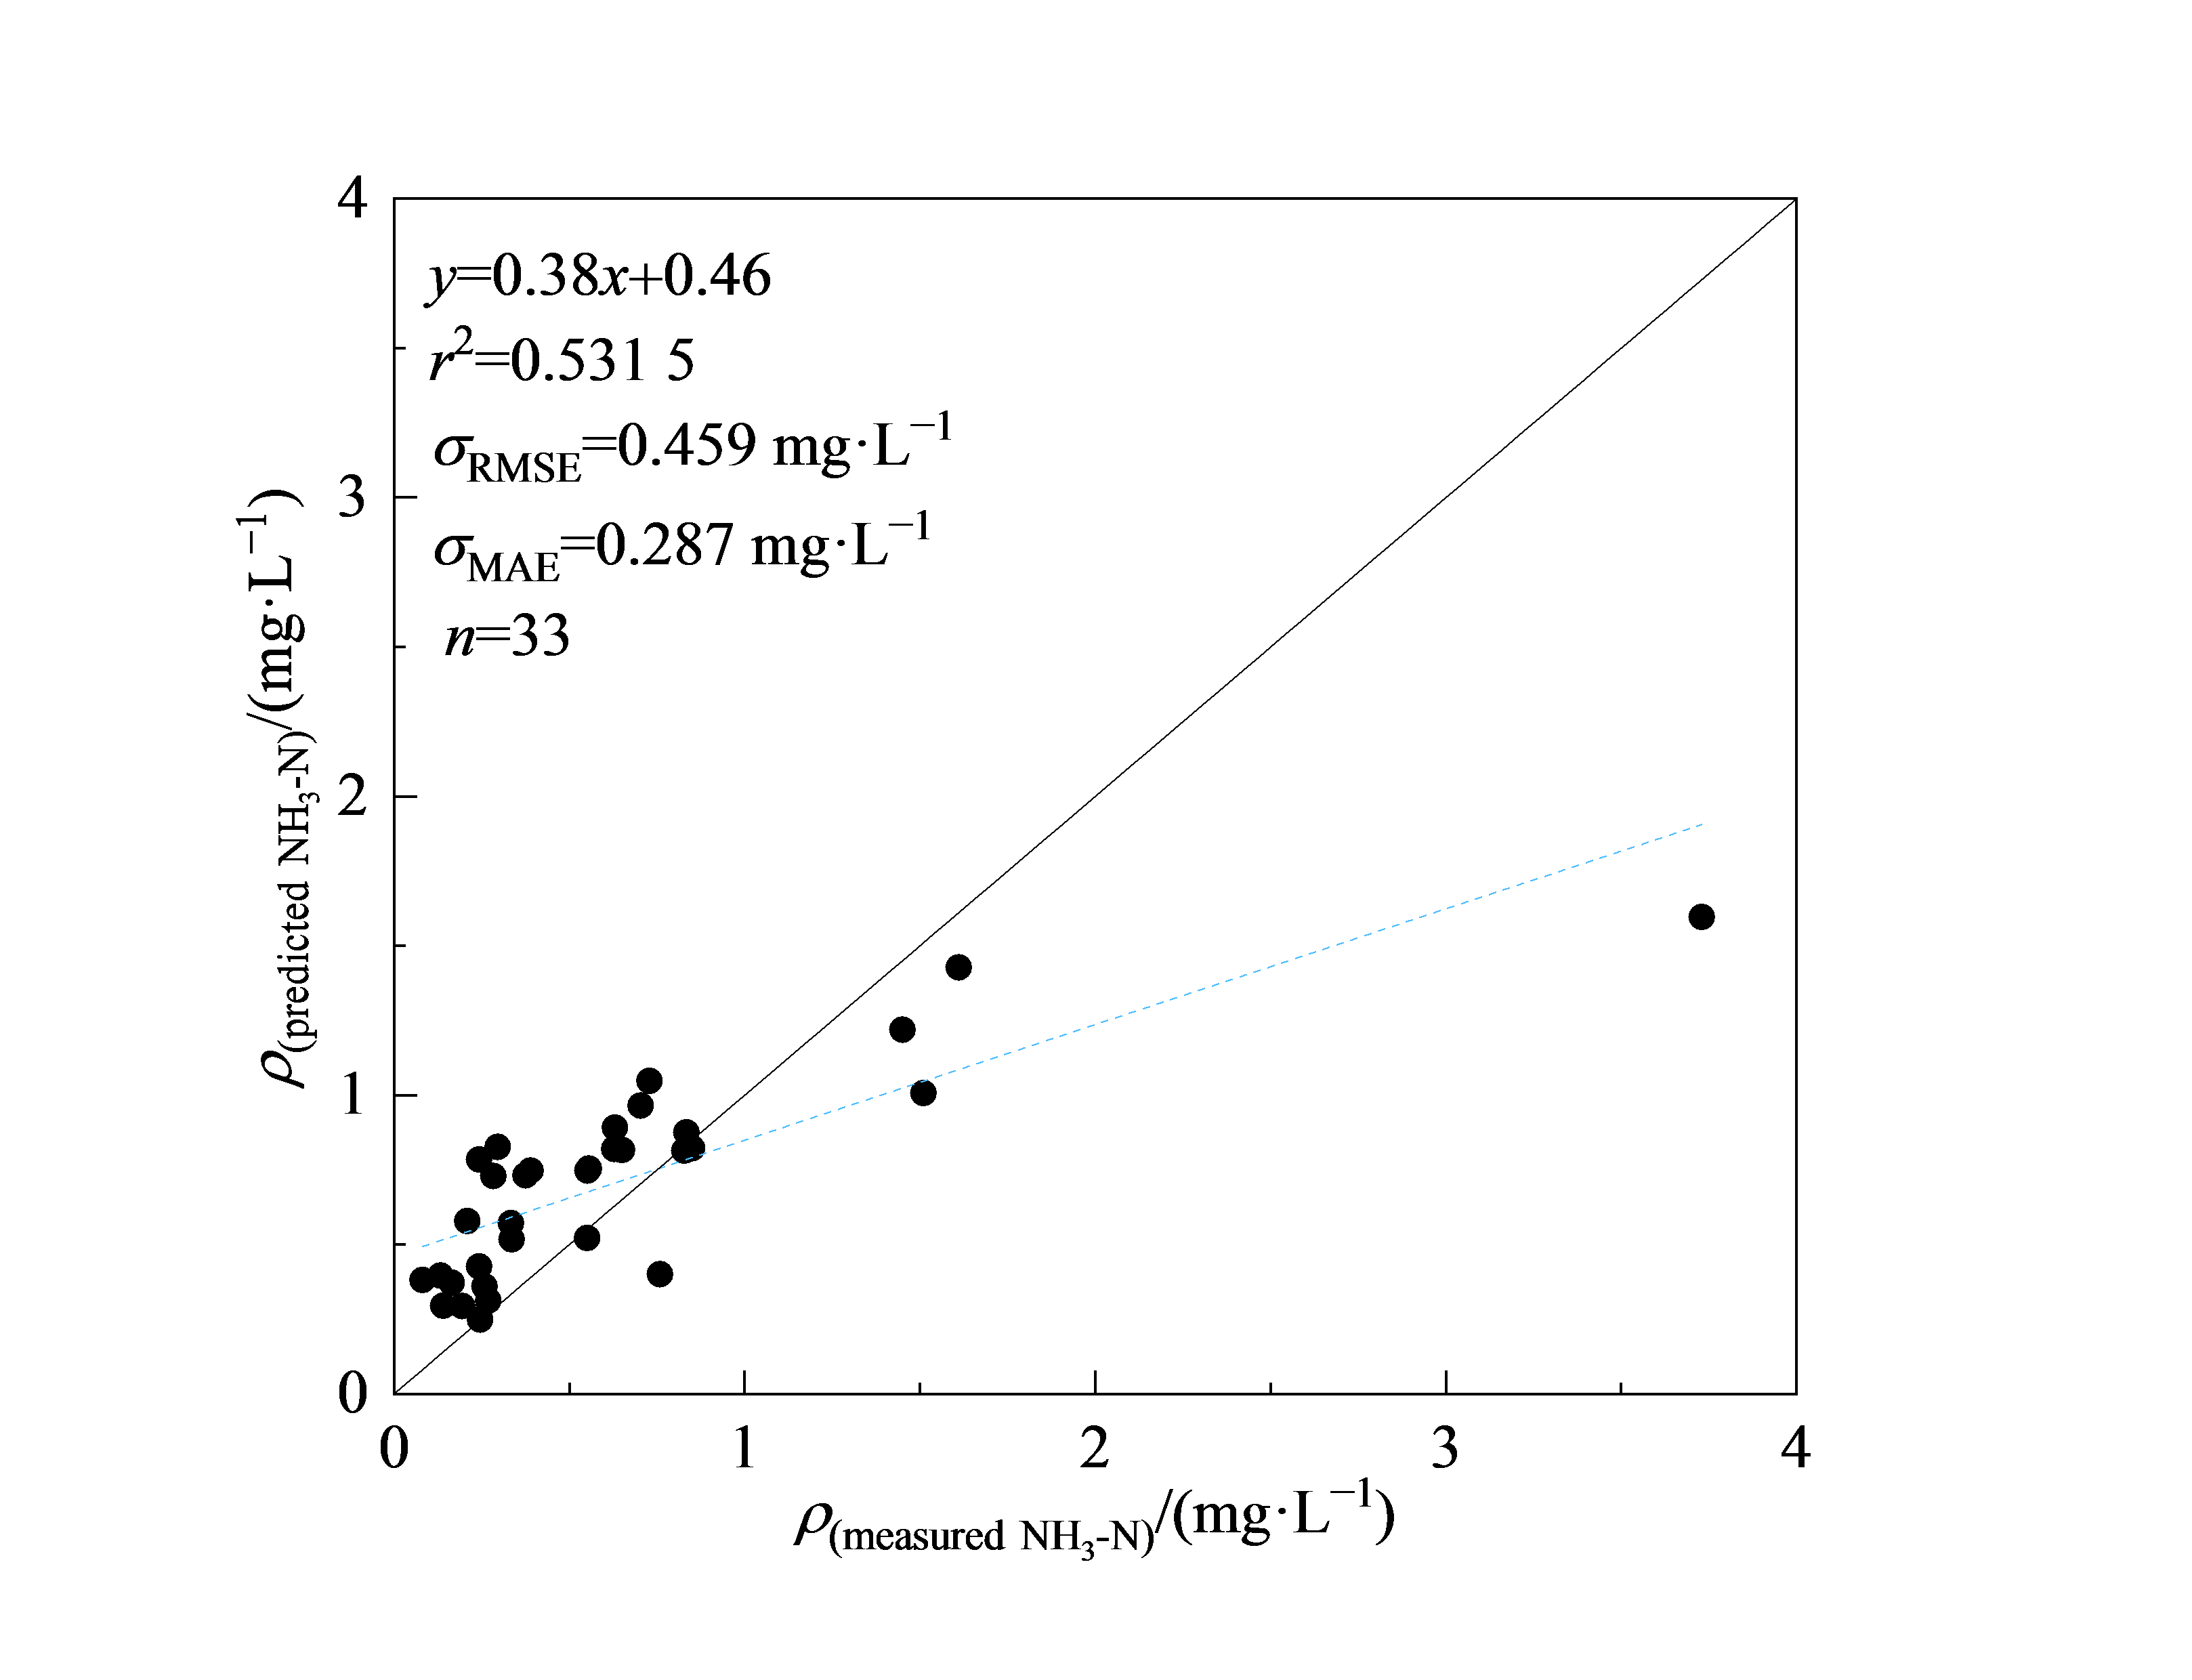
图6 BC-FDR_XGBoost氨氮模型独立验证
Figure 6 Independent testing for BC-FDR_XGBoost NH3-N inversion model
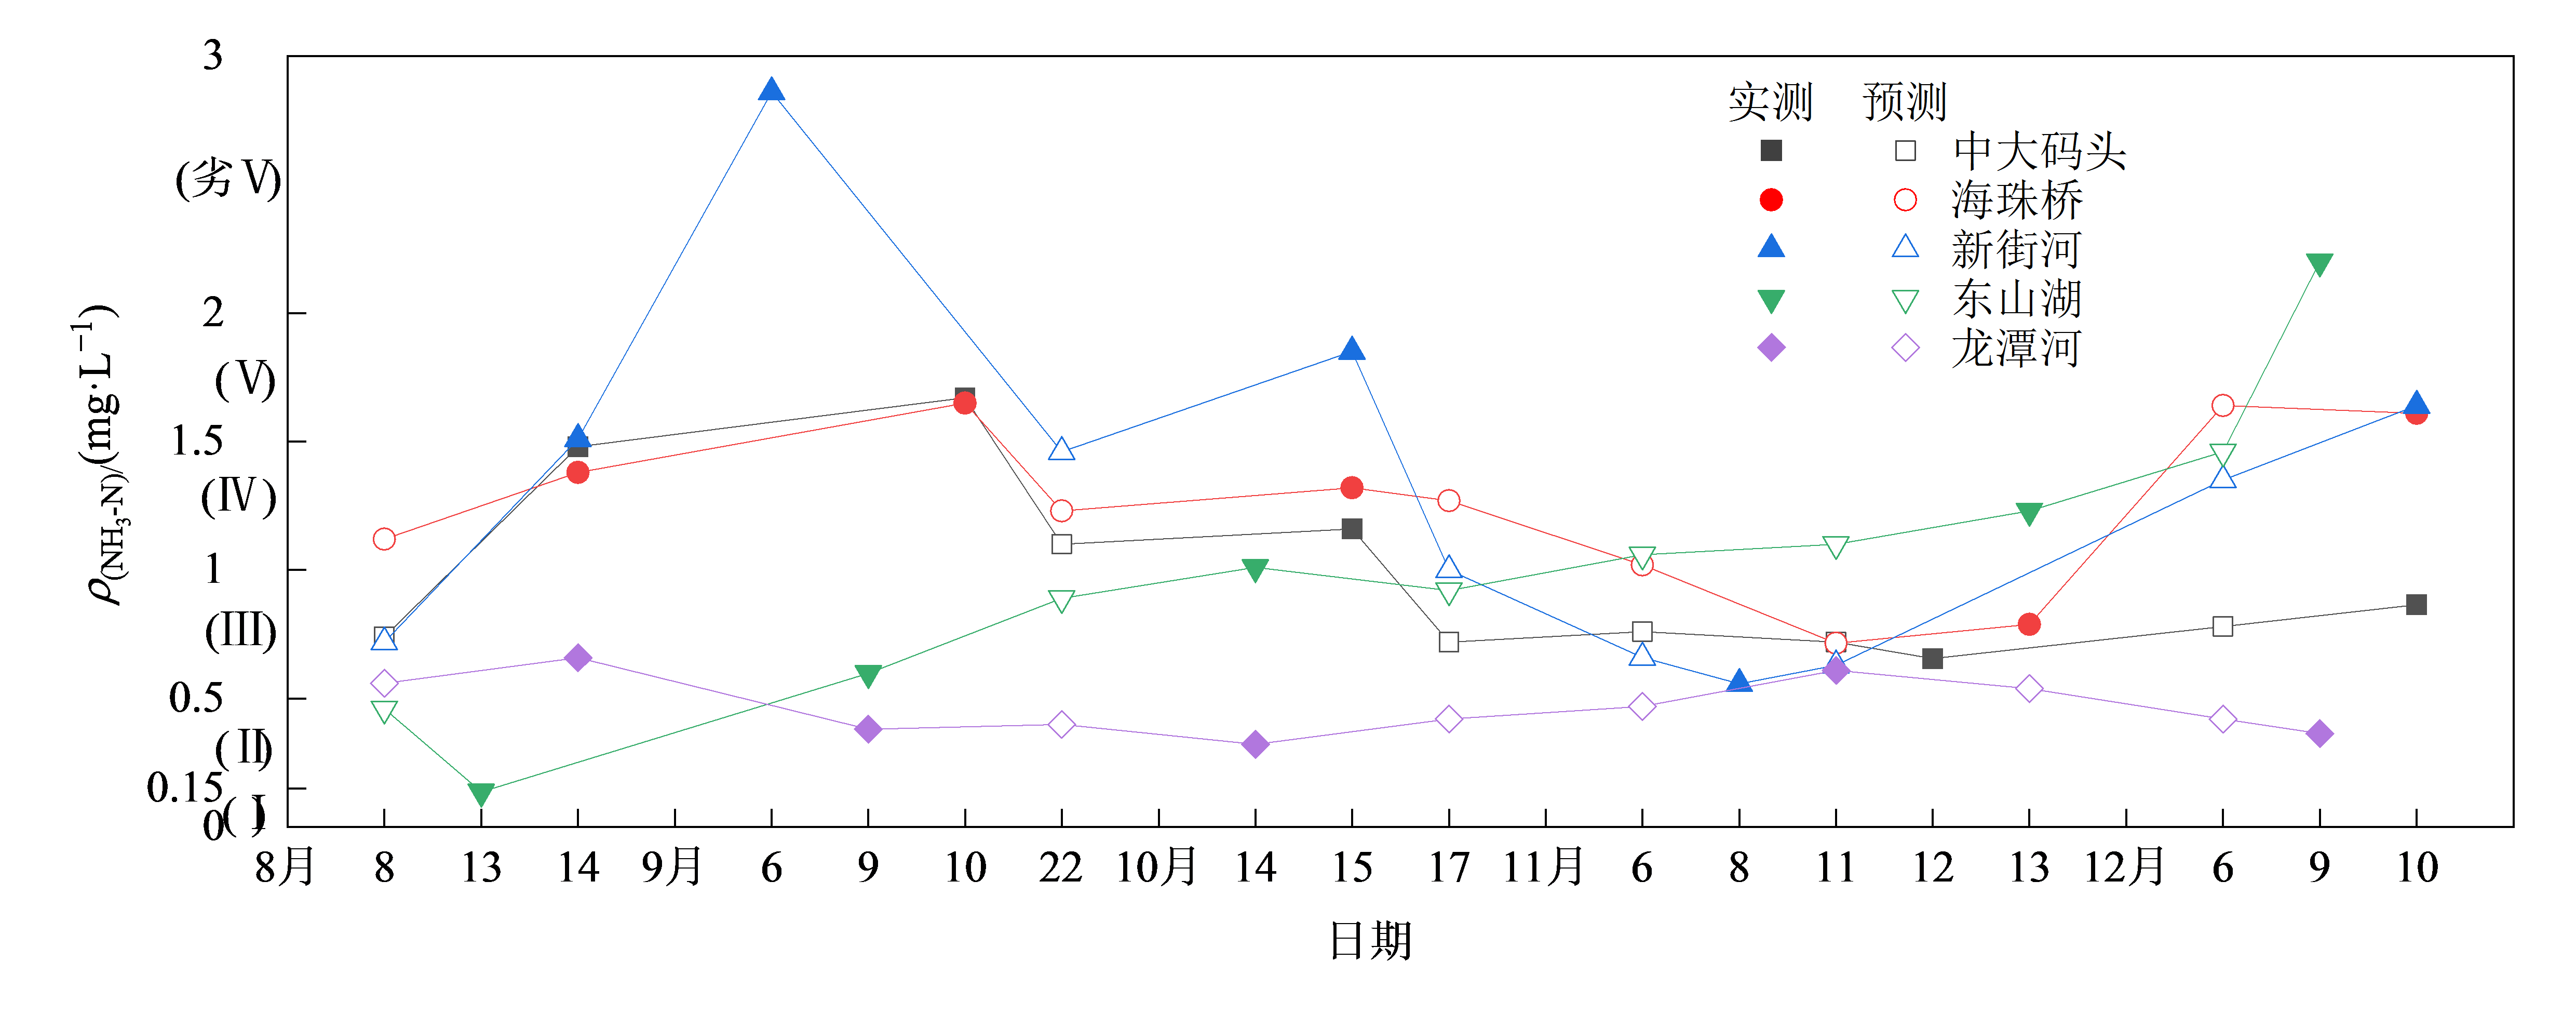
图7 BC-FDR_XGBoost氨氮模型趋势检验
Figure 7 Tendency test for BC-FDR_XGBoost NH3-N inversion model

图8 基于BC-FDR_XGBoost模型估算广州市河网水系NH3-N质量浓度
Figure 8 Estimating NH3-N concentrations in Guangzhou using the BC-FDR_XGBoost model
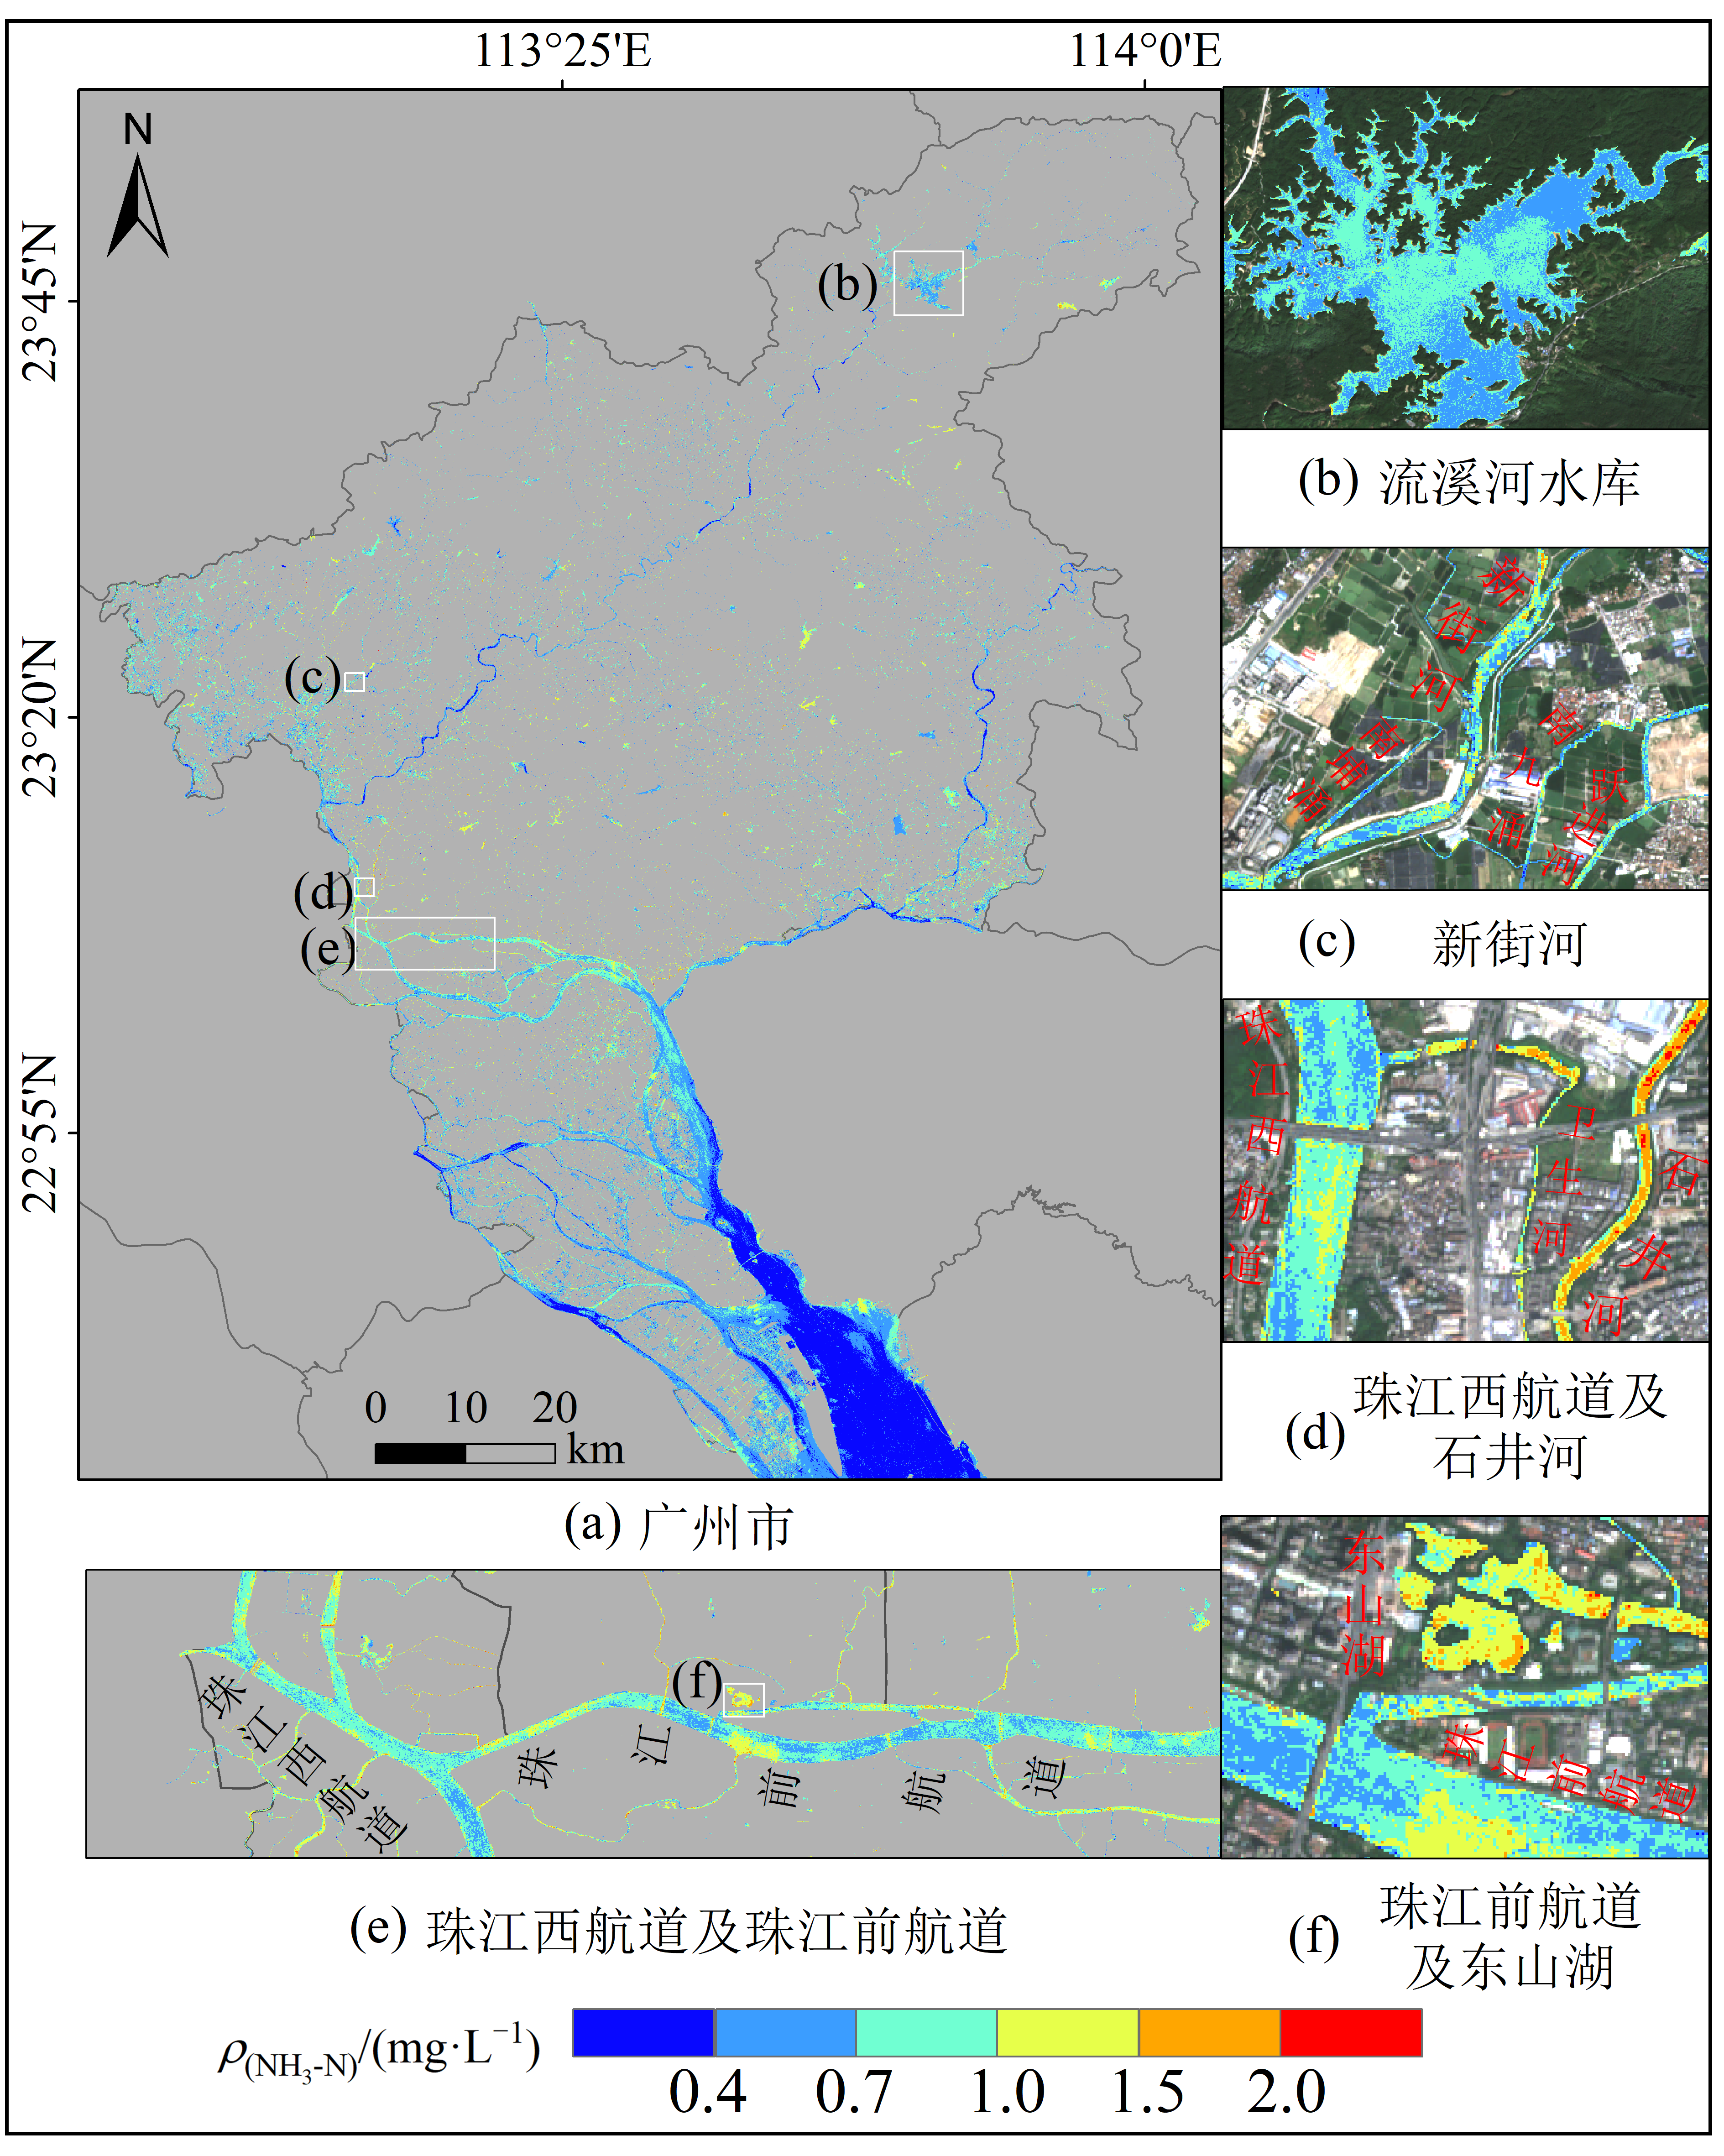
图9 2019年广州市丰水期NH3-N质量浓度的时空分布特征
Figure 9 Spatiotemporal distribution of NH3-N concentrations in Guangzhou during the wet season of 2019

图10 2019年广州市枯水期NH3-N质量浓度的时空分布特征
Figure 10 Spatiotemporal distribution of NH3-N concentration in Guangzhou during the dry season of 2019
| Sentinel-2反演结果 | 丰水期 | 枯水期 |
|---|---|---|
| 平均值/(mg·L-1) | 0.552 | 0.795 |
| 质量浓度区间/(mg·L-1) | 0.182‒2.422 | 0.153‒2.510 |
表7 广州市丰水期和枯水期NH3-N质量浓度
Table 7 The variations of NH3-N concentrations during wet and dry seasons in Guangzhou
| Sentinel-2反演结果 | 丰水期 | 枯水期 |
|---|---|---|
| 平均值/(mg·L-1) | 0.552 | 0.795 |
| 质量浓度区间/(mg·L-1) | 0.182‒2.422 | 0.153‒2.510 |
| [1] | CAO X, ZHANG J, MENG H B, et al., 2023. Remote sensing inversion of water quality parameters in the Yellow River Delta[J]. Ecological Indicators, 155: 110914. |
| [2] | CHAWLA I, KARTHIKEYAN L, MISHRA A K, 2020. A review of remote sensing applications for water security: Quantity, quality, and extremes[J]. Journal of Hydrology, 585: 124826. |
| [3] | CHEN J Y, CHEN S S, FU R, et al., 2021a. Remote sensing estimation of chlorophyll-A in case-II waters of coastal areas: Three-band model versus genetic algorithm-artificial neural networks model[J]. IEEE Journal of Selected Topics in Applied Earth Observations and Remote Sensing, 14: 3640-3658. |
| [4] | CHEN B T, MU X, CHEN P, et al., 2021b. Machine learning-based inversion of water quality parameters in typical reach of the urban river by UAV multispectral data[J]. Ecological Indicators, 133: 108434. |
| [5] | CHEN P, WANG B, WU Y L, et al., 2023. Urban river water quality monitoring based on self-optimizing machine learning method using multi-source remote sensing data[J]. Ecological Indicators, 146: 109750. |
| [6] | DONG G Q, HU Z Q, LIU X, et al., 2020. Spatio-Temporal variation of total nitrogen and ammonia nitrogen in the water source of the middle route of the south-to-north water diversion project[J]. Water, 12(9): 2615. |
| [7] | DÖRNHÖFER K, OPPELT N, 2016. Remote sensing for lake research and monitoring-Recent advances[J]. Ecological Indicators, 64: 105-122. |
| [8] | EJAZ U, KHAN S M, JEHANGIR S, et al., 2024. Integrated analytics and machine learning for water quality index assessment-Monitoring of industrial waste polluted stream[J]. Journal of Cleaner Production, 450: 141877. |
| [9] | HAN D, CURRELL M J, CAO G, 2016. Deep challenges for China’s war on water pollution[J]. Environmental Pollution, 218: 1222-1233. |
| [10] | KUAN H F, LI J, ZHANG X J, et al., 2020. Remote estimation of water quality parameters of medium-and small-sized inland rivers using Sentinel-2 imagery[J]. Water, 12(11): 3124. |
| [11] | LI N, NING Z Y, CHEN M, et al., 2022. Satellite and machine learning monitoring of optically inactive water quality variability in a tropical river[J]. Remote Sensing, 14(21): 5466. |
| [12] | LIU B, XI H J, LI T H, et al., 2023. Black-odorous water bodies annual dynamics in the context of climate change adaptation in Guangzhou City, China[J]. Journal of Cleaner Production, 414(11): 137781. |
| [13] | LIU Y, WU X, QI W C, 2024. Assessing the water quality in urban river considering the influence of rainstorm flood: A case study of Handan city, China[J]. Ecological Indicators, 160: 111941. |
| [14] | LO Y, FU L, LU T C, et al., 2023. Medium-sized lake water quality parameters retrieval using multispectral uav image and machine learning algorithms: A case study of the yuandang lake, China[J]. Drones, 7(4): 244. |
| [15] | PAHLEVAN N, CHITTIMALLI S K, BALASUBRAMANIAN S V, et al., 2019. Sentinel-2/Landsat-8 product consistency and implications for monitoring aquatic systems[J]. Remote sensing of Environment, 220: 19-29. |
| [16] | SAGAN V, PETERSON K T, MAIMAITIJIANG M, et al., 2020. Monitoring inland water quality using remote sensing: Potential and limitations of spectral indices, bio-optical simulations, machine learning, and cloud computing[J]. Earth-Science Reviews, 205(3): 103187. |
| [17] | SEO J Y, WON J G, LEE H S, et al., 2024. Probabilistic monitoring of meteorological drought impacts on water quality of major rivers in South Korea using copula models[J]. Water Research, 251: 121175. |
| [18] | SHI X S, QIU Z F, HU Y J, et al., 2024. Monitoring the water quality distribution characteristics in the Huaihe River Basin based on the Sentinel-2 Satellite[J]. Water, 16(6): 860. |
| [19] | SONG W, YINGLAN A, WANG Y T, et al., 2024. Study on remote sensing inversion and temporal-spatial variation of Hulun lake water quality based on machine learning[J]. Journal of Contaminant Hydrology, 260: 104282. |
| [20] | TANG W Z, PEI Y S, ZHENG H, et al., 2022. Twenty years of China’s water pollution control: Experiences and challenges[J]. Chemosphere, 295: 133875. |
| [21] | TIAN D, ZHAO X F, GAO L, et al., 2024. Estimation of water quality variables based on machine learning model and cluster analysis-based empirical model using multi-source remote sensing data in inland reservoirs, South China[J]. Environmental Pollution, 342: 123104. |
| [22] | TIAN S, GUO H W, XU W, et al., 2023. Remote sensing retrieval of inland water quality parameters using Sentinel-2 and multiple machine learning algorithms[J]. Environmental Science and Pollution Research, 30(7): 18617-18630. |
| [23] | TOMING K, KUTSER T, LAAS A, et al., 2016. First experiences in mapping lake water quality parameters with Sentinel-2 MSI imagery[J]. Remote Sensing, 8(8): 640. |
| [24] | TOPP S N, PAVELSKY T M, JENSEN D, et al., 2020. Research trends in the use of remote sensing for inland water quality science: Moving towards multidisciplinary applications[J]. Water, 12(1): 169. |
| [25] | WANG C Y, CHEN S S, LI D, et al., 2017. A Landsat-based model for retrieving total suspended solids concentration of estuaries and coasts in China[J]. Geoscientific Model Development, 10(12): 4347-4365. |
| [26] | WANG C Y, LI W J, CHEN S S, et al., 2018. The spatial and temporal variation of total suspended solid concentration in Pearl River Estuary during 1987-2015 based on remote sensing[J]. Science of the Total Environment, 618: 1125-1138. |
| [27] | WANG C Y, WANG D N, YANG J, et al., 2020. Suspended Sediment within Estuaries and along Coasts: A Review of Spatial and Temporal Variations based on Remote Sensing[J]. Journal of Coastal Research, 36(6): 1323-1331. |
| [28] | WANG J B, ZHOU W Q, ZHAO M L, et al., 2023. Water quality assessment and pollution evaluation of surface water sources: The case of Weishan and Luoma Lakes, Xuzhou, Jiangsu Province, China[J]. Environmental Technology & Innovation, 32: 103397. |
| [29] | WANG X L, FU L, HE C S, 2011. Applying support vector regression to water quality modelling by remote sensing data[J]. International Journal of Remote Sensing, 32(23): 8615-8627. |
| [30] | ZHANG H W, XUE B L, WANG G Q, et al., 2022. Deep learning-based water quality retrieval in an impounded lake using landsat 8 imagery: An application in Dongping lake[J]. Remote Sensing, 14(18): 4505. |
| [31] | 广州市生态环境局. 2019年广州市环境质量状况公报[EB/OL]. [2020-06-03]. https://sthjj.gz.gov.cn/zwgk/hjgb/index_5.html. |
| Guangzhou Municipal Ecological Environment Bureau. 2019 Guangzhou Environmental Quality Report[EB/OL]. [2020-06-03]. https://sthjj.gz.gov.cn/zwgk/hjgb/index_5.html. | |
| [32] | 高佳欣, 林昱坤, 涂耀仁, 等, 2023. 遥感反演技术应用于监测地表水体水质参数的现状与展望[J]. 遥感信息, 38(6): 1-14. |
| GAO J L, LIN Y K, TU Y R, et al., 2023. Current status and prospects of remote sensing inversion technology applied to monitoring water quality parameters of surface water[J]. Remote Sensing Information, 38(6): 1-14. | |
| [33] | 郭荣幸, 王超梁, 陈济民, 等, 2024. 基于Sentinel-2多光谱遥感影像的小浪底水质反演[J]. 人民黄河, 46(1): 93-96. |
| GUO R X, WANG C L, CHEN J M, et al., 2024. Remote sensing inversion of water quality of Xiaolangdi Reservoir based on Sentinel-2 Multi-Spectral images[J]. Yellow River, 46(1): 93-96. | |
| [34] | 刘轩, 赵同谦, 蔡太义, 等, 2021. 丹江口水库总氮、氨氮遥感反演及时空变化研究[J]. 农业资源与环境学报, 38(5): 829-838. |
| LIU X, ZHAO T Q, CAI T Y, et al., 2021. Spatiotemporal monitoring of total nitrogen and ammonia nitrogen in Danjiangkou reservoir[J]. Journal of Agricultural Resources and Environment, 38(5): 829-838. | |
| [35] | 王重洋, 周成虎, 陈水森, 等, 2021. 河口最大浑浊带研究的回顾与展望[J]. 科学通报, 66(18): 2328-2342. |
| WANG C Y, ZHOU C H, CHEN S S, et al., 2021. Retrospect and perspective of the estuarine turbidity maximum zone researches[J]. Chinese Science Bulletin, 66(18): 2328-2342. | |
| [36] | 王思梦, 秦伯强, 2023. 湖泊水质参数遥感监测研究进展[J]. 环境科学, 44(3): 1228-1243. |
| WANG S M, QIN B Q, 2023. Research progress on remote sensing monitoring of lake water quality parameters[J]. Environmental Science, 44(3): 1228-1243. |
| [1] | 王薇, 夏宇轩. 基于遥感技术和机器学习的城市街区PM2.5空间分布特征研究——以合肥市滨湖新区为例[J]. 生态环境学报, 2024, 33(9): 1426-1437. |
| [2] | 杨可明, 彭里顺, 张燕海, 谷新茹, 陈新阳, 江克贵. 淮北矿区多种类型植被地上生物量反演研究[J]. 生态环境学报, 2024, 33(7): 1027-1035. |
| [3] | 王雪梅, 杨雪峰, 赵枫, 安柏耸, 黄晓宇. 基于机器学习算法的干旱区绿洲地上生物量估算[J]. 生态环境学报, 2023, 32(6): 1007-1015. |
| [4] | 姜鹏, 秦美欧, 李荣平, 孟莹, 杨霏云, 温日红, 孙沛, 方缘. 中国典型生态系统GPP的季节变异及其影响要素[J]. 生态环境学报, 2022, 31(4): 643-651. |
| [5] | 谢邵文, 郭晓淞, 杨芬, 黄强, 陈曼佳, 魏兴琥, 刘承帅. 广州市城市公园土壤重金属累积特征、形态分布及其生态风险[J]. 生态环境学报, 2022, 31(11): 2206-2215. |
| [6] | 陈漾, 张金谱, 邱晓暖, 琚鸿, 黄俊. 2021年广州市臭氧污染特征及气象因子影响分析[J]. 生态环境学报, 2022, 31(10): 2028-2038. |
| 阅读次数 | ||||||
|
全文 |
|
|||||
|
摘要 |
|
|||||