生态环境学报 ›› 2024, Vol. 33 ›› Issue (2): 242-248.DOI: 10.16258/j.cnki.1674-5906.2024.02.008
杨纯( ), 蒋恬田, 李欣, 李小马*()
收稿日期:2023-12-11
出版日期:2024-02-18
发布日期:2024-04-03
通讯作者:
*李小马。E-mail: lixiaoma@hunau.edu.cn作者简介:杨纯(1998年生),女,硕士研究生,主要从事城市绿地景观格局与热环境方面的研究。E-mail: yangchundaisy@stu.hunau.edu.cn
基金资助:
YANG Chun(), JIANG Tiantian, LI Xin, LI Xiaoma*()
Received:2023-12-11
Online:2024-02-18
Published:2024-04-03
摘要:
优化绿地空间配置(如破碎度)是改善城市热环境的有效途径。然而绿地破碎度对城市热环境的影响可能随绿化覆盖率的变化而变化,对改善城市热环境提出了巨大挑战,但相关研究十分缺乏。以长沙市为例,利用Landsat地表温度表征城市热环境,使用解译于高分2号遥感影像的城市绿地图在1 m像元尺度量化绿化覆盖率和绿地破碎度(用绿地边界密度表征)。以419个1 km格网为分析单元,应用分段线性回归揭示绿化覆盖率与绿地破碎度间的非线性关系,识别绿化覆盖率阈值并以此为标准将419个1 km格网划分为高绿化覆盖率区和低绿化覆盖率区。以1 km格网平均地表温度为因变量,绿化覆盖率、绿地破碎度、水体覆盖率和裸地覆盖率为自变量从研究区、高绿化覆盖率区和低覆盖率区3个方面建立多元线性回归模型阐明绿地破碎度对地表温度的影响。最后进行方差分解分析绿化覆盖率、绿地破碎度和其他土地覆盖率对地表温度的独立和联合影响。结果显示,1)绿地破碎度随绿化覆盖率的增加先增加后降低,阈值为44.9%。2)整个研究区,4个指标可解释69.1%的地表温度变异,地表温度随绿化覆盖率、水体覆盖率、裸地覆盖率和绿地破碎度的增加显著降低。3)低绿化覆盖率下绿地破碎度显著影响地表温度,高绿化覆盖率下绿地破碎度对地表温度呈不显著正影响。4)在研究区和不同绿化覆盖率区域,绿化覆盖率对地表温度的独立影响均高于绿地破碎度的独立影响。建议长沙城市绿地规划管理在提高绿化覆盖率的同时可提高低绿化覆盖率区域绿地破碎度以改善城市热环境。
中图分类号:
杨纯, 蒋恬田, 李欣, 李小马. 绿化覆盖率对城市绿地破碎度与地表温度的关系的影响[J]. 生态环境学报, 2024, 33(2): 242-248.
YANG Chun, JIANG Tiantian, LI Xin, LI Xiaoma. Effects of Percent Green Cover on the Relationship between Greenspace Fragmentation and Land Surface Temperature: A case Study in Changsha, China[J]. Ecology and Environment, 2024, 33(2): 242-248.

图1 研究区概况
Figure 1 Overview of the studied area
| 景观格局指标 (缩写) | 类别 | 描述 (单位) | 公式 |
|---|---|---|---|
| 绿化覆盖率 (Pg) | 绿化覆盖率 | 绿地总面积占分析单元的百分比 (%) | |
| 水体覆盖率 (Pw) | 其他覆盖率 | 水体总面积占分析单元的百分比 (%) | |
| 裸地覆盖率 (Pb) | 裸地总面积占分析单元的百分比 (%) | ||
| 不透水面覆盖率 (Pi) | 不透水面总面积占分析单元的百分比 (%) | ||
| 绿地边界密度 (Dg) | 绿地破碎度 | 每公顷绿地所有边缘部分的总长度 (不包括边界), 反映绿地的破碎程度 (m∙hm−2) |
表1 景观格局指标描述及其公式
Table 1 Description and equations of the selected landscape metrics
| 景观格局指标 (缩写) | 类别 | 描述 (单位) | 公式 |
|---|---|---|---|
| 绿化覆盖率 (Pg) | 绿化覆盖率 | 绿地总面积占分析单元的百分比 (%) | |
| 水体覆盖率 (Pw) | 其他覆盖率 | 水体总面积占分析单元的百分比 (%) | |
| 裸地覆盖率 (Pb) | 裸地总面积占分析单元的百分比 (%) | ||
| 不透水面覆盖率 (Pi) | 不透水面总面积占分析单元的百分比 (%) | ||
| 绿地边界密度 (Dg) | 绿地破碎度 | 每公顷绿地所有边缘部分的总长度 (不包括边界), 反映绿地的破碎程度 (m∙hm−2) |
| 景观格局指标 | 平均值 | 标准差 | 最小值 | 最大值 |
|---|---|---|---|---|
| 绿地边界密度/(m∙hm−2) | 577 | 152 | 132 | 1096 |
| 绿化覆盖率/% | 42.5 | 15.2 | 8.14 | 82.6 |
| 裸地覆盖率/% | 4.38 | 6.53 | 0.00 | 45.3 |
| 水体覆盖率/% | 4.71 | 8.81 | 0.00 | 59.4 |
| 不透水面覆盖率/% | 48.4 | 17.4 | 7.80 | 89.2 |
| 地表温度/℃ | 46.5 | 2.33 | 40.5 | 54.0 |
表2 1 km格网尺度地表温度、土地覆盖率和绿地破碎度特征
Table 2 Statistical description of land surface temperature, percent land cover and, fragmentation of greenspace at the 1 km grid scale
| 景观格局指标 | 平均值 | 标准差 | 最小值 | 最大值 |
|---|---|---|---|---|
| 绿地边界密度/(m∙hm−2) | 577 | 152 | 132 | 1096 |
| 绿化覆盖率/% | 42.5 | 15.2 | 8.14 | 82.6 |
| 裸地覆盖率/% | 4.38 | 6.53 | 0.00 | 45.3 |
| 水体覆盖率/% | 4.71 | 8.81 | 0.00 | 59.4 |
| 不透水面覆盖率/% | 48.4 | 17.4 | 7.80 | 89.2 |
| 地表温度/℃ | 46.5 | 2.33 | 40.5 | 54.0 |
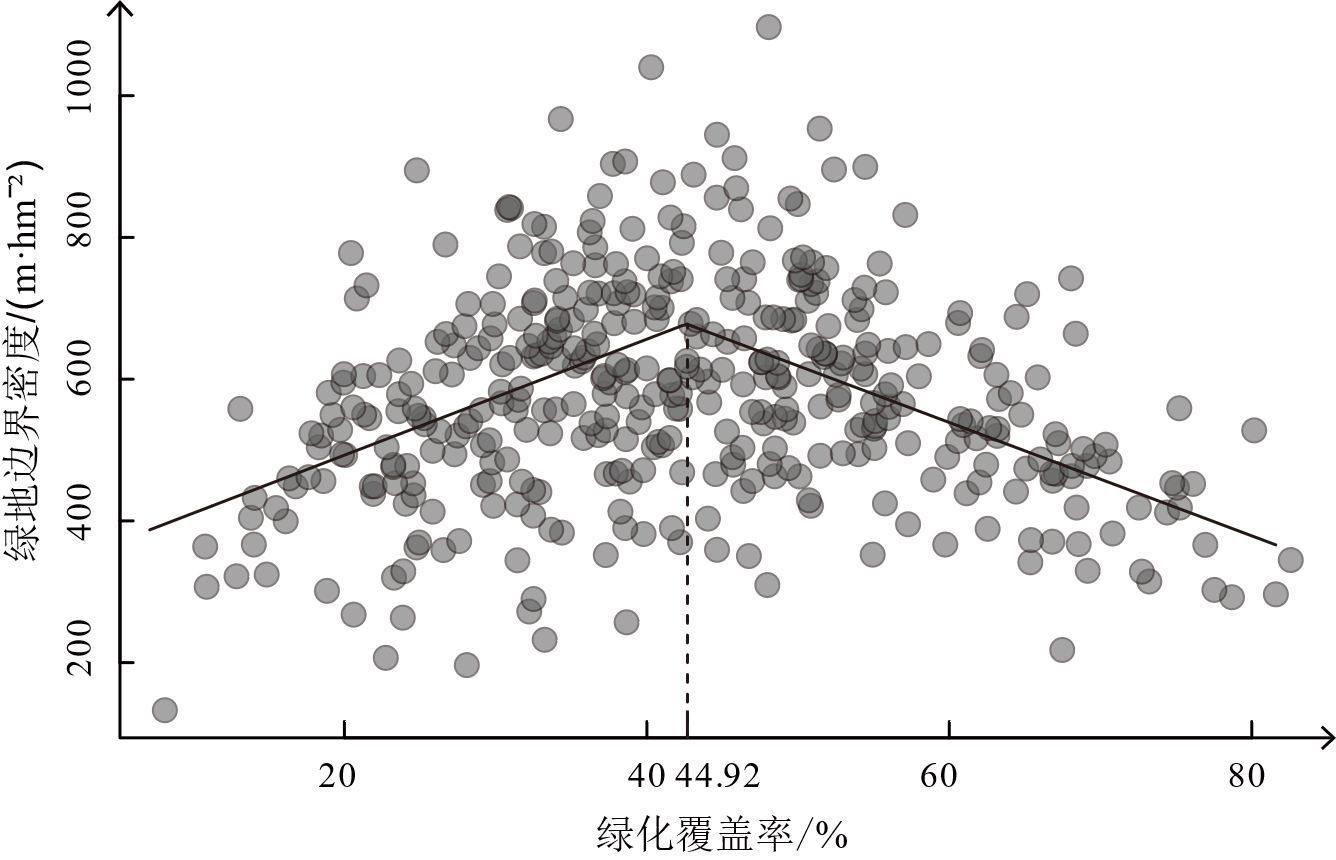
图2 绿地边界密度与绿化覆盖率分段线性回归
Figure 2 Piecewise linear regression of edge density of greenspace and percent green cover
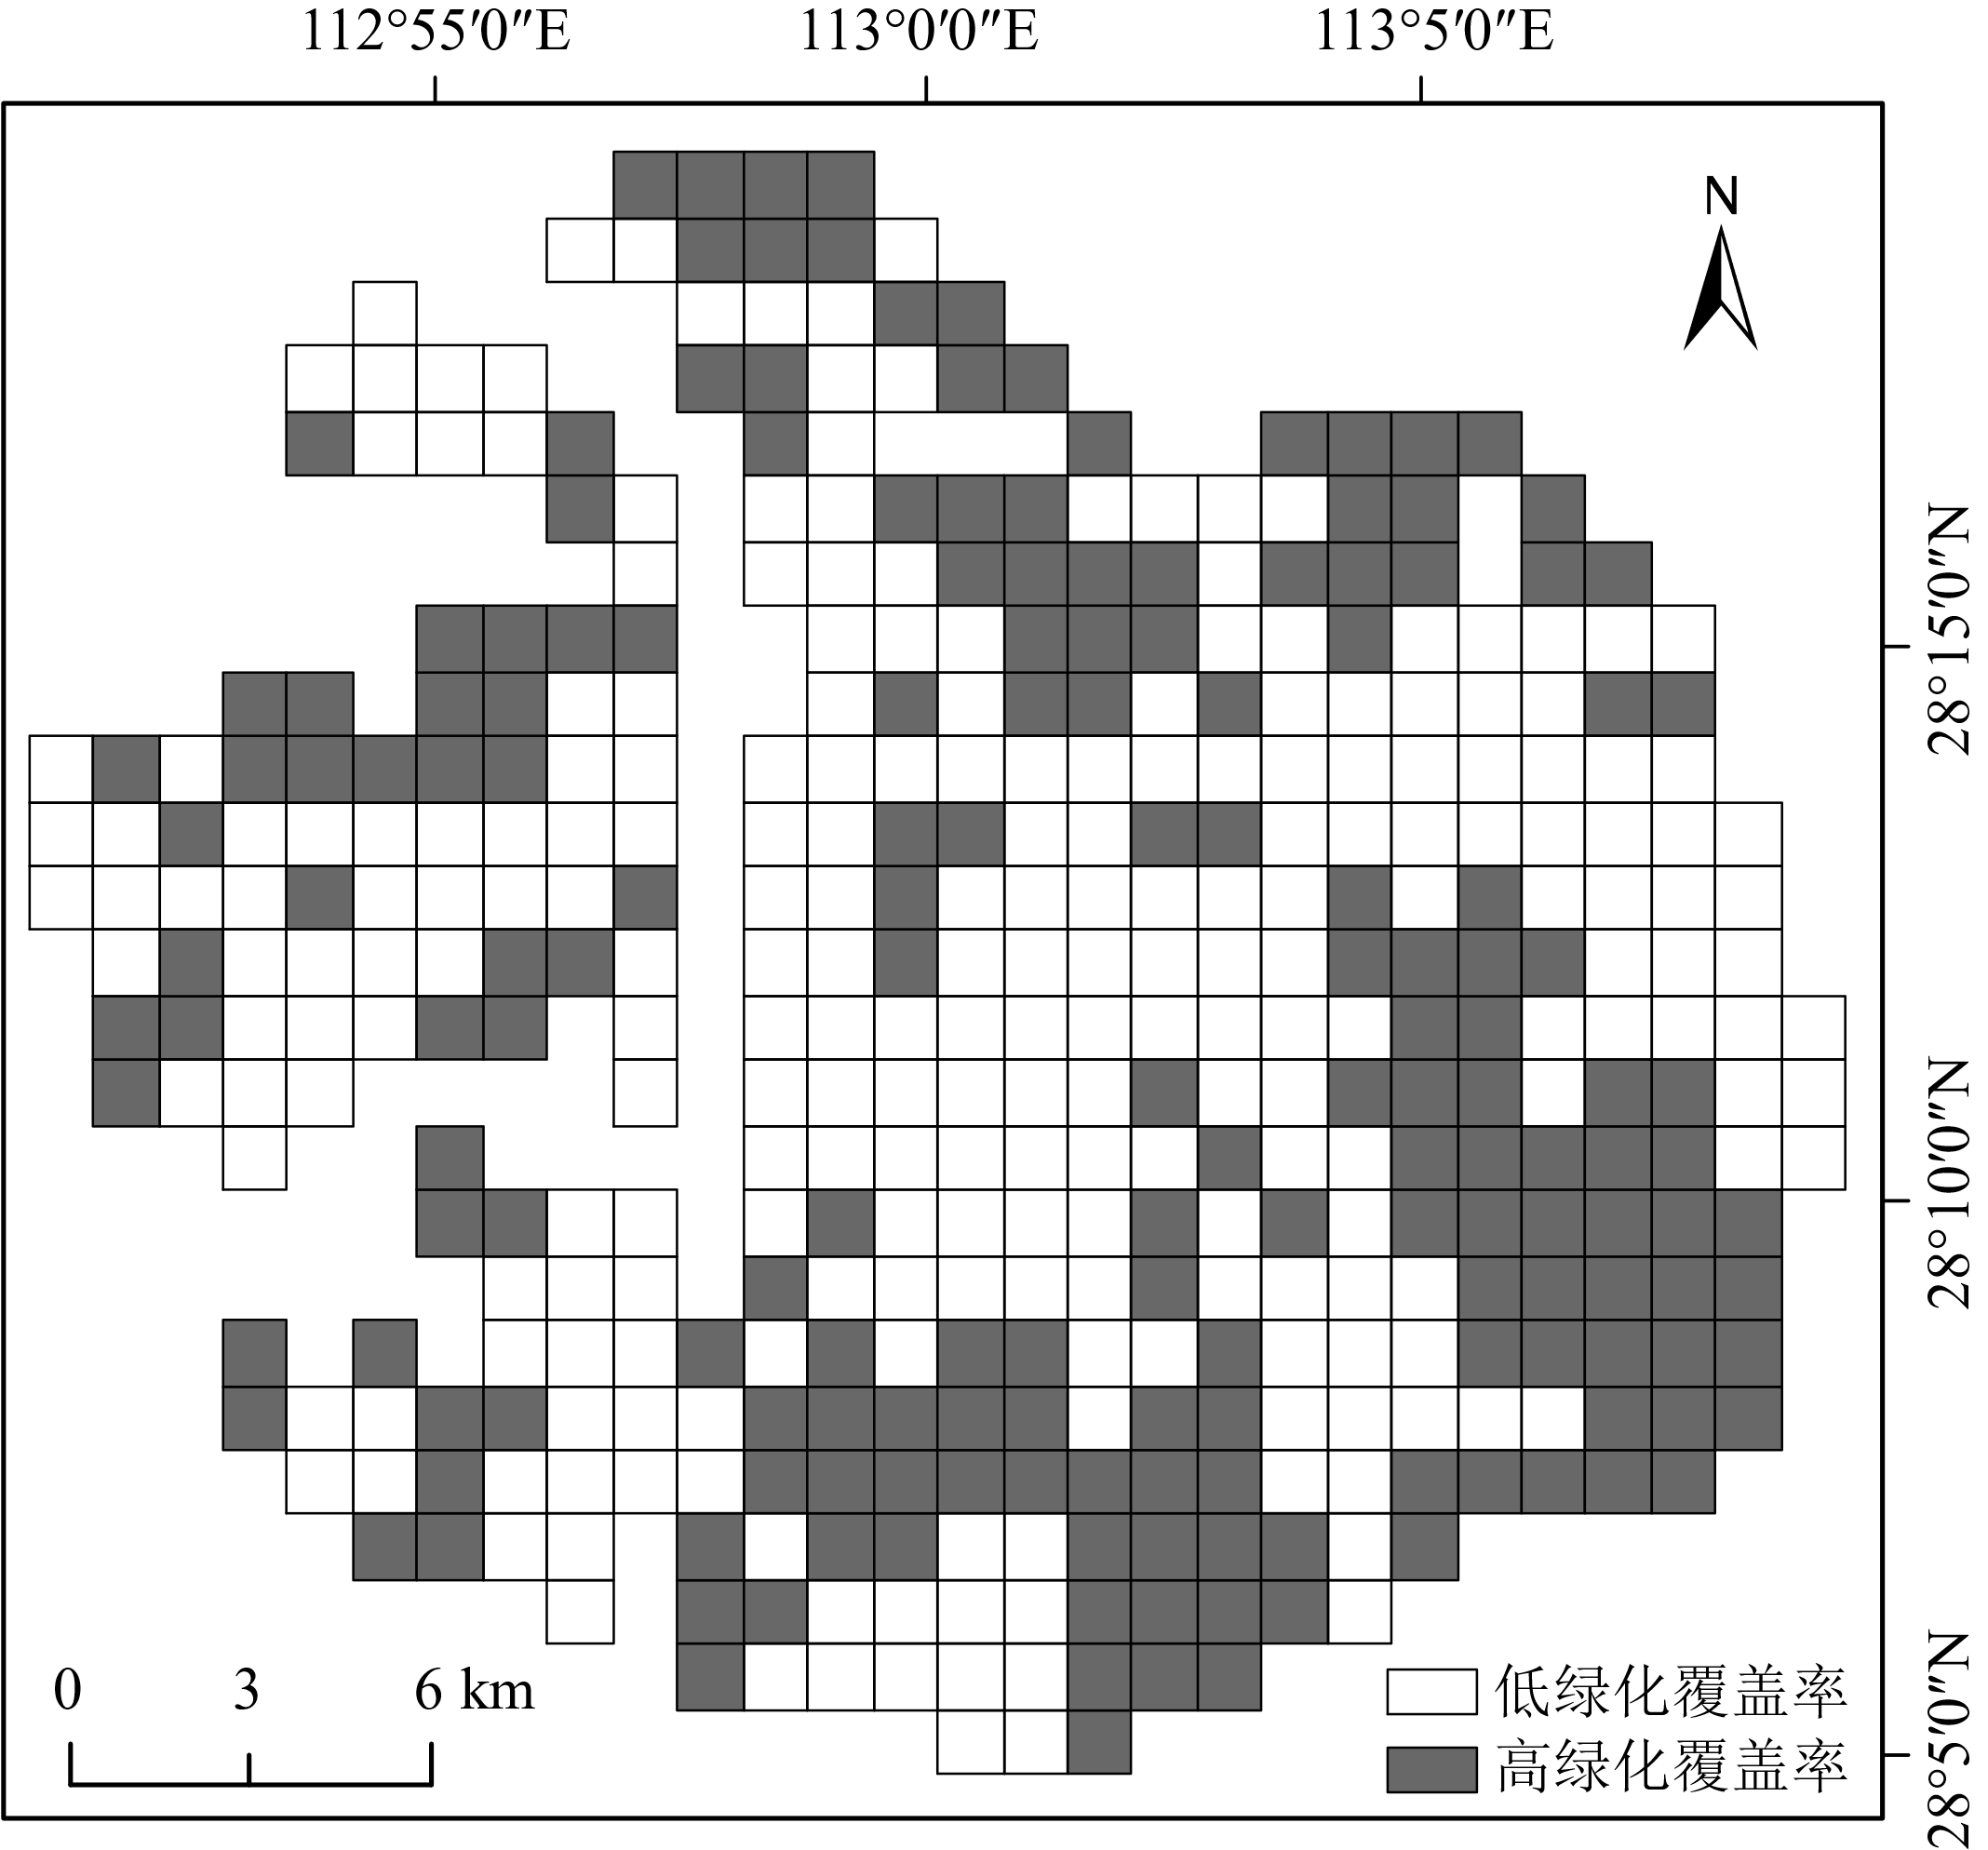
图3 高低绿化覆盖率1 km格网分布
Figure 3 1 km grids with high and low percent green cover
| 景观格局指标 | 研究区 (模型1) | 低绿化覆盖率 (模型2) | 高绿化覆盖率 (模型3) |
|---|---|---|---|
| 绿化覆盖率 | −0.693***1) | −0.368*** | −0.479*** |
| 裸地覆盖率 | −0.335*** | −0.450*** | −0.228*** |
| 水体覆盖率 | −0.521*** | −0.621*** | −0.562*** |
| 绿地边界密度 | −0.101**2) | −0.213*** | 0.0882 |
| 调整 r2 | 0.691 | 0.630 | 0.574 |
表3 不同绿化覆盖率下多元线性回归标准化回归系数和r2
Table 3 Results of multiple linear regression coefficients and r2 for regions with different percent green cover
| 景观格局指标 | 研究区 (模型1) | 低绿化覆盖率 (模型2) | 高绿化覆盖率 (模型3) |
|---|---|---|---|
| 绿化覆盖率 | −0.693***1) | −0.368*** | −0.479*** |
| 裸地覆盖率 | −0.335*** | −0.450*** | −0.228*** |
| 水体覆盖率 | −0.521*** | −0.621*** | −0.562*** |
| 绿地边界密度 | −0.101**2) | −0.213*** | 0.0882 |
| 调整 r2 | 0.691 | 0.630 | 0.574 |
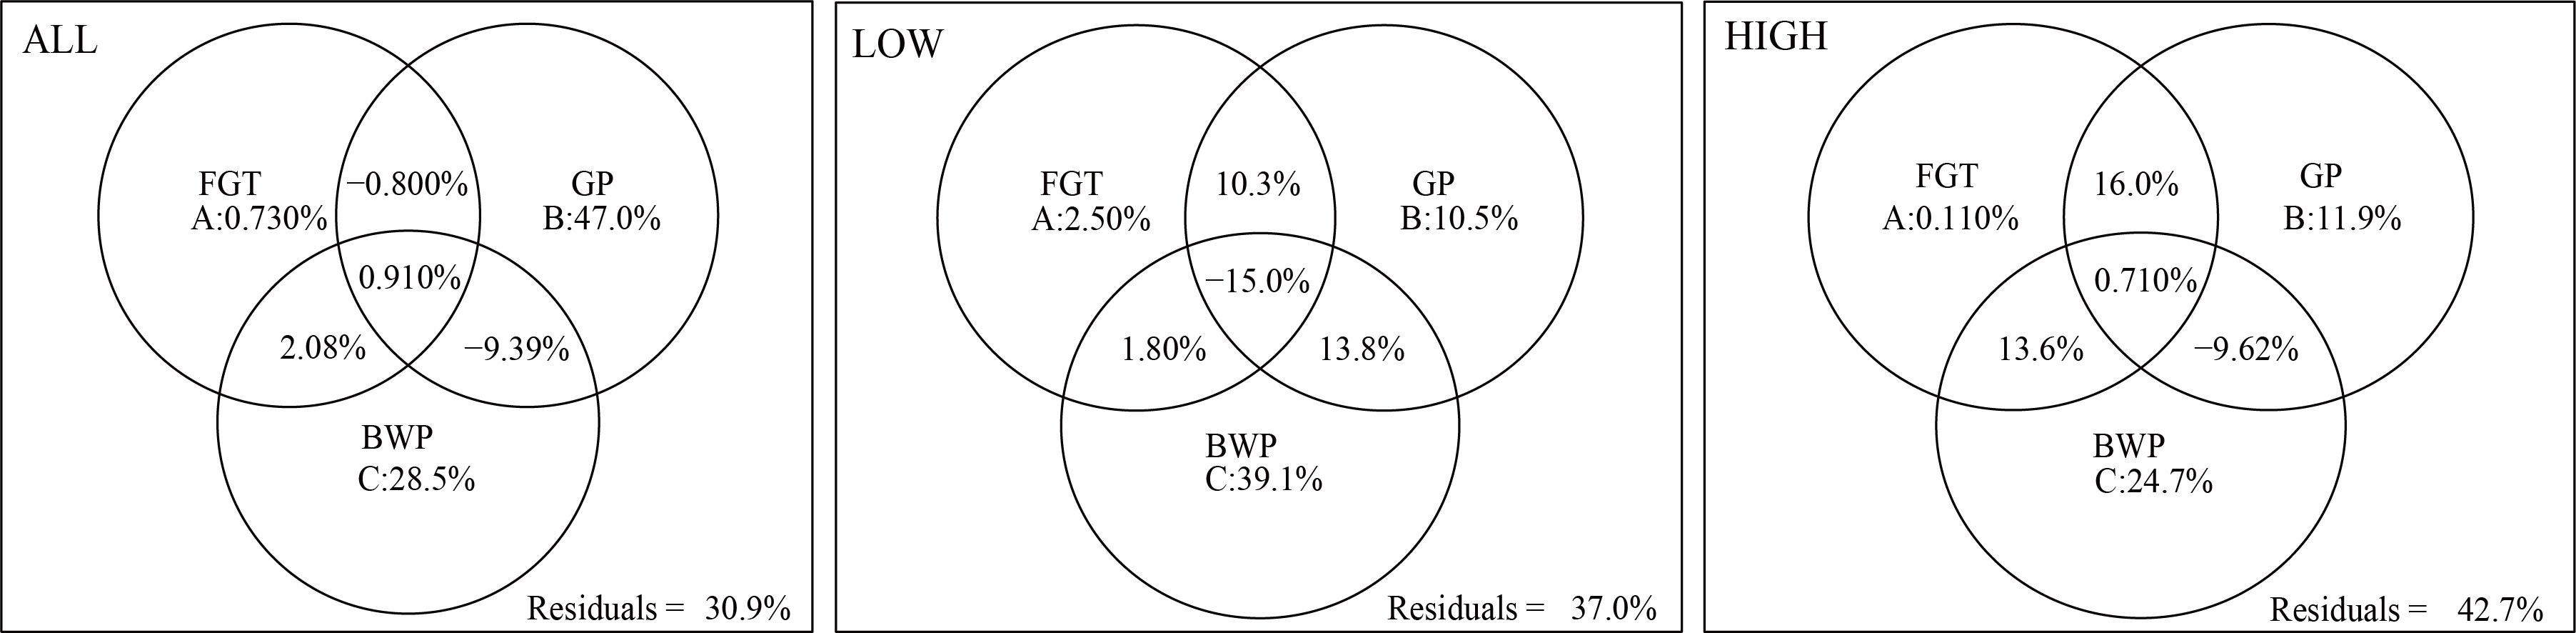
图4 不同绿化覆盖率下绿地破碎度(FGT)、绿化覆盖率(GP)和其他土地覆盖率(BWP)对地表温度变化的独立和交互作用 ALL:研究区;LOW:低绿化覆盖率区;HIGH:高绿化覆盖率区;A、B和C为独立贡献度;Residuals为不可解释度;其余为交互贡献度
Figure 4 Independent and joint effects of greenspace fragmentation, percent green cover, and percent area of other land cover on LST for regions of different percent green cover
| [1] |
ANDERSON M J, CRIBBLE N A, 1998. Partitioning the variation among spatial, temporal and environmental components in a multivariate data set[J]. Australian Journal of Ecology, 23(2): 158-167.
DOI URL |
| [2] |
ASGARIAN A, AMIRI B J, SAKIEH Y, 2014. Assessing the effect of green cover spatial patterns on urban land surface temperature using landscape metrics approach[J]. Urban Ecosystems, 18(1): 209-222.
DOI URL |
| [3] |
CAI Z W, FAN C, CHEN F L, et al., 2021. Pseudo-invariant feature-based linear regression model (PIF-LRM): An effective normalization method to evaluate urbanization impacts on Land Surface Temperature changes[J]. Atmosphere, 12(11): 1540.
DOI URL |
| [4] |
CROMPTON O, CORREA D, DUNCAN J, et al., 2021. Deforestation-induced surface warming is influenced by the fragmentation and spatial extent of forest loss in Maritime Southeast Asia[J]. Environmental Research Letters, 16(11): 114018.
DOI |
| [5] |
DENG Y W, GAN D X, TANG N, et al., 2022. Research on outdoor thermal comfort and activities in residential areas in subtropical China[J]. Atmosphere, 13(9): 1357.
DOI URL |
| [6] |
FAHRIG L, 2017. Ecological responses to habitat fragmentation perse[J]. Annual Review of Ecology, Evolution, and Systematics, 48(1): 1-23.
DOI URL |
| [7] |
FAN C, MYINT S W, ZHENG B J, 2015. Measuring the spatial arrangement of urban vegetation and its impacts on seasonal surface temperatures[J]. Progress in Physical Geography-Earth and Environment, 39(2): 199-219.
DOI URL |
| [8] |
GENG X L, YU Z W, ZHANG D, et al., 2022. The influence of local background climate on the dominant factors and threshold-size of the cooling effect of urban parks[J]. Science of The Total Environment, 823: 153806.
DOI URL |
| [9] |
GUO G H, WU Z F, CHEN Y B, 2019. Complex mechanisms linking land surface temperature to greenspace spatial patterns: Evidence from four southeastern Chinese cities[J]. Science of the Total Environment, 674: 77-87.
DOI URL |
| [10] |
HE C, ZHOU L G, YAO Y R, et al., 2021. Cooling effect of urban trees and its spatiotemporal characteristics: A comparative study[J]. Building and Environment, 204(5864): 108103.
DOI URL |
| [11] |
HERSE M R, WITH K A, BOYLE W A, 2020. Grassland fragmentation affects declining tallgrass prairie birds most where large amounts of grassland remain[J]. Landscape Ecology, 35(12): 2791-2804.
DOI |
| [12] | HU L, FAN C, CAI Z W, et al., 2023. Greening residential quarters in China: What are the roles of urban form, socioeconomic factors, and biophysical context?[J]. Urban Forestry & Urban Greening, 86: 128020. |
| [13] |
HUANG Q Y, XU C, HAASE D, et al., 2024. Heterogeneous effects of the availability and spatial configuration of urban green spaces on their cooling effects in China[J]. Environment International, 183: 108385.
DOI URL |
| [14] | KOWE P, MUTANGA O, ODINDI J, et al., 2021. Effect of landscape pattern and spatial configuration of vegetation patches on urban warming and cooling in Harare metropolitan city, Zimbabwe[J]. Giscience & Remote Sensing, 58(2): 261-280. |
| [15] |
LI W F, BAI Y, CHEN Q W, et al., 2014. Discrepant impacts of land use and land cover on urban heat islands: A case study of Shanghai, China[J]. Ecological Indicators, 47: 171-178.
DOI URL |
| [16] |
LI W F, CAO Q W, LANG K, et al., 2017. Linking potential heat source and sink to urban heat island: Heterogeneous effects of landscape pattern on land surface temperature[J]. The Science of The Total Environment, 586: 457-465.
DOI PMID |
| [17] |
LI X M, ZHOU W Q, OUYANG Z Y, et al., 2012. Spatial pattern of greenspace affects land surface temperature: evidence from the heavily urbanized Beijing metropolitan area, China[J]. Landscape Ecology, 27(6): 887-898.
DOI URL |
| [18] |
LI X M, ZHOU W Q, OUYANG Z Y, 2013. Relationship between land surface temperature and spatial pattern of greenspace: What are the effects of spatial resolution?[J]. Landscape and Urban Planning, 114: 1-8.
DOI URL |
| [19] |
LI X X, LI W W, MIDDEL A, et al., 2016. Remote sensing of the surface urban heat island and land architecture in Phoenix, Arizona: Combined effects of land composition and configuration and cadastral-demographic-economic factors[J]. Remote Sensing of Environment, 174: 233-243.
DOI URL |
| [20] | LI X M, ZHOU W Q, 2019. Optimizing urban greenspace spatial pattern to mitigate urban heat island effects: Extending understanding from local to the city scale[J]. Urban Forestry & Urban Greening, 41: 255-263. |
| [21] |
LI X M, ZHOU Y Y, YU S, et al., 2019. Urban heat island impacts on building energy consumption: A review of approaches and findings[J]. Energy, 174: 407-419.
DOI URL |
| [22] |
LIU K, SU H B, LI X K, et al., 2016. Quantifying spatial-temporal pattern of urban heat island in Beijing: An improved assessment using Land Surface Temperature (LST) time series observations from LANDSAT, MODIS, and Chinese New Satellite GaoFen-1[J]. Ieee Journal of Selected Topics in Applied Earth Observations and Remote Sensing, 9(5): 2028-2042.
DOI URL |
| [23] |
MAIMAITIYIMING M, GHULAM A, TIYIP T, et al., 2014. Effects of green space spatial pattern on land surface temperature: Implications for sustainable urban planning and climate change adaptation[J]. Isprs Journal of Photogrammetry and Remote Sensing, 89: 59-66.
DOI URL |
| [24] | MCGARIGAL K, CUSHMAN S A, ENE E, 2023. FRAGSTATS v4: Spatial pattern analysis program for categorical and continuous maps[R]. https://www.fragstats.org |
| [25] | NASTRAN M, KOBAL M, ELER K, 2019. Urban heat islands in relation to green land use in European cities[J]. Urban Forestry & Urban Greening, 37: 33-41. |
| [26] |
TOMS J D, LESPERANCE M L, 2003. Piecewise regression: A tool for identifying ecological thresholds[J]. Ecology, 84(8): 2034-2041.
DOI URL |
| [27] |
WANG J, ZHOU W Q, JIAO M, 2022. Location matters: planting urban trees in the right places improves cooling[J]. Frontiers in Ecology and the Environment, 20(3): 147-151.
DOI URL |
| [28] |
YANG J, WANG Y C, XIU C L, et al., 2020. Optimizing local climate zones to mitigate urban heat island effect in human settlements[J]. Journal of Cleaner Production, 275: 123767.
DOI URL |
| [29] |
YOKOHARI M, BROWN R D, KATO Y, et al., 1997. Effects of paddy fields on summertime air and surface temperatures in urban fringe areas of Tokyo, Japan[J]. Landscape and Urban Planning, 38(1): 1-11.
DOI URL |
| [30] |
YUAN B, ZHOU L, DANG X W, et al., 2021. Separate and combined effects of 3D building features and urban green space on land surface temperature[J]. Journal of Environmental Management, 295: 113116.
DOI URL |
| [31] |
ZHANG X Y, ZHONG T Y, FENG X Z, et al., 2009. Estimation of the relationship between vegetation patches and urban land surface temperature with remote sensing[J]. International Journal of Remote Sensing, 30(8): 2105-2118.
DOI URL |
| [32] |
ZHOU L, HU F, WANG B, et al., 2022. Relationship between urban landscape structure and land surface temperature: Spatial hierarchy and interaction effects[J]. Sustainable Cities and Society, 80: 103795.
DOI URL |
| [33] |
ZHOU W Q, HUANG G L, CADENASSO M L, 2011. Does spatial configuration matter? Understanding the effects of land cover pattern on land surface temperature in urban landscapes[J]. Landscape and Urban Planning, 102(1): 54-63.
DOI URL |
| [34] |
ZHOU W Q, WANG J, CADENASSO M L, 2017. Effects of the spatial configuration of trees on urban heat mitigation: A comparative study[J]. Remote Sensing of Environment, 195: 1-12.
DOI URL |
| [35] |
ZHOU W Q, HUANG G L, PICKETT S T A, et al., 2021. Urban tree canopy has greater cooling effects in socially vulnerable communities in the US[J]. One Earth, 4(12): 1764-1775.
DOI URL |
| [36] |
ZITER C D, PEDERSEN E J, KUCHARIK C J, et al., 2019. Scale-dependent interactions between tree canopy cover and impervious surfaces reduce daytime urban heat during summer[J]. Proceedings of the National Academy of Sciences of the United States of America, 116(15): 7575-7580.
DOI PMID |
| [37] | 奥勇, 王周航, 赵永华, 等, 2023. 不同城市化水平下绿地景观要素对温度的影响——以关中平原城市群为例[J]. 生态学杂志, 42(11): 2721-2729. |
| AO Y, WANG Z H, ZHAO Y F, et al., 2023. Effect of green space landscape elements on temperature under different urbanization levels: A case study of Gangzhou Plain urban agglomeration[J]. Chinese Journal of Ecology, 42(11): 2721-2729. | |
| [38] | 长沙市人民政府, 2022. 长沙概况. (2022-05-24) [2023-12-09]. http://www.changsha.gov.cn/. |
| Changsha Municipal People's Government 2022. General situation of Changsha[EB/OL]. (2022-05-24) [2023-12-09]. http://www.changsha.gov.cn/. | |
| [39] | 长沙市统计局, 2022. 2022年长沙统计年鉴. (2023-03-03) [2023-12-09]:23-53. http://tjj.changsha.gov.cn/tjxx/tjsj/tjnj/. |
| Changsha Bureau of Statistics, 2022. Changsha statistical yearbook 2022 [EB/OL]. (2023-03-03) [2023-12-09] 23-53. http://tjj.changsha.gov.cn/tjxx/tjsj/tjnj/. | |
| [40] | 陈辉, 古琳, 黎燕琼, 等, 2009. 成都市城市森林格局与热岛效应的关系[J]. 生态学报, 29(9): 4865-4874. |
| CHEN H, GU L, LI Y Q, et al., 2009. Analysis on relations between the pattern of urban forests and heat island effect in Chengdu[J]. Acta Ecologica Sinica, 29(9): 4865-4874. | |
| [41] |
蒋恬田, 杨纯, 廖炜, 等, 2023. 城市绿地景观格局影响地表温度的通径分析——以长沙市为例[J]. 生态环境学报, 32(1): 18-25.
DOI |
| JIANG T T, YANG C, LIAO W, et al., 2023. Path analysis of the urban greenspace landscape pattern impacts on Land Surface Temperature: A case study in Changsha[J]. Ecology and Environmental Sciences, 32(1): 18-25. | |
| [42] | 焦敏, 周伟奇, 钱雨果, 等, 2021. 斑块面积对城市绿地降温效应的影响研究进展[J]. 生态学报, 41(23): 9154-9163. |
| JIAO M, ZHOU W Q, QIAN Y G, et al., 2021. Influences of patch size on the cooling capacity of urban greenspace: Progresses, problems and perspectives[J]. Acta Ecologica Sinica, 41(23): 9154-9163. | |
| [43] | 潘金金, 任宗萍, 胥世斌, 等, 2023. 宁夏不同植被类型NDVI变化特征及其对气候的响应[J]. 地球科学与环境学报, 45(4): 819-832. |
| PAN J J, REN Z P, XU S B, et al., 2023. Variation characteristics of NDVI of different vegetation types in Ningxia, China and their responses to climate[J]. Journal of Earth Sciences and Environment, 45(4): 819-832. | |
| [44] |
王晓俊, 卫笑, 邹昊, 2020. 城市绿地空间格局对热岛效应的影响研究进展[J]. 生态环境学报, 29(9): 1904-1911.
DOI |
| WANG X J, WEI X, ZOU H, 2020. Research progress about the impact of urban green space spatial pattern on urban heat island[J]. Ecology and Environmental Sciences, 29(9): 1904-1911. | |
| [45] | 周志翔, 邵天一, 唐万鹏, 等, 2004. 城市绿地空间格局及其环境效应——以宜昌市中心城区为例[J]. 生态学报, 24(2): 186-192. |
| ZHOU Z X, SHAO T Y, TANG W P, et al., 2004. The different urban green-land spatial patterns and their environmental effects: A case of the central district of Yichang city, Hubei Province[J]. Acta Ecologica Sinica, 24(2): 186-192. |
| [1] | 杨梅焕, 姚明昊, 王涛, 李雅雯, 邓彦昊, 赵滢滢, 张政亮. 基于局地气候区的西安市城市热环境变化及其影响因素分析[J]. 生态环境学报, 2023, 32(9): 1644-1653. |
| [2] | 蒋恬田, 杨纯, 廖炜, 胡力, 刘欢瑶, 任勃, 李小马. 城市绿地景观格局影响地表温度的通径分析——以长沙市为例[J]. 生态环境学报, 2023, 32(1): 18-25. |
| 阅读次数 | ||||||
|
全文 |
|
|||||
|
摘要 |
|
|||||