生态环境学报 ›› 2023, Vol. 32 ›› Issue (9): 1644-1653.DOI: 10.16258/j.cnki.1674-5906.2023.09.011
杨梅焕1( ), 姚明昊1, 王涛1,2, 李雅雯1, 邓彦昊1, 赵滢滢1, 张政亮1
收稿日期:2023-07-19
出版日期:2023-09-18
发布日期:2023-12-11
作者简介:杨梅焕(1982年生),女,副教授,博士,主要从事生态系统研究。E-mail: ymh8307024@163.com
基金资助:
YANG Meihuan1(), YAO Minghao1, WANG Tao1,2, LI Yawen1, DENG Yanhao1, ZHAO Yingying1, ZHANG Zhengliang1
Received:2023-07-19
Online:2023-09-18
Published:2023-12-11
摘要:
快速城市化过程引起的城市热环境变化,对人类健康和城市可持续发展产生了重要影响。通过科学规划与管理改善城市热环境对于提高城市宜居性具有重要意义。以西安市主城区为例,基于2019-2022年9期70 m分辨率的ECOSTRESS数据,结合局地气候区(Local Climate Zone,LCZ)分类,利用相关性分析及分区统计等方法,对城市热环境变化及其影响因素进行了分析,可为城市科学规划与管理提供决策依据。研究结果表明,1)研究区以建筑类型(LCZ1-7)局地气候区为主,占区域总面积的72.94%。其中紧凑型中低层建筑(LCZ2-3)局地气候区分布在城市一环路以内,开敞型建筑类型(LCZ4-7)局地气候区分布在城市一环和绕城高速之间,自然类型(LCZA,LCZB)局地气候区和大型低层和硬地面(LCZ7)局地气候区分布于绕城高速周边。2)日间,紧凑型建筑类型(LCZ3)局地气候区地表温度最高,水体(LCZA)地表温度最低;夜间,水体(LCZA)地表温度最高,植被(LCZB)地表温度最低。紧凑型建筑类型(LCZ1-3)地表温度高于开敞型建筑类型(LCZ4-6),且日间地表温度表现为紧凑型高层 (LCZ1)<紧凑型中层 (LCZ2)<紧凑型低层(LCZ3),夜间反之。3)日间,地表温度高值区主要分布于以紧凑型建筑类型(LCZ1-3)局地气候区为主的城市二环路内,地表温度低值区分布于研究区东北部、研究区东南部和二环西北部边缘区域的植被(LCZA)和水体(LCZB)局地气候区内;夜间地表温度高值区分布于研究区东北部水体(LCZB)和绕城高速内的建筑类型(LCZ1-6)区域,地表温度低值区与日间相似。4)地表温度与NDVI呈显著负相关,与人口和夜间灯光呈显著正相关。研究认为西安市未来建筑类型应多以开敞型建筑为主,并在开敞型建筑类型(LCZ4-7)局地气候区中加强城市绿化,同时,在紧凑型建筑类型(LCZ1-3)局地气候区中建设通风廊道,可起到改善城市热环境的作用。
中图分类号:
杨梅焕, 姚明昊, 王涛, 李雅雯, 邓彦昊, 赵滢滢, 张政亮. 基于局地气候区的西安市城市热环境变化及其影响因素分析[J]. 生态环境学报, 2023, 32(9): 1644-1653.
YANG Meihuan, YAO Minghao, WANG Tao, LI Yawen, DENG Yanhao, ZHAO Yingying, ZHANG Zhengliang. Analysis of Urban Thermal Environment Change and Its Influencing Factors in Xi’an Based on Local Climate Zone[J]. Ecology and Environment, 2023, 32(9): 1644-1653.
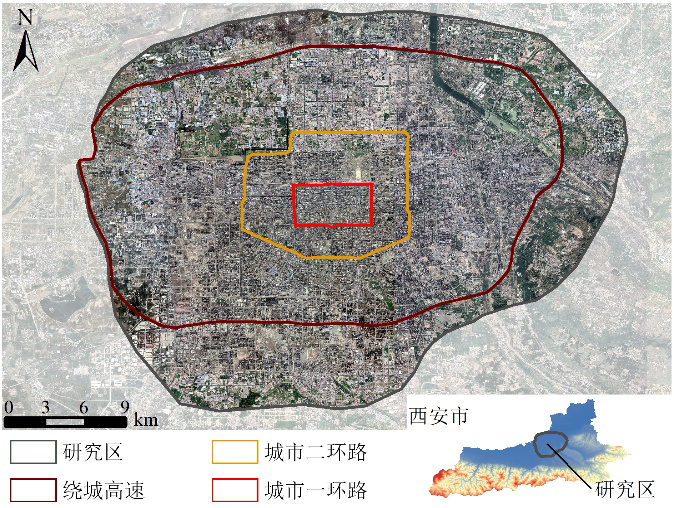
图1 研究区位
Figure 1 The studied area
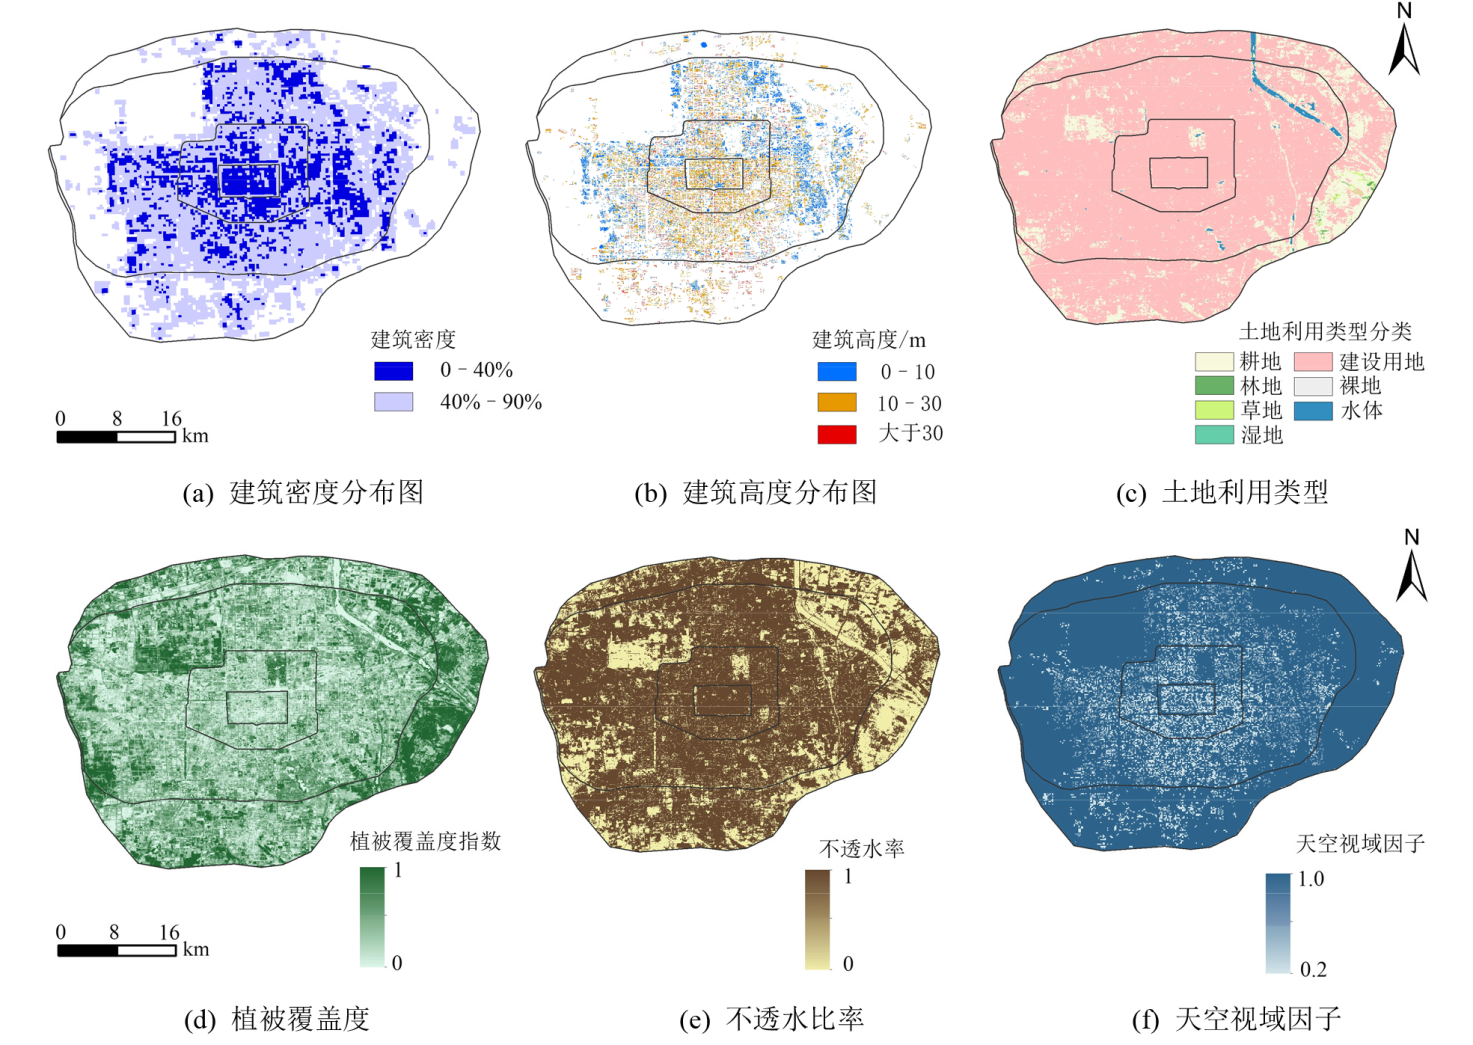
图2 局地气候区计算指标空间分布
Figure 2 Spatial distribution of indicators of Local Climate Zones
| 局地气候分区 | 建筑高度/ m | 建筑密度/ % | 天空视域因子 | 不透水 比率 | 植被覆盖度/% | 名称 |
|---|---|---|---|---|---|---|
| LCZ1 | ≥30 | 40-60 | 0.2-0.4 | 0.4-0.9 | <10 | 紧凑型高层 |
| LCZ2 | 10-30 | 40-60 | 0.3-0.6 | 0.4-0.9 | <10 | 紧凑型中层 |
| LCZ3 | 3-10 | 40-60 | 0.2-0.6 | 0.4-0.9 | <10 | 紧凑型低层 |
| LCZ4 | ≥30 | 20-40 | 0.5-0.7 | 0.4-0.9 | 10-30 | 开敞型高层 |
| LCZ5 | 10-30 | 20-40 | 0.5-0.8 | 0.4-0.9 | 10-30 | 开敞型中层 |
| LCZ6 | 3-10 | 20-40 | 0.6-0.9 | 0.4-0.9 | 10-30 | 开敞型低层 |
| LCZ7 | <3 | 60-90 | >0.9 | >0.8 | <10 | 大型低层和硬地面 |
| LCZA | - | - | 0.4-0.9 | <0.1 | ≥30 | 植被 |
| LCZB | - | - | >0.9 | <0.1 | - | 水体 |
表1 局地气候区参数
Table 1 Parameters of local climate zones
| 局地气候分区 | 建筑高度/ m | 建筑密度/ % | 天空视域因子 | 不透水 比率 | 植被覆盖度/% | 名称 |
|---|---|---|---|---|---|---|
| LCZ1 | ≥30 | 40-60 | 0.2-0.4 | 0.4-0.9 | <10 | 紧凑型高层 |
| LCZ2 | 10-30 | 40-60 | 0.3-0.6 | 0.4-0.9 | <10 | 紧凑型中层 |
| LCZ3 | 3-10 | 40-60 | 0.2-0.6 | 0.4-0.9 | <10 | 紧凑型低层 |
| LCZ4 | ≥30 | 20-40 | 0.5-0.7 | 0.4-0.9 | 10-30 | 开敞型高层 |
| LCZ5 | 10-30 | 20-40 | 0.5-0.8 | 0.4-0.9 | 10-30 | 开敞型中层 |
| LCZ6 | 3-10 | 20-40 | 0.6-0.9 | 0.4-0.9 | 10-30 | 开敞型低层 |
| LCZ7 | <3 | 60-90 | >0.9 | >0.8 | <10 | 大型低层和硬地面 |
| LCZA | - | - | 0.4-0.9 | <0.1 | ≥30 | 植被 |
| LCZB | - | - | >0.9 | <0.1 | - | 水体 |
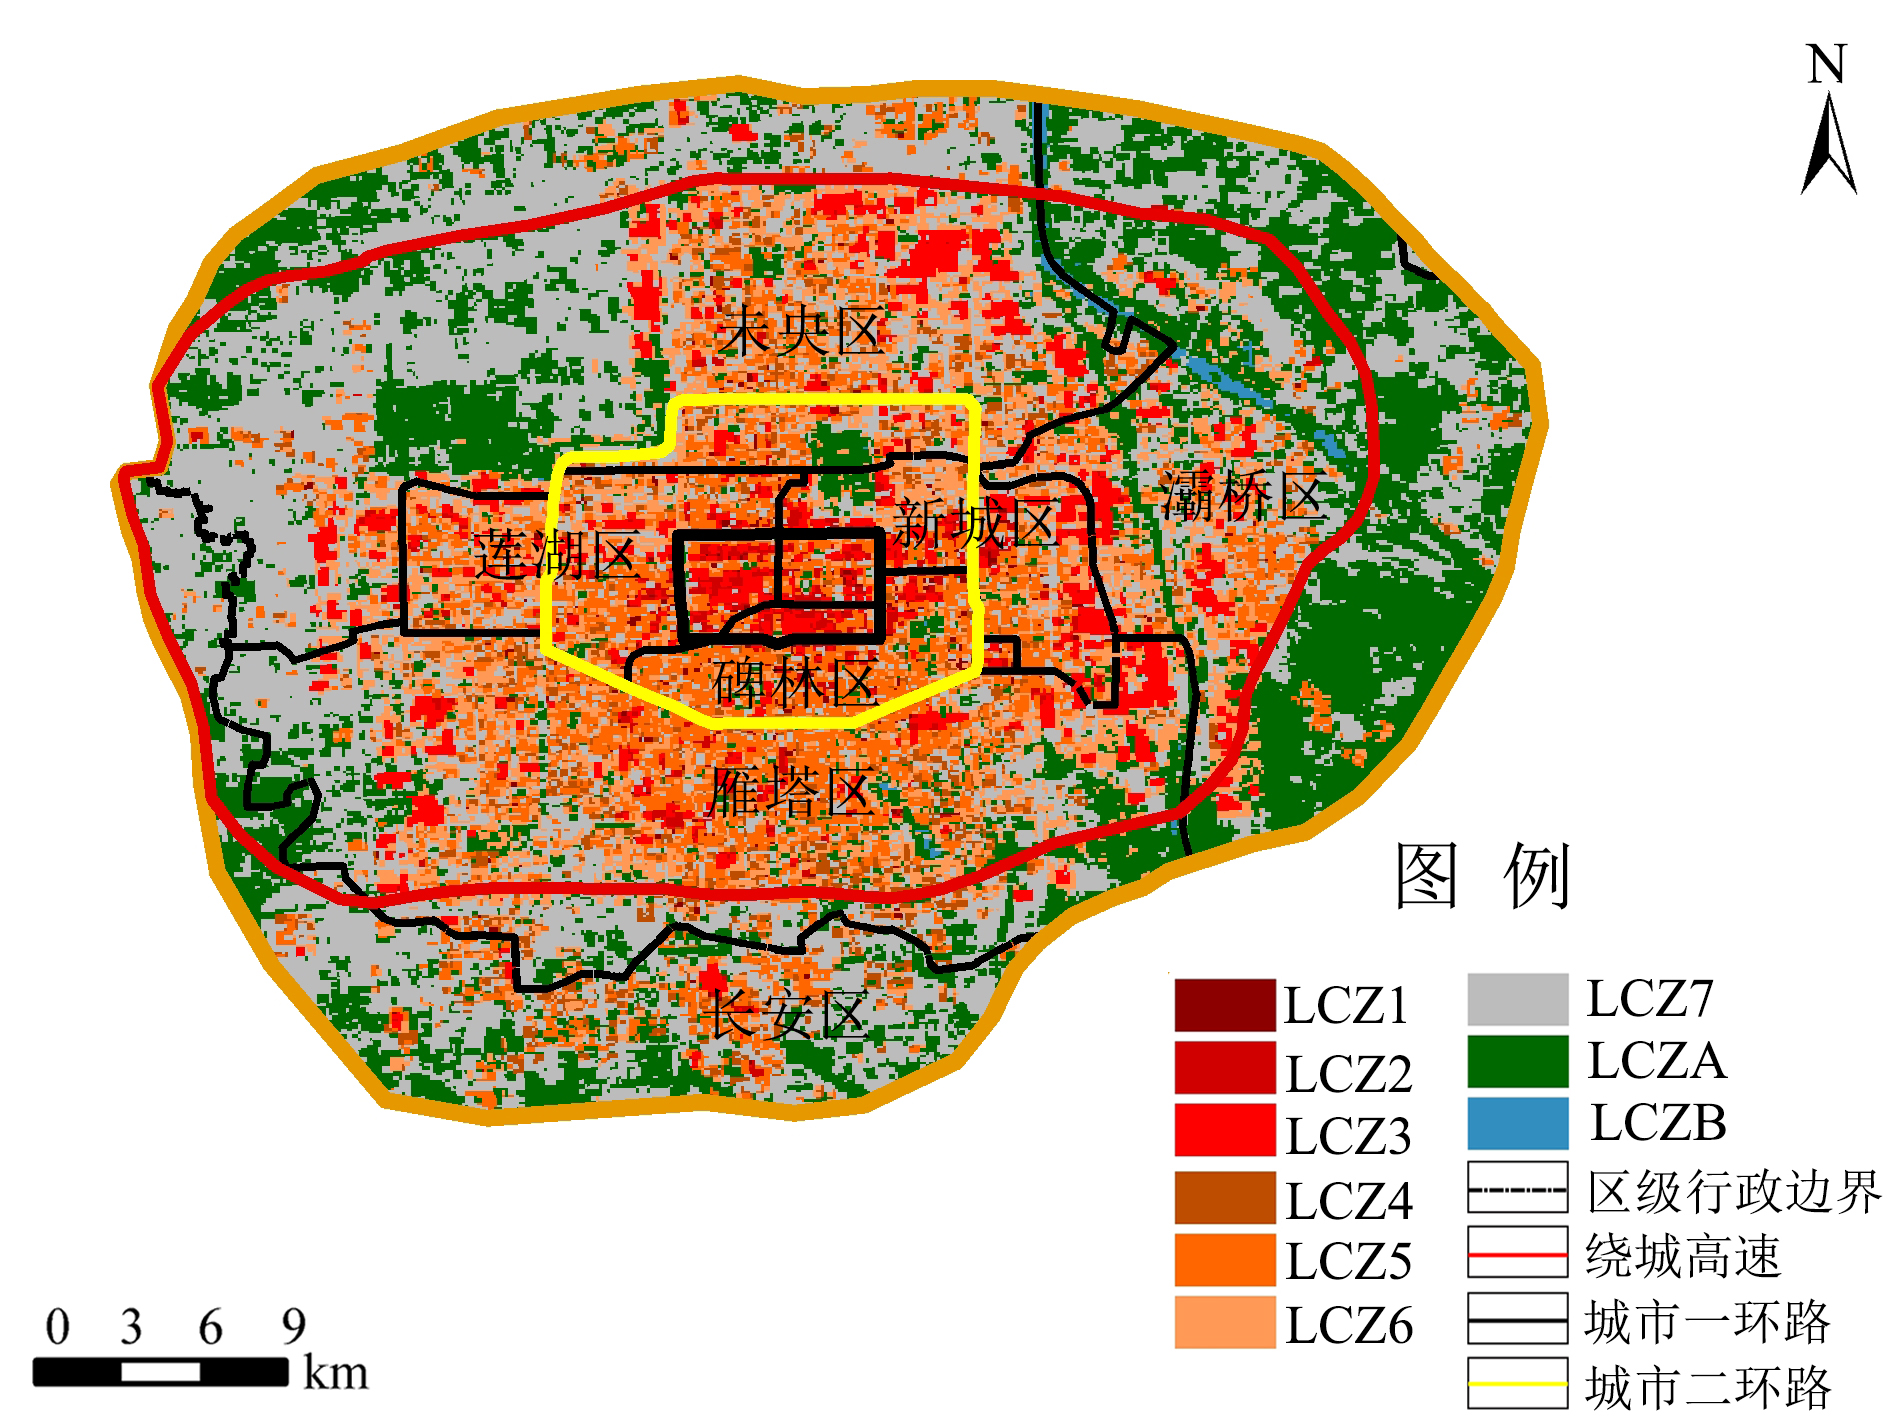
图3 局地气候区空间分布 LCZ1—紧凑型高层;LCZ2—紧凑型中层;LCZ3—紧凑型低层;LCZ4—开敞型高层;LCZ5—开敞型中层;LCZ6—开敞型低层;LCZ7—大型低层和硬地面;LCZA—植被;LCZB—水体。下同
Figure 3 Spatial distribution of Local Climate Zones
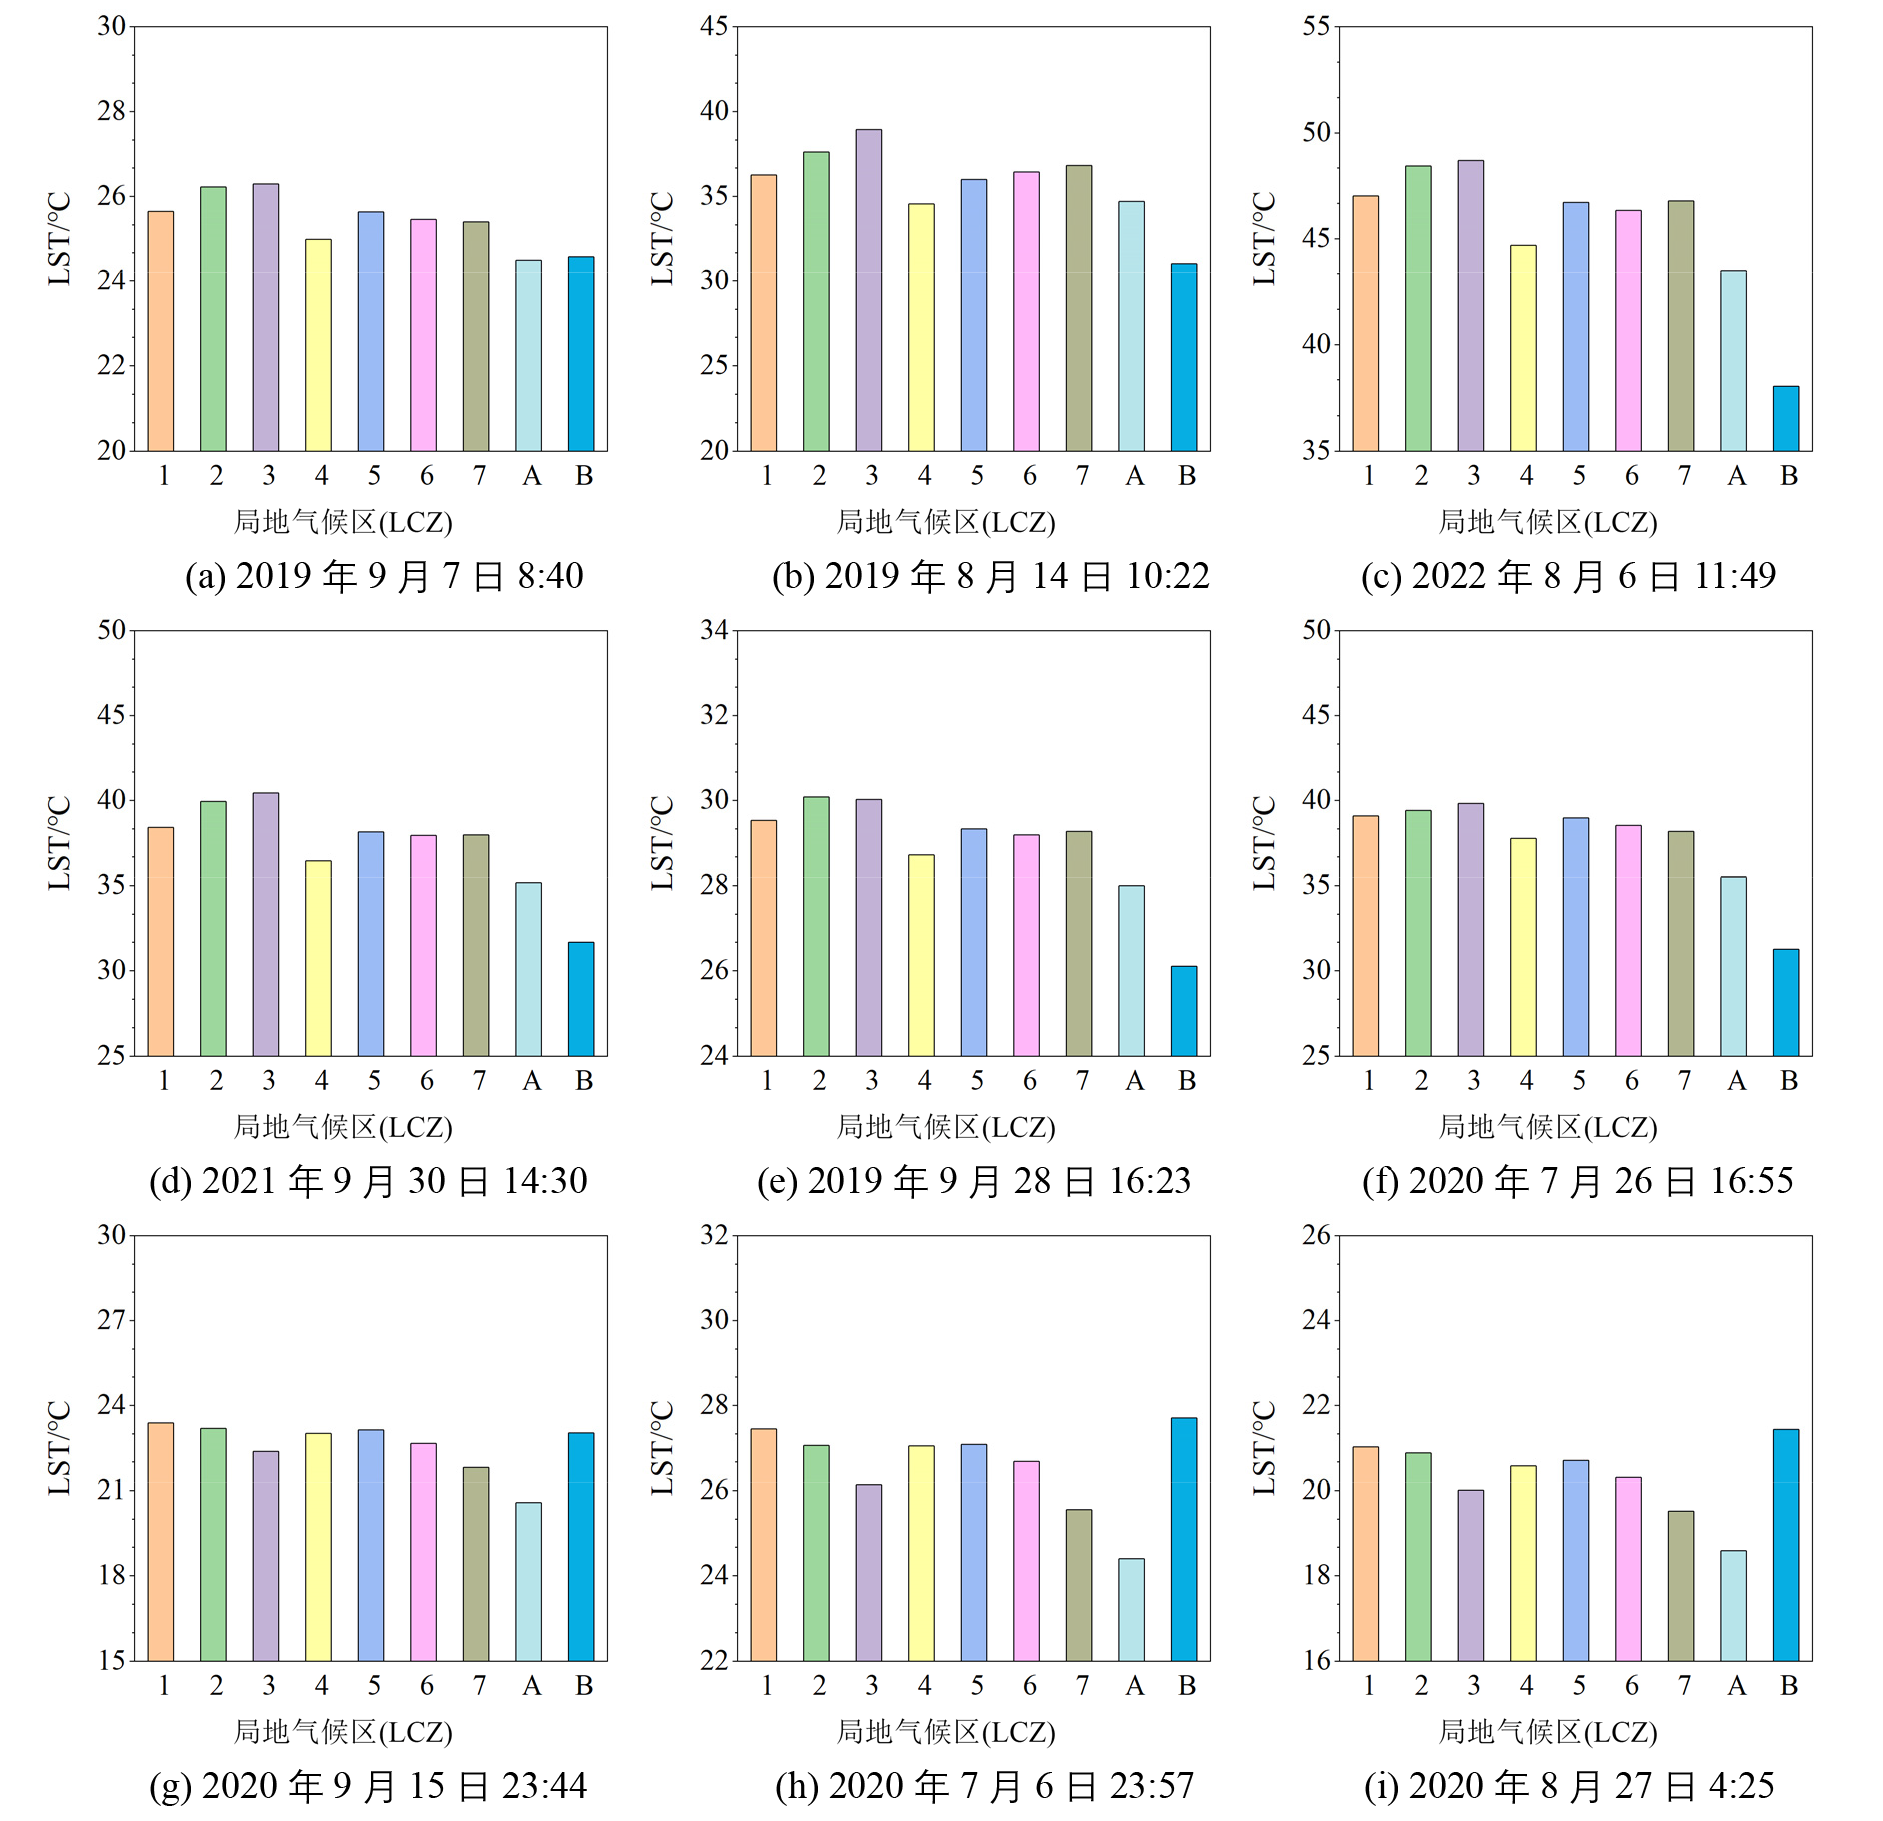
图4 不同时刻局地气候区地表温度统计结果
Figure 4 Statistical analysis of land surface temperature in different local climate zones at different time intervals

图5 局地气候区内地表温度空间分布
Figure 5 Spatial Distribution of Land Surface Temperature within Different Local Climate Zones

图6 城市地表温度控制分区
Figure 6 Urban surface temperature control zoning map
| 时间 | NDVI | 人口 | 夜间灯光 |
|---|---|---|---|
| 8:40 | −0.859** 1) | 0.832** | 0.601 |
| 10:22 | −0.698* | 0.564 | 0.221 |
| 11:49 | −0.898** | 0.803** | 0.563 |
| 14:30 | −0.885** | 0.806** | 0.535 |
| 16:23 | −0.909** | 0.809** | 0.620* |
| 16:55 | −0.947** | 0.885** | 0.755** |
| 23:44 | −0.748* | 0.737** | 0.897** |
| 23:57 | −0.732* 2) | 0.712* | 0.889** |
| 4:25 | −0.727* | 0.757** | 0.922** |
表2 地表温度与NDVI、人口和夜间灯光的相关系数
Table 2 Correlation coefficients between land surface temperature and NDVI, Population, and nighttime lights
| 时间 | NDVI | 人口 | 夜间灯光 |
|---|---|---|---|
| 8:40 | −0.859** 1) | 0.832** | 0.601 |
| 10:22 | −0.698* | 0.564 | 0.221 |
| 11:49 | −0.898** | 0.803** | 0.563 |
| 14:30 | −0.885** | 0.806** | 0.535 |
| 16:23 | −0.909** | 0.809** | 0.620* |
| 16:55 | −0.947** | 0.885** | 0.755** |
| 23:44 | −0.748* | 0.737** | 0.897** |
| 23:57 | −0.732* 2) | 0.712* | 0.889** |
| 4:25 | −0.727* | 0.757** | 0.922** |
| [1] |
BECHTEL B, ALEXANDER P J, BÖHNER J, et al., 2015. Mapping local climate zones for a worldwide database of the form and function of cities[J]. ISPRS International Journal of Geo-Information, 4(1): 199-219.
DOI URL |
| [2] |
BECHTEL B, DEMUZERE M, MILLS G, et al., 2019. SUHI analysis using local climate zones: Comparison of 50 cities[J]. Urban Climate, 28: 100451.
DOI URL |
| [3] |
CHANG Y, XIAO J F, LI X X, et al., 2021. Exploring diurnal thermal variations in urban local climate zones with ECOSTRESS land surface temperature data[J]. Remote Sensing of Environment, 263: 112544.
DOI URL |
| [4] |
CHEN C M, BAGAN H, XIE X, et al., 2021. Combination of sentinel-2 and PALSAR-2 for local climate zone classification: A case study of Nanchang, China[J]. Remote Sensing, 13(10): 1902.
DOI URL |
| [5] |
CHEN Y P, ZHENG B H, HU Y Z, 2020. Mapping local climate zones using ArcGIS-based method and exploring land surface temperature characteristics in Chenzhou, China[J]. Sustainability, 12(7): 2974.
DOI URL |
| [6] |
CUI S Y, WANG X H, YANG X, et al., 2022. Mapping local climate zones in the urban environment: The optimal combination of data source and classifier[J]. Sensors, 22(17): 6407.
DOI URL |
| [7] |
DEMUZERE M, KITTNER J, MARTILLI A, et al., 2022. A global map of local climate zones to support earth system modelling and urban-scale environmental science[J]. Earth System Science Data, 14(8): 3835-3873.
DOI URL |
| [8] | FISHER J B, LEE B, PURDY A J, et al., 2020. ECOSTRESS: NASA’s next generation mission to measure evapotranspiration from the international space station[J]. Water Resources Research, 56(4): e2019WR026058. |
| [9] | GELETIČ J, LEHNERT M, 2016. GIS-based delineation of local climate zones: The case of medium-sized Central European cities[J]. Moravian Geographical Reports, 24(3): 2-12. |
| [10] |
HOOK S J, CAWSE-N K, BARSI J, et al., 2020. In-flight validation of the ECOSTRESS, Landsats 7 and 8 thermal infrared spectral channels using the Lake Tahoe CA/NV and Salton Sea CA automated validation sites[J]. IEEE Transactions on Geoscience and Remote Sensing, 58(2): 1294-1302.
DOI URL |
| [11] |
HULLEY G C, HOOK S J, 2010. Generating consistent land surface temperature and emissivity products between ASTER and MODIS data for earth science research[J]. IEEE Transactions on Geoscience and Remote Sensing, 49(4): 1304-1315.
DOI URL |
| [12] |
LECONTE F, BOUYER J, CLAVERIE R, et al., 2015. Using Local Climate Zone scheme for UHI assessment: Evaluation of the method using mobile measurements[J]. Building and Environment, 83: 39-49.
DOI URL |
| [13] |
MIDDEL A, TURNER V K, SCHNEIDER F A, et al., 2020. Solar reflective pavements—A policy panacea to heat mitigation?[J]. Environmental Research Letters, 15(6): 064016.
DOI |
| [14] |
PENG S S, PIAO S L, CIAIS P, et al., 2012. Surface urban heat island across 419 global big cities[J]. Environmental Science & Technology, 46(2): 696-703.
DOI URL |
| [15] |
SANTAMOURIS M, 2013. Using cool pavements as a mitigation strategy to fight urban heat island: A review of the actual developments[J]. Renewable and Sustainable Energy Reviews, 26: 224-240.
DOI URL |
| [16] |
SHI Z P, YANG J, WANG L E, et al., 2022. Exploring seasonal diurnal surface temperature variation in cities based on ECOSTRESS data: A local climate zone perspective[J]. Frontiers in Public Health, 10: 1001344.
DOI URL |
| [17] |
STEWART I D, 2011. A systematic review and scientific critique of methodology in modern urban heat island literature[J]. International Journal of Climatology, 31(2): 200-217.
DOI URL |
| [18] |
STEWART I D, OKE T R, 2012. Local climate zones for urban temperature studies[J]. Bulletin of the American Meteorological Society, 93(12): 1879-1900.
DOI URL |
| [19] |
TORREGGIANI D, DALL’ARA E, TASSINARI P, 2012. The urban nature of agriculture: Bidirectional trends between city and countryside[J]. Cities, 29(6): 412-416.
DOI URL |
| [20] |
ULPIANI G, 2021. On the linkage between urban heat island and urban pollution island: Three-decade literature review towards a conceptual framework[J]. Science of The Total Environment, 751: 141727.
DOI URL |
| [21] |
WANG C Y, MIDDEL A, MYINT S W, et al., 2018. Assessing local climate zones in arid cities: The case of Phoenix, Arizona and Las Vegas, Nevada[J]. ISPRS Journal of Photogrammetry and Remote Sensing, 141: 59-71.
DOI URL |
| [22] |
ZHOU W, YU W D, ZHANG Z Y, et al., 2023. How can urban green spaces be planned to mitigate urban heat island effect under different climatic backgrounds? A threshold-based perspective[J]. The Science of The Total Environment, 890: 164422.
DOI URL |
| [23] |
ZHANG X, LIU L Y, WU C S, et al., 2020. Development of a global 30 m impervious surface map using multisource and multitemporal remote sensing datasets with the Google Earth Engine platform[J]. Earth System Science Data, 12(3): 1625-1648.
DOI URL |
| [24] | 陈利顶, 孙然好, 刘海莲, 2013. 城市景观格局演变的生态环境效应研究进展[J]. 生态学报, 33(4): 1042-1050. |
|
CHEN L D, SUN R H, LIU H L, 2013. Research progress on ecological and environmental effects of urban landscape pattern evolution[J]. Acta Ecologica Sinica, 33(4): 1042-1050.
DOI URL |
|
| [25] | 程雨婷, 刘昭华, 鹿琳琳, 等, 2020. 一带一路沿海超大城市热岛时空特征遥感分析[J]. 遥感技术与应用, 35(5): 1197-1205. |
| CHENG Y T, LIU Z H, LU L L, et al., 2020. Remote sensing analysis of spatiotemporal characteristics of heat island in coastal megacities along the Belt and Road[J]. Remote Sensing Technology and A-pplication, 35(5): 1197-1205. | |
| [26] | 崔耀辉, 华乃馨, 张丹, 2023. 开封市城区公园对城市热岛效应的缓解效果研究[J]. 黄河水利职业技术学院学报, 35(2): 25-29, 43. |
| CUI Y H, HUAN N X, ZHANG D, 2023. Study on the mitigation effect of urban parks on urban heat island effect in Kaifeng City[J]. Journal of Yellow River Conservancy Technical College, 35(2): 25-29, 43. | |
| [27] | 高鹏, 刘桂馨, 陈吉科, 等, 2022. 局地气候区与昼夜城市热岛效应的耦合关系研究[J]. 南京信息工程大学学报(自然科学版), 14(3): 267-276. |
| GAO P, LIU G X, CHEN J K, et al., 2022. Study on the coupling relationship between local climate zone and diurnal urban heat island effect[J]. Journal of Nanjing University of Information Science and Technology (Natural Science Edition), 14(3): 267-276. | |
| [28] |
胡楠林, 任志彬, 董禹麟, 等, 2022. 中国城市群热岛效应时空演变及其影响因素分析[J]. 地理科学, 42(9): 1534-1545.
DOI |
| HU N L, REN Z B, DONG Y L, et al., 2022. Spatial-temporal evolution of heat island effect in urban agglomeration in China and its influencing factors[J]. Scientia Geographica, 42(9): 1534-1545. | |
| [29] |
江斯达, 占文凤, 杨俊, 等, 2020. 局地气候分区框架下城市热岛时空分异特征研究进展[J]. 地理学报, 75(9): 1860-1878.
DOI |
|
JIANG S D, ZHAN W F, YANG J, et al., 2020. Research progress on spatiotemporal differentiation characteristics of urban heat islands under the framework of local climate zoning[J]. Acta Geographica Sinica, 75(9): 1860-1878.
DOI |
|
| [30] | 李佳雯, 杨彬云, 张曼玉, 等, 2020. 基于卫星遥感的长江三角洲地表热环境人口暴露空间特征[J]. 气象科技, 48(4): 590-599. |
| LI J W, YANG B Y, ZHANG M Y, et al., 2020. Spatial characteristics of population exposure in surface thermal environment in Yangtze River Delta based on satellite remote sensing[J]. Meteorological Science and Technology, 48(4): 590-599. | |
| [31] | 刘敬, 慎利, 黄媛, 等, 2020. 基于局地气候分区的北京夜间热岛强度空间分异特征研究[J]. 地理与地理信息科学, 36(5): 39-45, 64. |
| LIU J, SHEN L, HUANG Y, et al., 2020. Spatial differentiation characteristics of nocturnal heat island intensity in Beijing based on local climate zoning[J]. Geography and Geo-Information Science, 36(5): 39-45, 64. | |
| [32] | 刘施含, 曹银贵, 贾颜卉, 等, 2019. 城市热岛效应研究进展[J]. 安徽农学通报, 25(23): 117-121. |
| LIU S H, CAO Y G, JIA Y H, et al., 2019. Research progress on urban heat island effect[J]. Anhui Agricultural Science Bulletin, 25(23): 117-121. | |
| [33] | 马永欢, 鹿琳琳, 肖达, 等, 2022. 基于局地气候分区的城市热环境分析——以北京市为例[J]. 北京师范大学学报(自然科学版), 58(6): 901-909. |
| MA Y H, LU L L, XIAO D, et al., 2022. Urban thermal environment analysis based on local climate zoning: A case study of Beijing[J]. Journal of Beijing Normal University (Natural Science Edition), 58(6): 901-909. | |
| [34] |
彭保发, 石忆邵, 王贺封, 等, 2013. 城市热岛效应的影响机理及其作用规律——以上海市为例[J]. 地理学报, 68(11): 1461-1471.
DOI |
| PENG B F, SHI Y S, WANG H F, et al., 2013. The influence mechanism and law of urban heat island effect: A case study of Shanghai[J]. Acta Geographica Sinica, 68(11): 1461-1471. | |
| [35] | 秦艳丽, 时鹏, 何文虹, 等, 2020. 西安市城市化对景观格局及生态系统服务价值的影响[J]. 生态学报, 40(22): 8239-8250. |
| QIN Y L, SHI P, HE W H, et al., 2020. The impact of urbanization on landscape pattern and ecosystem service value in Xi’an[J]. Acta Ecological Sinica, 40(22): 8239-8250. | |
| [36] |
单宝艳, 张巧, 任启新, 等, 2022. 基于局地气候分区的济南市热环境空间分异及其影响因素[J]. 地球信息科学学报, 24(4): 711-722.
DOI |
| SHAN B Y, ZHANG Q, REN Q X, et al., 2022. Spatial differentiation of thermal environment and its influencing factors in Jinan based on local climate zoning[J]. Journal of Geo-Information Science, 24(4): 711-722. | |
| [37] | 王耀斌, 赵永华, 韩磊, 等, 2017. 西安市景观格局与城市热岛效应的耦合关系[J]. 应用生态学报, 28(8): 2621-2628. |
| WANG Y B, ZHAO Y H, HAN L, et al., 2017. The coupling relationship between landscape pattern and urban heat island effect in Xi’an[J]. Chinese Journal of Applied Ecology, 28(8): 2621-2628. | |
| [38] | 徐建华, 2014. 计量地理学[M]. 第2版. 北京: 高等教育出版社. |
| XU J H, 2014. Quantitative Geography[M]. 2nd Edition. Beijing: Higher Education Press. | |
| [39] |
赵欣, 赵凯旭, 黄晓军, 2022. 基于ECOSTRESS地表温度和手机信令数据的城市人口热环境暴露风险评价——以西安市为例[J]. 地理科学进展, 41(11): 2061-2072.
DOI |
|
ZHAO X, ZHAO K X, HUANG X J, 2022. Risk assessment of thermal environment exposure of urban population based on ECOSTRESS land surface temperature and mobile phone signaling data: A case study of Xi’an City[J]. Progress in Geography, 41(11): 2061-2072.
DOI |
| [1] | 付蓉, 武新梅, 陈斌. 城市地表温度空间分异及驱动因子差异性分析——以合肥市为例[J]. 生态环境学报, 2023, 32(1): 110-122. |
| [2] | 蒋恬田, 杨纯, 廖炜, 胡力, 刘欢瑶, 任勃, 李小马. 城市绿地景观格局影响地表温度的通径分析——以长沙市为例[J]. 生态环境学报, 2023, 32(1): 18-25. |
| [3] | 阮惠华, 许剑辉, 张菲菲. 2001—2020年粤港澳大湾区植被和地表温度时空变化研究[J]. 生态环境学报, 2022, 31(8): 1510-1520. |
| [4] | 李喆, 陈圣宾, 陈芝阳. 地表温度与土地利用类型间的空间尺度依赖性——以成都为例[J]. 生态环境学报, 2022, 31(5): 999-1007. |
| [5] | 宋鑫博, 黄鹤, 郭军, 熊明明. 城市形态对夏季热环境影响研究——以天津中心城区为例[J]. 生态环境学报, 2021, 30(11): 2165-2174. |
| 阅读次数 | ||||||
|
全文 |
|
|||||
|
摘要 |
|
|||||