生态环境学报 ›› 2023, Vol. 32 ›› Issue (7): 1237-1248.DOI: 10.16258/j.cnki.1674-5906.2023.07.007
方云皓1,2( ), 赵丽元1,2,*(), 窦碧莹3, 王书贤1,2
收稿日期:2023-02-09
出版日期:2023-07-18
发布日期:2023-09-27
通讯作者:
* 赵丽元。E-mail: liyuanzhao@hust.edu.cn作者简介:方云皓(1995年生),男,博士研究生,主要研究方向为城市风热环境、城市气候适应性规划。E-mail: baigao@hust.edu.cn
基金资助:
FANG Yunhao1,2(), ZHAO Liyuan1,2,*(), DOU Biying3, WANG Shuxian1,2
Received:2023-02-09
Online:2023-07-18
Published:2023-09-27
摘要:
快速城市化是热环境风险加剧的主因,从网络视角分析热环境的空间结构特征,对于改善热环境、增强城市可持续性以适应气候变化具有重要意义。以长江中游城市群为例,基于2000、2010及2020年地表温度数据与建成区面积数据分析城市群地表温度与热岛区域时空特征,采取形态学空间格局分析(MSPA)模型提取并划分热岛斑块类型,包括核心、孤岛、孔隙、边缘、环道、桥接以及支线,在此基础上构建热环境源地与热环境廊道,并利用电路(CIRCUIT)理论对城市群热环境网络进行识别。此外,依据多元指标分别评估城市群热环境网络的总体连通性(α指数、β指数与γ指数)与空间连通性(特征向量中心性与电流密度)。结果表明:(1)2000-2020年期间,长江中游城市群夏季地表温度高温区与次高温区比例整体呈上升趋势,常温区、低温区以及次低温区比例整体呈下降趋势,各类型热岛斑块的地表温度中位数呈现核心型热岛斑块最高而支线型热岛斑块最低的规律;(2)2000-2020年期间,长江中游城市群夏季热岛区域总面积由2.80×10³ km2增至12.8×10³ km2,其中核心型热岛斑块面积占比由31.1%增加至45.9%,在空间上呈现逐渐向武汉、长沙以及南昌等地集聚的趋势;(3)2000-2020年期间,长江中游城市群热环境源地数量由56个增至215个,热环境廊道数量由89条增至378条,包含热环境廊道的城市比例由77.4%增至100%,已初步形成城市群全局热环境网络;(4)2000-2020年期间,长江中游城市群热环境网络的总体连通性呈逐渐增强态势,空间连通性的分布趋势由“南高北低”的空间异质性格局向“全局高连通性”的空间稳定性格局演变。该研究旨在为区域尺度的气候适应发展策略提供启示。
中图分类号:
方云皓, 赵丽元, 窦碧莹, 王书贤. 基于MSPA-CIRCUIT的长江中游城市群热环境网络识别与评价研究[J]. 生态环境学报, 2023, 32(7): 1237-1248.
FANG Yunhao, ZHAO Liyuan, DOU Biying, WANG Shuxian. Research on the Identification and Evaluation of Thermal Environment Networks in Urban Agglomerations of the Middle Reaches of the Yangtze River Based on MSPA-CIRCUIT[J]. Ecology and Environment, 2023, 32(7): 1237-1248.

图1 研究区域 该图基于自然资源部标准地图(审图号:GS (2020) 4619号)绘制而成,下同
Figure 1 Study area
| 热岛斑块类型 | 空间形态特征 |
|---|---|
| 核心 | 面积较大、连续且不包含其边缘的城市群热岛斑块的核心 |
| 孤岛 | 面积小于核心区最小阈值、连接度低、分散、孤立的城市群热岛斑块 |
| 孔隙 | 城市群热岛核心区与内部非热岛斑块接触的边界,属过度区域 |
| 边缘 | 城市群热岛核心区与外部非热岛斑块接触的边界,属过度区域 |
| 环道 | 连接相同城市群热岛核心区的内部热岛廊道,属狭长区域 |
| 桥接 | 连接不同城市群热岛核心区的外部热岛廊道,属狭长区域 |
| 支线 | 仅一端与边缘区、桥接区或环道区联系的城市群热岛斑块 |
表1 基于MSPA模型的热岛斑块分类及其空间形态特征
Table 1 Classification of heat island patches and their spatial morphological characteristics based on MSPA model
| 热岛斑块类型 | 空间形态特征 |
|---|---|
| 核心 | 面积较大、连续且不包含其边缘的城市群热岛斑块的核心 |
| 孤岛 | 面积小于核心区最小阈值、连接度低、分散、孤立的城市群热岛斑块 |
| 孔隙 | 城市群热岛核心区与内部非热岛斑块接触的边界,属过度区域 |
| 边缘 | 城市群热岛核心区与外部非热岛斑块接触的边界,属过度区域 |
| 环道 | 连接相同城市群热岛核心区的内部热岛廊道,属狭长区域 |
| 桥接 | 连接不同城市群热岛核心区的外部热岛廊道,属狭长区域 |
| 支线 | 仅一端与边缘区、桥接区或环道区联系的城市群热岛斑块 |
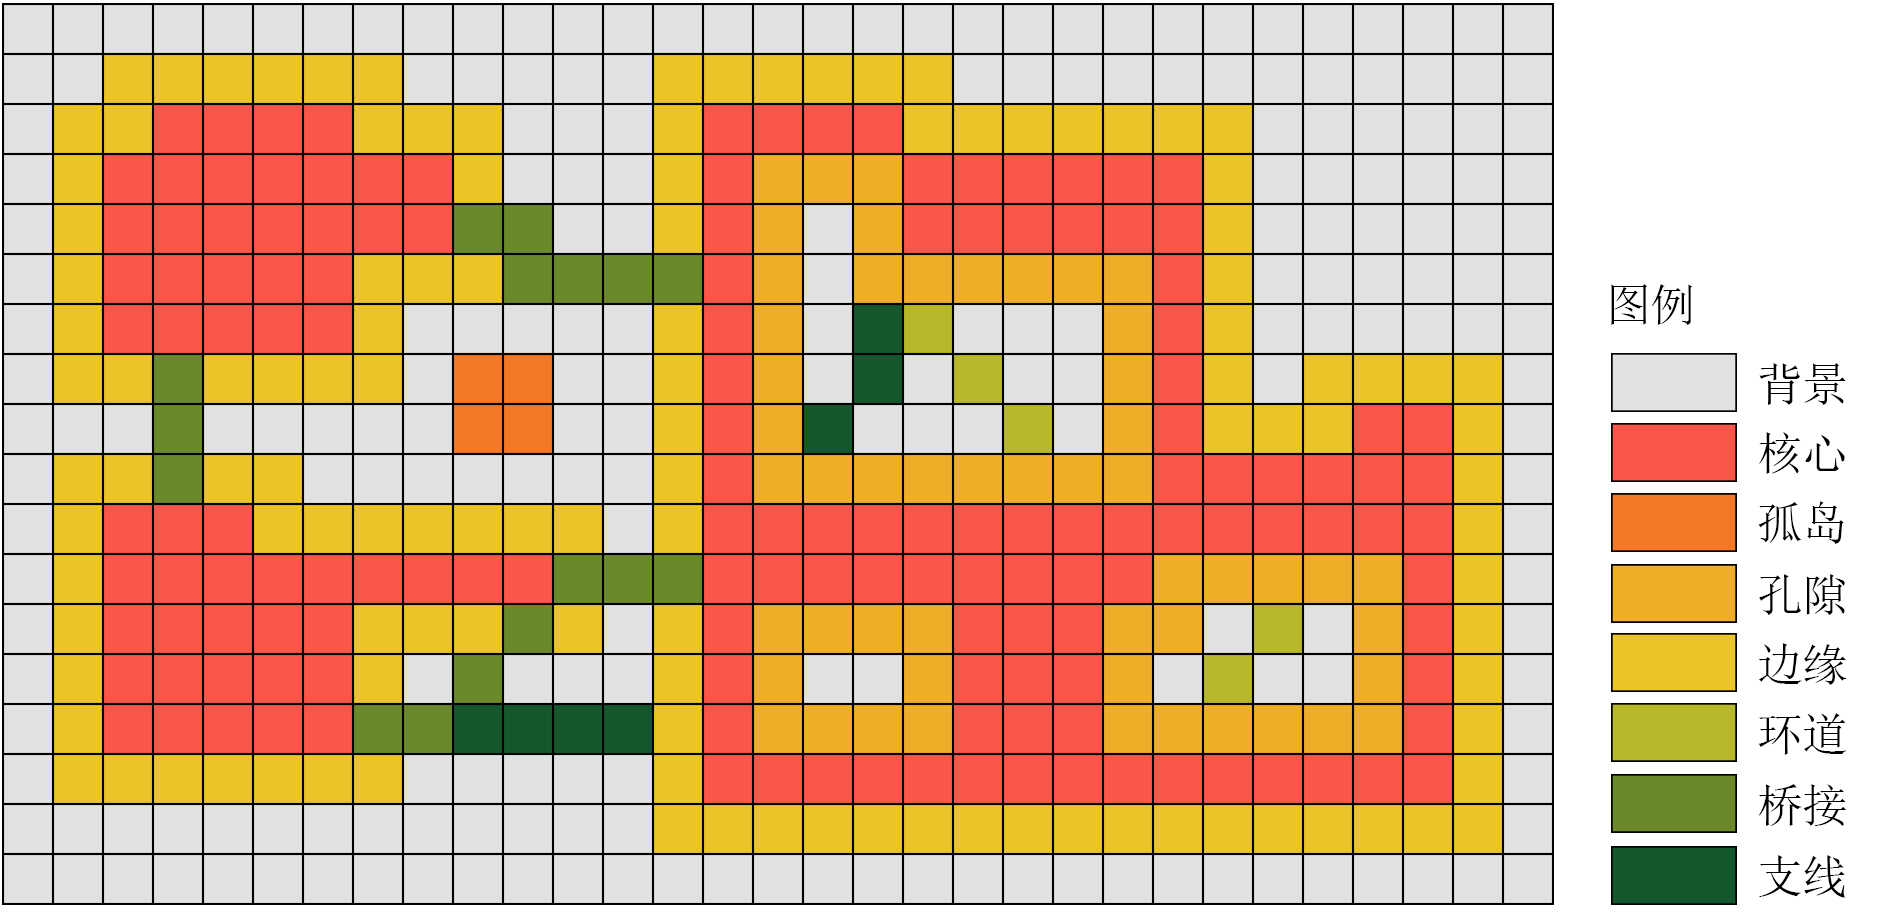
图2 热岛斑块类型及其空间形态特征示意图
Figure 2 Schematic diagram of the heat island patch types and their spatial morphological characteristics
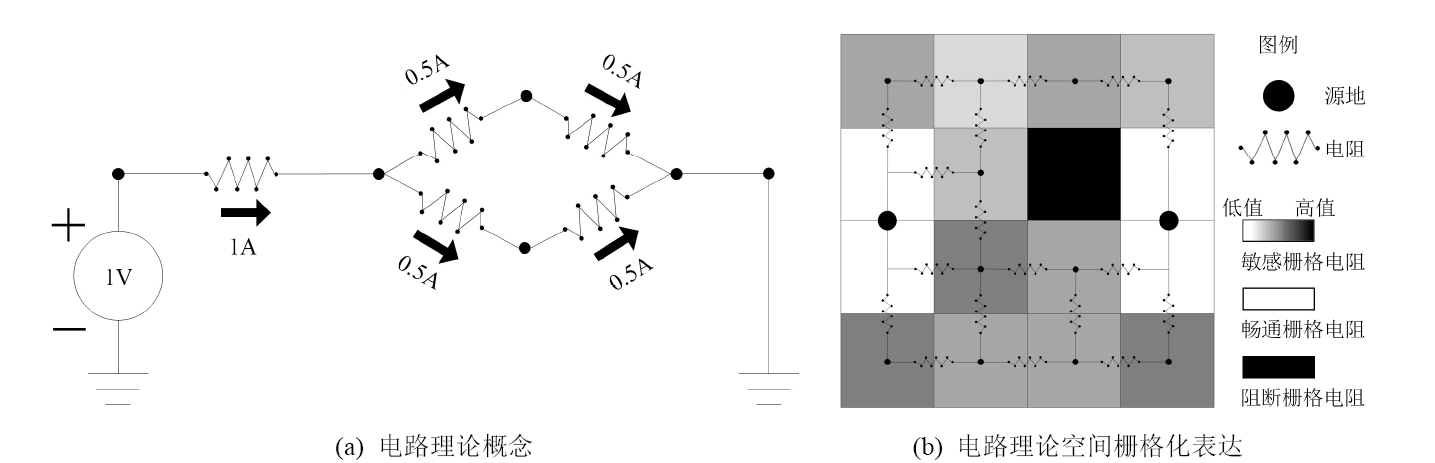
图3 电路理论示意图
Figure 3 Schematic diagram of circuit theory
| 热岛斑块类型 | 背景 | 核心 | 孤岛 | 孔隙 | 边缘 | 环道 | 桥接 | 支线 |
|---|---|---|---|---|---|---|---|---|
| 阻力值 | 100 | 1 | 15 | 80 | 30 | 30 | 10 | 60 |
表2 各类型热岛斑块阻力值
Table 2 Resistance values for various types of heat island patches
| 热岛斑块类型 | 背景 | 核心 | 孤岛 | 孔隙 | 边缘 | 环道 | 桥接 | 支线 |
|---|---|---|---|---|---|---|---|---|
| 阻力值 | 100 | 1 | 15 | 80 | 30 | 30 | 10 | 60 |
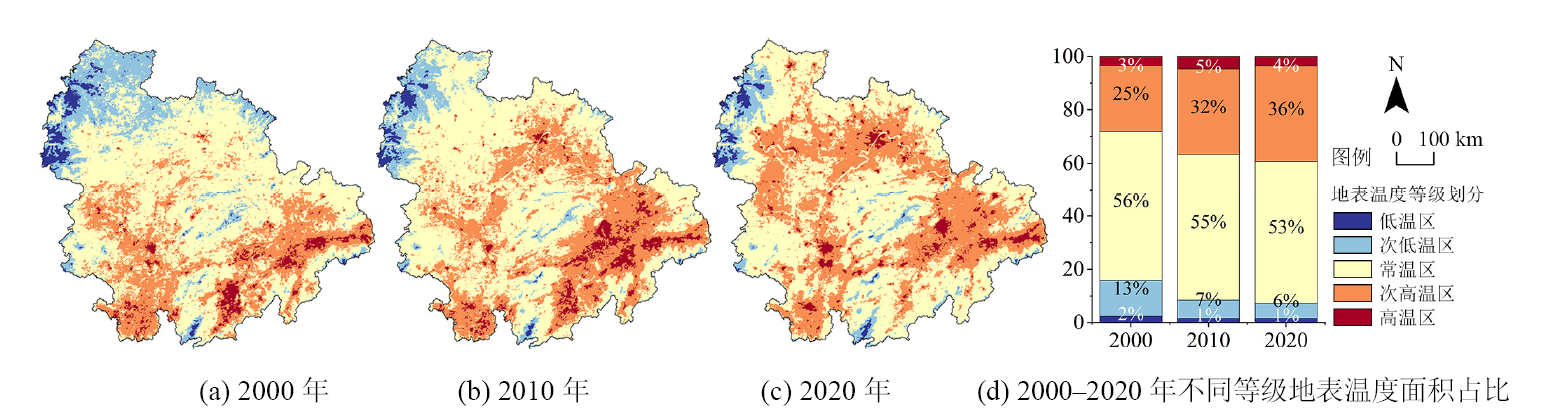
图4 2000-2020年长江中游城市群夏季地表温度空间演变特征
Figure 4 Spatial evolution characteristics of summer LST in urban agglomerations of the middle reaches of the Yangtze River from 2000 to 2020
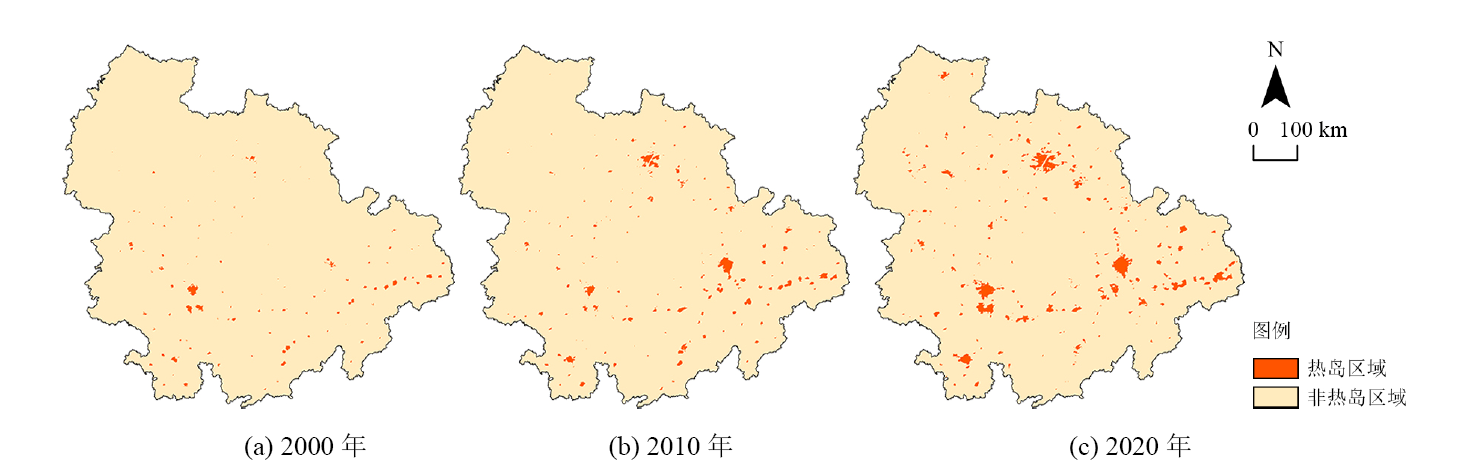
图5 2000-2020年长江中游城市群夏季热岛区域空间演变特征
Figure 5 Spatial evolution characteristics of heat island area in urban agglomerations of the middle reaches of the Yangtze River from 2000 to 2020
| 热岛斑块类型 | 2000年面积/ 103 km2 | 占总斑块面积 比例/% | 2010年面积/ 103 km2 | 占总斑块面积 比例/% | 2020年面积/ 103km2 | 占总斑块面积 比例/% | 斑块比例 演变趋势 |
|---|---|---|---|---|---|---|---|
| 核心 | 0.870 | 31.1 | 2.56 | 39.9 | 5.89 | 45.9 | 持续增加 |
| 孤岛 | 0.460 | 16.4 | 0.682 | 10.6 | 0.928 | 7.2 | 持续减少 |
| 孔隙 | 0 | 0 | 0 | 0 | 0.016 | 0.1 | 先不变后增加 |
| 边缘 | 1.02 | 36.5 | 2.38 | 37.1 | 4.42 | 34.5 | 先增加后减少 |
| 环道 | 0.045 | 1.6 | 0.032 | 0.5 | 0.152 | 1.2 | 先减少后增加 |
| 桥接 | 0.025 | 0.9 | 0.049 | 0.8 | 0.118 | 0.9 | 先减少后增加 |
| 支线 | 0.378 | 13.5 | 0.710 | 11.1 | 1.31 | 10.2 | 持续减少 |
| 总和 | 2.80 | 100.0 | 6.41 | 100.0 | 12.8 | 100.0 | - |
表3 2000-2020年长江中游城市群热岛斑块面积及占比统计
Table 3 Statistics on the area and proportion of heat island patches in urban agglomerations of the middle reaches of the Yangtze River from 2000 to 2020
| 热岛斑块类型 | 2000年面积/ 103 km2 | 占总斑块面积 比例/% | 2010年面积/ 103 km2 | 占总斑块面积 比例/% | 2020年面积/ 103km2 | 占总斑块面积 比例/% | 斑块比例 演变趋势 |
|---|---|---|---|---|---|---|---|
| 核心 | 0.870 | 31.1 | 2.56 | 39.9 | 5.89 | 45.9 | 持续增加 |
| 孤岛 | 0.460 | 16.4 | 0.682 | 10.6 | 0.928 | 7.2 | 持续减少 |
| 孔隙 | 0 | 0 | 0 | 0 | 0.016 | 0.1 | 先不变后增加 |
| 边缘 | 1.02 | 36.5 | 2.38 | 37.1 | 4.42 | 34.5 | 先增加后减少 |
| 环道 | 0.045 | 1.6 | 0.032 | 0.5 | 0.152 | 1.2 | 先减少后增加 |
| 桥接 | 0.025 | 0.9 | 0.049 | 0.8 | 0.118 | 0.9 | 先减少后增加 |
| 支线 | 0.378 | 13.5 | 0.710 | 11.1 | 1.31 | 10.2 | 持续减少 |
| 总和 | 2.80 | 100.0 | 6.41 | 100.0 | 12.8 | 100.0 | - |
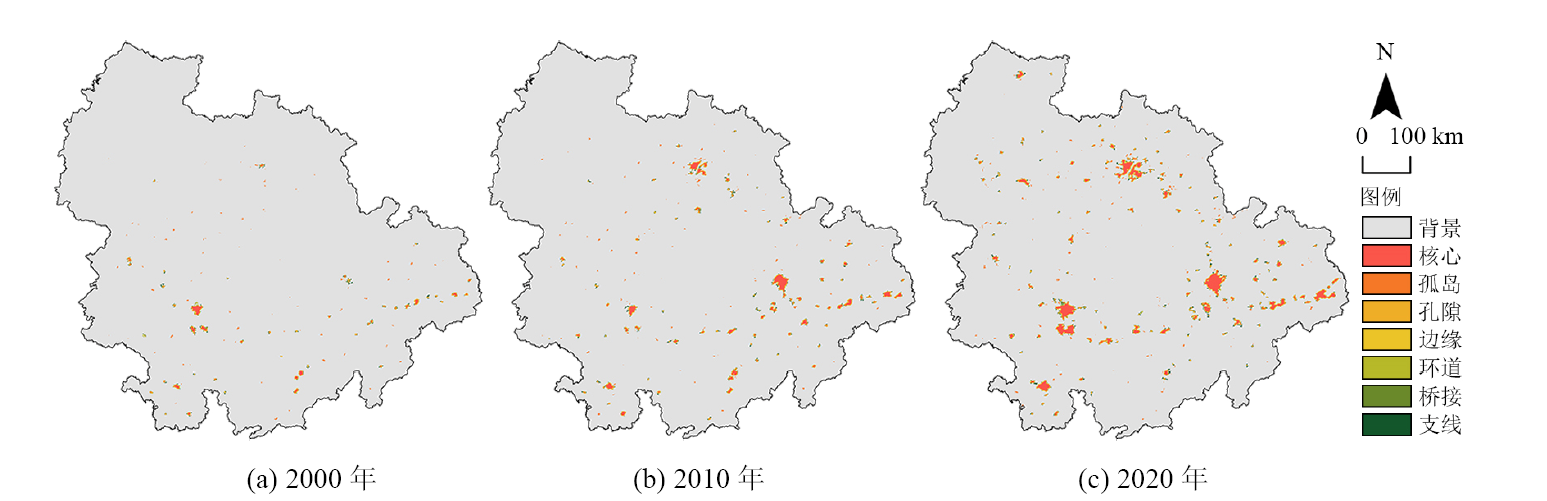
图6 2000-2020年长江中游城市群热岛斑块空间分布
Figure 6 Spatial distribution of heat island patches in urban agglomerations of the middle reaches of the Yangtze River from 2000 to 2020

图7 2000-2020年长江中游城市群热岛斑块地表温度箱线图
Figure 7 Box-plot of LST of heat island patches in urban agglomerations of the middle reaches of the Yangtze River from 2000 to 2020
| 热环境源地 与廊道数量 | 年份 | ||
|---|---|---|---|
| 2000 | 2010 | 2020 | |
| 热环境源地数量 (N) | 56 | 116 | 215 |
| 热环境廊道数量 (L) | 89 | 192 | 378 |
表4 2000-2020年长江中游城市群热环境源地与热环境廊道数量统计
Table 4 Statistics on the number of thermal environment sources and corridors in urban agglomerations of the middle reaches of the Yangtze River from 2000 to 2020
| 热环境源地 与廊道数量 | 年份 | ||
|---|---|---|---|
| 2000 | 2010 | 2020 | |
| 热环境源地数量 (N) | 56 | 116 | 215 |
| 热环境廊道数量 (L) | 89 | 192 | 378 |
图8 2000-2020年长江中游城市群热环境网络空间分布
Figure 8 Spatial distribution of thermal environment network in urban agglomerations of the middle reaches of the Yangtze River from 2000 to 2020

图9 2000-2020年长江中游城市群热环境网络总体连通性
Figure 9 Overall connectivity of the thermal environment network in urban agglomerations of the middle reaches of the Yangtze River from 2000 to 2020

图10 2000-2020年长江中游城市群热环境源地空间连通性
Figure 10 Spatial connectivity of thermal environment sources in urban agglomerations of the middle reaches of the Yangtze River from 2000 to 2020
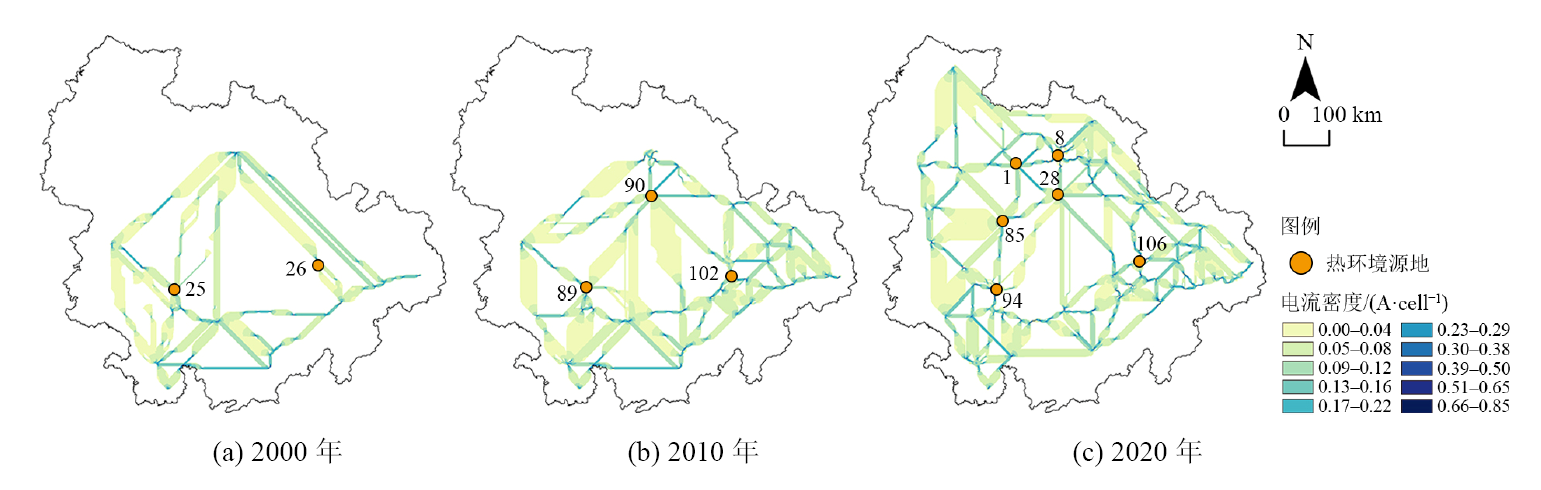
图11 2000-2020年长江中游城市群热环境廊道空间连通性
Figure 11 Spatial connectivity of thermal environment corridors in urban agglomerations of the middle reaches of the Yangtze River from 2000 to 2020
| [1] |
CHEN S Z, YU Z W, LIU M, et al., 2021. Trends of the contributions of biophysical (climate) and socioeconomic elements to regional heat islands[J]. Scientific Reports, 11(1): 12696.
DOI PMID |
| [2] |
CHEN Y, YANG J, YANG R X, et al., 2022. Contribution of urban functional zones to the spatial distribution of urban thermal environment[J]. Building and Environment, 216(15): 109000.
DOI URL |
| [3] |
DU H Y, WANG D D, WANG Y Y, et al., 2016. Influences of land cover types, meteorological conditions, anthropogenic heat and urban area on surface urban heat island in the Yangtze River Delta Urban Agglomeration[J]. Science of the Total Environment, 571(15): 461-470.
DOI URL |
| [4] |
HE C, ZHOU L G, YAO Y R, et al., 2020. Estimating spatial effects of anthropogenic heat emissions upon the urban thermal environment in an urban agglomeration area in East China[J]. Sustainable Cities and Society, 57: 102046.
DOI URL |
| [5] |
LAI D Y, LIU W Y, GAN T T, et al., 2019. A review of mitigating strategies to improve the thermal environment and thermal comfort in urban outdoor spaces[J]. Science of the Total Environment, 661(15): 337-353.
DOI URL |
| [6] |
LU H M, LI F, YANG G, et al., 2021. Multi-scale impacts of 2D/3D urban building pattern in intra-annual thermal environment of Hangzhou, China[J]. International Journal of Applied Earth Observation and Geoinformation, 104(15): 102558.
DOI URL |
| [7] |
MA Y, KUANG Y Q, HUANG N S, 2010. Coupling urbanization analyses for studying urban thermal environment and its interplay with biophysical parameters based on TM/ETM+ imagery[J]. International Journal of Applied Earth Observation and Geoinformation, 12(2): 110-118.
DOI URL |
| [8] |
PENG J, CHENG X, HU Y, et al., 2022. A landscape connectivity approach to mitigating the urban heat island effect[J]. Landscape Ecology, 37(6): 1707-1719.
DOI |
| [9] |
PENG J, HU Y X, DONG J Q, et al., 2020. Quantifying spatial morphology and connectivity of urban heat islands in a megacity: A radius approach[J]. Science of the Total Environment, 714(20): 136792.
DOI URL |
| [10] |
SOILLE P, VOGT P, 2008. Morphological segmentation of binary patterns[J]. Pattern Recognition Letters, 30(4): 456-459.
DOI URL |
| [11] |
STEWART I D, 2011. A systematic review and scientific critique of methodology in modern urban heat island literature[J]. International Journal of Climatology, 31(2): 200-217.
DOI URL |
| [12] |
UNGER J, SÜMEGHY Z, GULYÁS Á, et al., 2001. Land-use and meteorological aspects of the urban heat island[J]. Meteorological Applications, 8(2): 189-194.
DOI URL |
| [13] |
YU Z W, ZHANG J G, YANG G Y, 2021. How to build a heat network to alleviate surface heat island effect?[J]. Sustainable Cities and Society, 74: 103135.
DOI URL |
| [14] |
ZUO J, PULLEN S, PALMER J, et al., 2015. Impacts of heat waves and corresponding measures: A review[J]. Journal of Cleaner Production, 92(1): 1-12.
DOI URL |
| [15] |
陈冰倩, 张友水, 程璟媛, 等, 2019. 福州市地表温度热点及时空变化分析[J]. 地球信息科学学报, 21(5): 710-719.
DOI |
| CHEN B Q, ZHANG Y S, CHENG J Y, et al., 2019. The hot spot and spatiotemporal changes of the land surface temperature in Fuzhou[J]. Journal of Geo-information Science, 21(5): 710-719. | |
| [16] | 付含聪, 邓帆, 杨欢, 等, 2020. 基于遥感的长江中下游城市群高温热浪风险评估[J]. 长江流域资源与环境, 29(5): 1174-1182. |
| FU H C, DENG F, YANG H, et al., 2020. Assessing heat wave risk of urban agglomeration in the Middle-Lower Yangtze River based on remote sensing[J]. Resources and Environment in the Yangtze Basin, 29(5): 1174-1182. | |
| [17] | 郭冠华, 陈颖彪, 魏建兵, 等, 2012. 粒度变化对城市热岛空间格局分析的影响[J]. 生态学报, 32(12): 3764-3772. |
|
GUO G H, CHEN Y B, WEI J B, et al., 2012. Impacts of grid sizes on urban heat island pattern analysis[J]. Acta Ecologica Sinica, 32(12): 3764-3772.
DOI URL |
|
| [18] |
胡昊宇, 黄莘绒, 李沛霖, 等, 2022. 流空间视角下中国城市群网络结构特征比较——基于铁路客运班次的分析[J]. 地球信息科学学报, 24(8): 1525-1540.
DOI |
| HU H Y, HUANG X R, LI P L, et al., 2022. Comparison of network structure patterns of urban agglomerations in China from the perspective of space of flows: Analysis based on railway schedule[J]. Journal of Geo-information Science, 24(8): 1525-1540. | |
| [19] |
胡楠林, 任志彬, 董禹麟, 等, 2022. 中国城市群热岛效应时空演变及其影响因素分析[J]. 地理科学, 42(9): 1534-1545.
DOI |
| HU N L, REN Z B, DONG Y L, et al., 2022. Spatiotemporal evolution of heat island effect and its driving factors in urban agglomerations of China[J]. Scientia Geographica Sinica, 42(9): 1534-1545. | |
| [20] |
黄聚聪, 赵小锋, 唐立娜, 等, 2011. 城市热力景观格局季节变化特征分析及其应用[J]. 生态环境学报, 20(2): 304-310.
DOI |
| HUANG J C, ZHAO X F, TANG L N, et al., 2011. Analysis on the seasonal changes of urban thermal landscape pattern and its application[J]. Ecology and Environmental Sciences, 20(2): 304-310. | |
| [21] | 黄聚聪, 赵小锋, 唐立娜, 等, 2012. 城市化进程中城市热岛景观格局演变的时空特征——以厦门市为例[J]. 生态学报, 32(2): 622-631. |
|
HUANG J C, ZHAO X F, TANG L N, et al., 2012. Analysis on spatiotemporal changes of urban thermal landscape pattern in the context of urbanisation: A case study of Xiamen City[J]. Acta Ecologica Sinica, 32(2): 622-631.
DOI URL |
|
| [22] | 黄梅, 刘晨曦, 俞晓莹, 等, 2022. 城市水生态网络韧性评价与优化策略——以长沙市为例[J]. 经济地理, 42(10): 52-60. |
|
HUANG M, LIU C X, YU X Y, et al., 2022. Resilience evaluation and optimization of urban water ecological network: Take Changsha as an example[J]. Economic Geography, 42(10): 52-60.
DOI URL |
|
| [23] |
江颂, 彭建, 董建权, 等, 2022. 地表城市热岛效应的概念内涵与定量刻画[J]. 地理学报, 77(9): 2249-2265.
DOI |
|
JIANG S, PENG J, DONG J Q, et al., 2022. Conceptual connotation and quantitative characterization of surface urban heat island effect[J]. Acta Geographica Sinica, 77(9): 2249-2265.
DOI |
|
| [24] | 李久林, 徐建刚, 储金龙, 2020. 基于Circuit理论的城市生态安全格局研究——以安庆市为例[J]. 长江流域资源与环境, 29(8): 1812-1824. |
| LI J L, XU J G, CHU J L, 2020. Constructing the urban ecological security pattern of Anqing city by circuit theory[J]. Resources and Environment in the Yangtze Basin, 29(8): 1812-1824. | |
| [25] | 李召良, 段四波, 唐伯惠, 等, 2016. 热红外地表温度遥感反演方法研究进展[J]. 遥感学报, 20(5): 899-920. |
|
LI Z L, DUAN S B, TANG B H, et al., 2016. Review of methods for land surface temperature derived from thermal infrared remotely sensed data[J]. National Remote Sensing Bulletin, 20(5): 899-920.
DOI URL |
|
| [26] |
林中立, 徐涵秋, 2022. 基于局地气候分区体系的福州城市热环境研究[J]. 地球信息科学学报, 24(1): 189-200.
DOI |
| LIN Z L, XU H Q, 2022. A study of urban thermal environmental of Fuzhou based on “Local climate zones”[J]. Journal of Geo-information Science, 24(1): 189-200. | |
| [27] | 林中立, 徐涵秋, 陈弘, 2018. 我国东部沿海三大城市群热岛变化及其与城市群发展的关系[J]. 环境科学研究, 31(10): 1695-1704. |
| LIN Z L, XU H Q, CHEN H, 2022. Urban heat island change and its relationship to the urbanization of three major urban agglomerations in China's eastern coastal region[J]. Research of Environmental Sciences, 31(10): 1695-1704. | |
| [28] | 刘璐, 申广荣, 吴裕, 等, 2019. 城市化进程中县域土地利用类型的转移特征及其对热环境的影响[J]. 水土保持通报, 39(6): 260-266. |
| LIU L, SHENG G R, WU Y, et al., 2019. Characteristics of land use transfer and its influence on thermal environment in county-level urbanization[J]. Bulletin of Soil and Water Conservation, 39(6): 260-266. | |
| [29] | 刘婷, 欧阳帅, 勾蒙蒙, 等, 2023. 基于MSPA模型的新型城市热景观连通性分析[J]. 生态学报, 43(2): 615-624. |
| LIU T, OUYANG S, GOU M M, et al., 2023. Analysis connectivity of urban heat island in a new-type urbanization based on MSPA model[J]. Acta Ecologica Sinica, 43(2): 615-624. | |
| [30] | 乔治, 陈嘉悦, 王楠, 等, 2023. 基于MSPA和电路理论的京津冀城市群热环境空间网络[J]. 环境科学, 44(6): 3034-3042. |
| QIAO Z, CHEN J Y, WANG N, et al., 2023. Spatial network of urban heat environment in Beijing-Tianjin-Hebei urban agglomeration based on MSPA and circuit theory[J]. Environmental Science, 44(6): 3034-3042. | |
| [31] |
乔治, 卢应爽, 贺曈, 等, 2022. 城市热岛斑块遥感识别及空间扩张路径研究——以北京市为例[J]. 地理科学, 42(8): 1492-1501.
DOI |
|
QIAO Z, LU Y S, HE T, et al., 2022. Identifying urban heat island patches and spatial expansion path based on remote sensing technology: A case of Beijing City[J]. Scientia Geographica Sinica, 42(8): 1492-1501.
DOI |
|
| [32] | 覃盟琳, 宋文博, 宋苑震, 等, 2020. 北部湾城市群热岛空间特征及演变趋势研究[J]. 安全与环境学报, 20(4): 1557-1566. |
| QIN M L, SONG W B, SONG Y Z, et al., 2020. Study on spatial features and evolutionary trend of heat islands in Beibu Gulf urban agglomeration[J]. Journal of Safety and Environment, 20(4): 1557-1566. | |
| [33] |
宋利利, 秦明周, 2016. 整合电路理论的生态廊道及其重要性识别[J]. 应用生态学报, 27(10): 3344-3352.
DOI |
| SONG L L, QIN M Z, 2016. Identification of ecological corridors and its importance by integrating circuit theory[J]. Chinese Journal of Applied Ecology, 27(10): 3344-3352. | |
| [34] | 孙芹芹, 吴志峰, 谭建军, 2010. 基于热力重心的广州城市热环境时空变化分析[J]. 地理科学, 30(4): 620-623. |
|
SUN Q Q, WU Z F, TAN J J, 2010. Spatio-temporal changes of urban thermal environment with thermal centroid in Guangzhou[J]. Scientia Geographica Sinica, 30(4): 620-623.
DOI |
|
| [35] | 孙铁钢, 肖荣波, 蔡云楠, 等, 2016. 城市热环境定量评价技术研究进展及发展趋势[J]. 应用生态学报, 27(8): 2717-2728. |
| SUN T G, XIAO R B, CAI Y N, et al., 2016. Research progress and development trend of quantitative assessment techniques for urban thermal environment[J]. Chinese Journal of Applied Ecology, 27(8): 2717-2728. | |
| [36] | 王鹏龙, 张建明, 吕荣芳, 2014. 基于空间自相关的兰州市热环境[J]. 生态学杂志, 33(4): 1089-1095. |
| WANG P L, ZHANG J M, LÜ R F, 2014. Urban thermal environment pattern with spatial autocorrelation in Lanzhou[J]. Chinese Journal of Ecology, 33(4): 1089-1095. | |
| [37] | 王子安, 孟庆岩, 张琳琳, 等, 2022. 基于CA-Markov模型的海口市城市热岛模拟预测[J]. 中国科学院大学学报, 39(6): 742-753. |
| WANG Z A, MENG Q Y, ZHANG L L, et al., 2022. Simulation and prediction of urban heat island in Haikou City based on CA-Markov model[J]. Journal of University of Chinese Academy of Sciences, 39(6): 742-753. | |
| [38] |
吴健生, 何海珊, 胡甜, 2022. 地表温度 “源-汇” 景观贡献度的影响因素分析[J]. 地理学报, 77(1): 51-65.
DOI |
| WU J S, HE H S, HU T, 2022. Analysis of factors influencing the “source-sink” landscape contribution of land surface temperature[J]. Acta Geographica Sinica, 77(1): 51-65. | |
| [39] | 谢志清, 杜银, 曾燕, 等, 2007. 长江三角洲城市带扩展对区域温度变化的影响[J]. 地理学报, 62(7): 717-727. |
| XIE Z Q, DU Y, ZENG Y, et al., 2007. Impact of urbanization on regional temperature change in the Yangtze River Delta[J]. Acta Geographica Sinica, 62(7): 717-727. | |
| [40] |
辛儒鸿, 曾坚, 李凯, 等, 2022. 城市热环境调节服务供需失衡关键区识别与优先级划分[J]. 地理研究, 41(11): 3124-3142.
DOI |
|
XIN R H, ZENG J, LI K, et al., 2022. Identifying the key areas and management priorities of the imbalance between supply and demand in urban thermal environment regulation[J]. Geographical Research, 41(11): 3124-3142.
DOI |
|
| [41] | 徐涵秋, 2015. 新型Landsat8卫星影像的反射率和地表温度反演[J]. 地球物理学报, 58(3): 741-747. |
| XU H Q, 2015. Retrieval of the reflectance and land surface temperature of the newly-launched Landsat 8 satellite[J]. Chinese Journal of Geophysics, 58(3): 741-747. | |
| [42] | 徐丽华, 岳文泽, 徐建华, 2007. 城市热场剖面的分形维数计算及其意义研究——以上海中心城区为例[J]. 长江流域资源与环境, 16(3): 384-390. |
| XU L H, YUE W Z, XU J H, 2007. Calculation of profile line fractal dimension for urban thermal surface[J]. Resources and Environment in the Yangtze Basin, 16(3): 384-390. | |
| [43] | 于明洋, 卢晓琛, 邢华桥, 等, 2021. 济南市中心城区地表热环境时空变化分析[J]. 测绘科学, 46(4): 100-107, 157. |
| YU M Y, LU X C, XING H Q, et al., 2021. Analysis of temporal and spatial changes of surface thermal environment in Ji’nan city center[J]. Science of Surveying and Mapping, 46(4): 100-107, 157. | |
| [44] | 占文凤, 陈云浩, 周纪, 等, 2011. 支持向量机的北京城市热岛模拟:热岛强度空间格局曲面模拟及其应用[J]. 测绘学报, 40(1): 96-103. |
| ZHAN W F, CHEN Y H, ZHOU J, et al., 2011. Spatial simulation of urban heat island intensity based on the support vector machine technique: A case study in Beijing[J]. Acta Geodaetica et Cartographica Sinica, 40(1): 96-103. | |
| [45] | 朱菲, 苏涛, 王建, 等, 2022. 基于地表参数变化的南京市热岛效应时空演变特征分析[J]. 遥感信息, 37(4): 106-113. |
| ZHU F, SU T, WANG J, et al., 2022. Spatio-temporal evolution characteristics of Nanjing heat island effect based on variation of surface parameter[J]. Remote Sensing Information, 37(4): 106-113. |
| [1] | 许静, 廖星凯, 甘崎旭, 周茅先. 基于MSPA与电路理论的黄河流域甘肃段生态安全格局构建[J]. 生态环境学报, 2023, 32(4): 805-813. |
| 阅读次数 | ||||||
|
全文 |
|
|||||
|
摘要 |
|
|||||