Ecology and Environment ›› 2024, Vol. 33 ›› Issue (2): 231-241.DOI: 10.16258/j.cnki.1674-5906.2024.02.007
• Research Article [Environmental Sciences] • Previous Articles Next Articles
ZHANG Yang1( ), XU Yongming1,*(), LU Xiangjun2, MO Yaping1, JI Meng1, ZHU Shanyou1
Received:2023-09-07
Online:2024-02-18
Published:2024-04-03
张杨1(), 徐永明1,*(), 卢响军2, 莫亚萍1, 吉蒙1, 祝善友1
通讯作者:
徐永明。E-mail: 作者简介:张杨(1999年生),女,硕士研究生,研究方向为大气环境遥感。E-mail: 20211211035@nuist.edu.cn
基金资助:CLC Number:
ZHANG Yang, XU Yongming, LU Xiangjun, MO Yaping, JI Meng, ZHU Shanyou. Spatialization of Atmospheric XCO2 in Xinjiang Uygur Autonomous Region based on OCO-2 Remote Sensing Data[J]. Ecology and Environment, 2024, 33(2): 231-241.
张杨, 徐永明, 卢响军, 莫亚萍, 吉蒙, 祝善友. 基于OCO-2遥感数据的新疆维吾尔自治区大气XCO2空间化研究[J]. 生态环境学报, 2024, 33(2): 231-241.
Add to citation manager EndNote|Ris|BibTeX
URL: https://www.jeesci.com/EN/10.16258/j.cnki.1674-5906.2024.02.007

Figure 1 Overview of the studied area
| 数据名称 | 数据来源 | 时间分辨率 | 空间分辨率 | 数据时间 |
|---|---|---|---|---|
| XCO2 | OCO-2 | 16 d | 1.29 km× 2.25 km | 2019 |
| NDVI | MODIS/MOD13A3 | 月 | 1 km×1 km | 2019 |
| 气象再分析数据 | ERA5-Land | 月 | 0.1°×0.1° | 2019 |
| 大气NO2 | Sentinel-5P | d | 1.1132 km× 1.1132 km | 2019 |
| 夜间灯光数据 | NPP/VIIRS | 月 | 500 m× 500 m | 2019 |
| DEM | SRTM/SRTMGL1_v003 | ‒ | 30 m×30 m | 2000 |
| 土地覆盖 | MODIS/MCD12Q1 | ‒ | 500 m×500 m | 2019 |
Table 1 Data information table
| 数据名称 | 数据来源 | 时间分辨率 | 空间分辨率 | 数据时间 |
|---|---|---|---|---|
| XCO2 | OCO-2 | 16 d | 1.29 km× 2.25 km | 2019 |
| NDVI | MODIS/MOD13A3 | 月 | 1 km×1 km | 2019 |
| 气象再分析数据 | ERA5-Land | 月 | 0.1°×0.1° | 2019 |
| 大气NO2 | Sentinel-5P | d | 1.1132 km× 1.1132 km | 2019 |
| 夜间灯光数据 | NPP/VIIRS | 月 | 500 m× 500 m | 2019 |
| DEM | SRTM/SRTMGL1_v003 | ‒ | 30 m×30 m | 2000 |
| 土地覆盖 | MODIS/MCD12Q1 | ‒ | 500 m×500 m | 2019 |

Figure 2 Spatial coverage of monthly OCO-2 observations in Xinjiang Uygur Autonomous Region in 2019
| 月份 | VIF | |||||||
|---|---|---|---|---|---|---|---|---|
| NDVI | 气温 | 风速 | 风向 | 高程 | 大气NO2 | 夜间灯光 | ||
| 1 | 1.18 | 4.94 | 1.82 | 1.05 | 5.13 | 1.15 | 1.03 | |
| 2 | 1.94 | 3.80 | 1.62 | 1.08 | 3.27 | 1.83 | 1.05 | |
| 3 | 1.33 | 3.30 | 1.35 | 1.43 | 3.09 | 1.57 | 1.02 | |
| 4 | 1.60 | 3.09 | 1.56 | 1.51 | 3.94 | 2.04 | 1.00 | |
| 5 | 1.74 | 4.20 | 1.39 | 1.29 | 4.39 | 2.13 | 1.02 | |
| 6 | 2.52 | 6.97 | 1.48 | 1.28 | 7.76 | 3.04 | 1.05 | |
| 7 | 1.71 | 5.49 | 1.12 | 1.02 | 8.39 | 3.23 | 1.02 | |
| 8 | 1.79 | 8.07 | 1.48 | 1.22 | 9.07 | 1.78 | 1.02 | |
| 9 | 1.49 | 6.22 | 1.11 | 1.30 | 5.75 | 1.49 | 1.00 | |
| 10 | 1.17 | 3.75 | 1.15 | 1.26 | 4.01 | 1.54 | 1.01 | |
| 11 | 1.10 | 2.09 | 1.86 | 1.17 | 3.24 | 1.28 | 1.03 | |
| 12 | 1.47 | 5.36 | 1.43 | 1.03 | 4.81 | 1.26 | 1.07 | |
Table 2 Results of multiple covariance regression analysis
| 月份 | VIF | |||||||
|---|---|---|---|---|---|---|---|---|
| NDVI | 气温 | 风速 | 风向 | 高程 | 大气NO2 | 夜间灯光 | ||
| 1 | 1.18 | 4.94 | 1.82 | 1.05 | 5.13 | 1.15 | 1.03 | |
| 2 | 1.94 | 3.80 | 1.62 | 1.08 | 3.27 | 1.83 | 1.05 | |
| 3 | 1.33 | 3.30 | 1.35 | 1.43 | 3.09 | 1.57 | 1.02 | |
| 4 | 1.60 | 3.09 | 1.56 | 1.51 | 3.94 | 2.04 | 1.00 | |
| 5 | 1.74 | 4.20 | 1.39 | 1.29 | 4.39 | 2.13 | 1.02 | |
| 6 | 2.52 | 6.97 | 1.48 | 1.28 | 7.76 | 3.04 | 1.05 | |
| 7 | 1.71 | 5.49 | 1.12 | 1.02 | 8.39 | 3.23 | 1.02 | |
| 8 | 1.79 | 8.07 | 1.48 | 1.22 | 9.07 | 1.78 | 1.02 | |
| 9 | 1.49 | 6.22 | 1.11 | 1.30 | 5.75 | 1.49 | 1.00 | |
| 10 | 1.17 | 3.75 | 1.15 | 1.26 | 4.01 | 1.54 | 1.01 | |
| 11 | 1.10 | 2.09 | 1.86 | 1.17 | 3.24 | 1.28 | 1.03 | |
| 12 | 1.47 | 5.36 | 1.43 | 1.03 | 4.81 | 1.26 | 1.07 | |
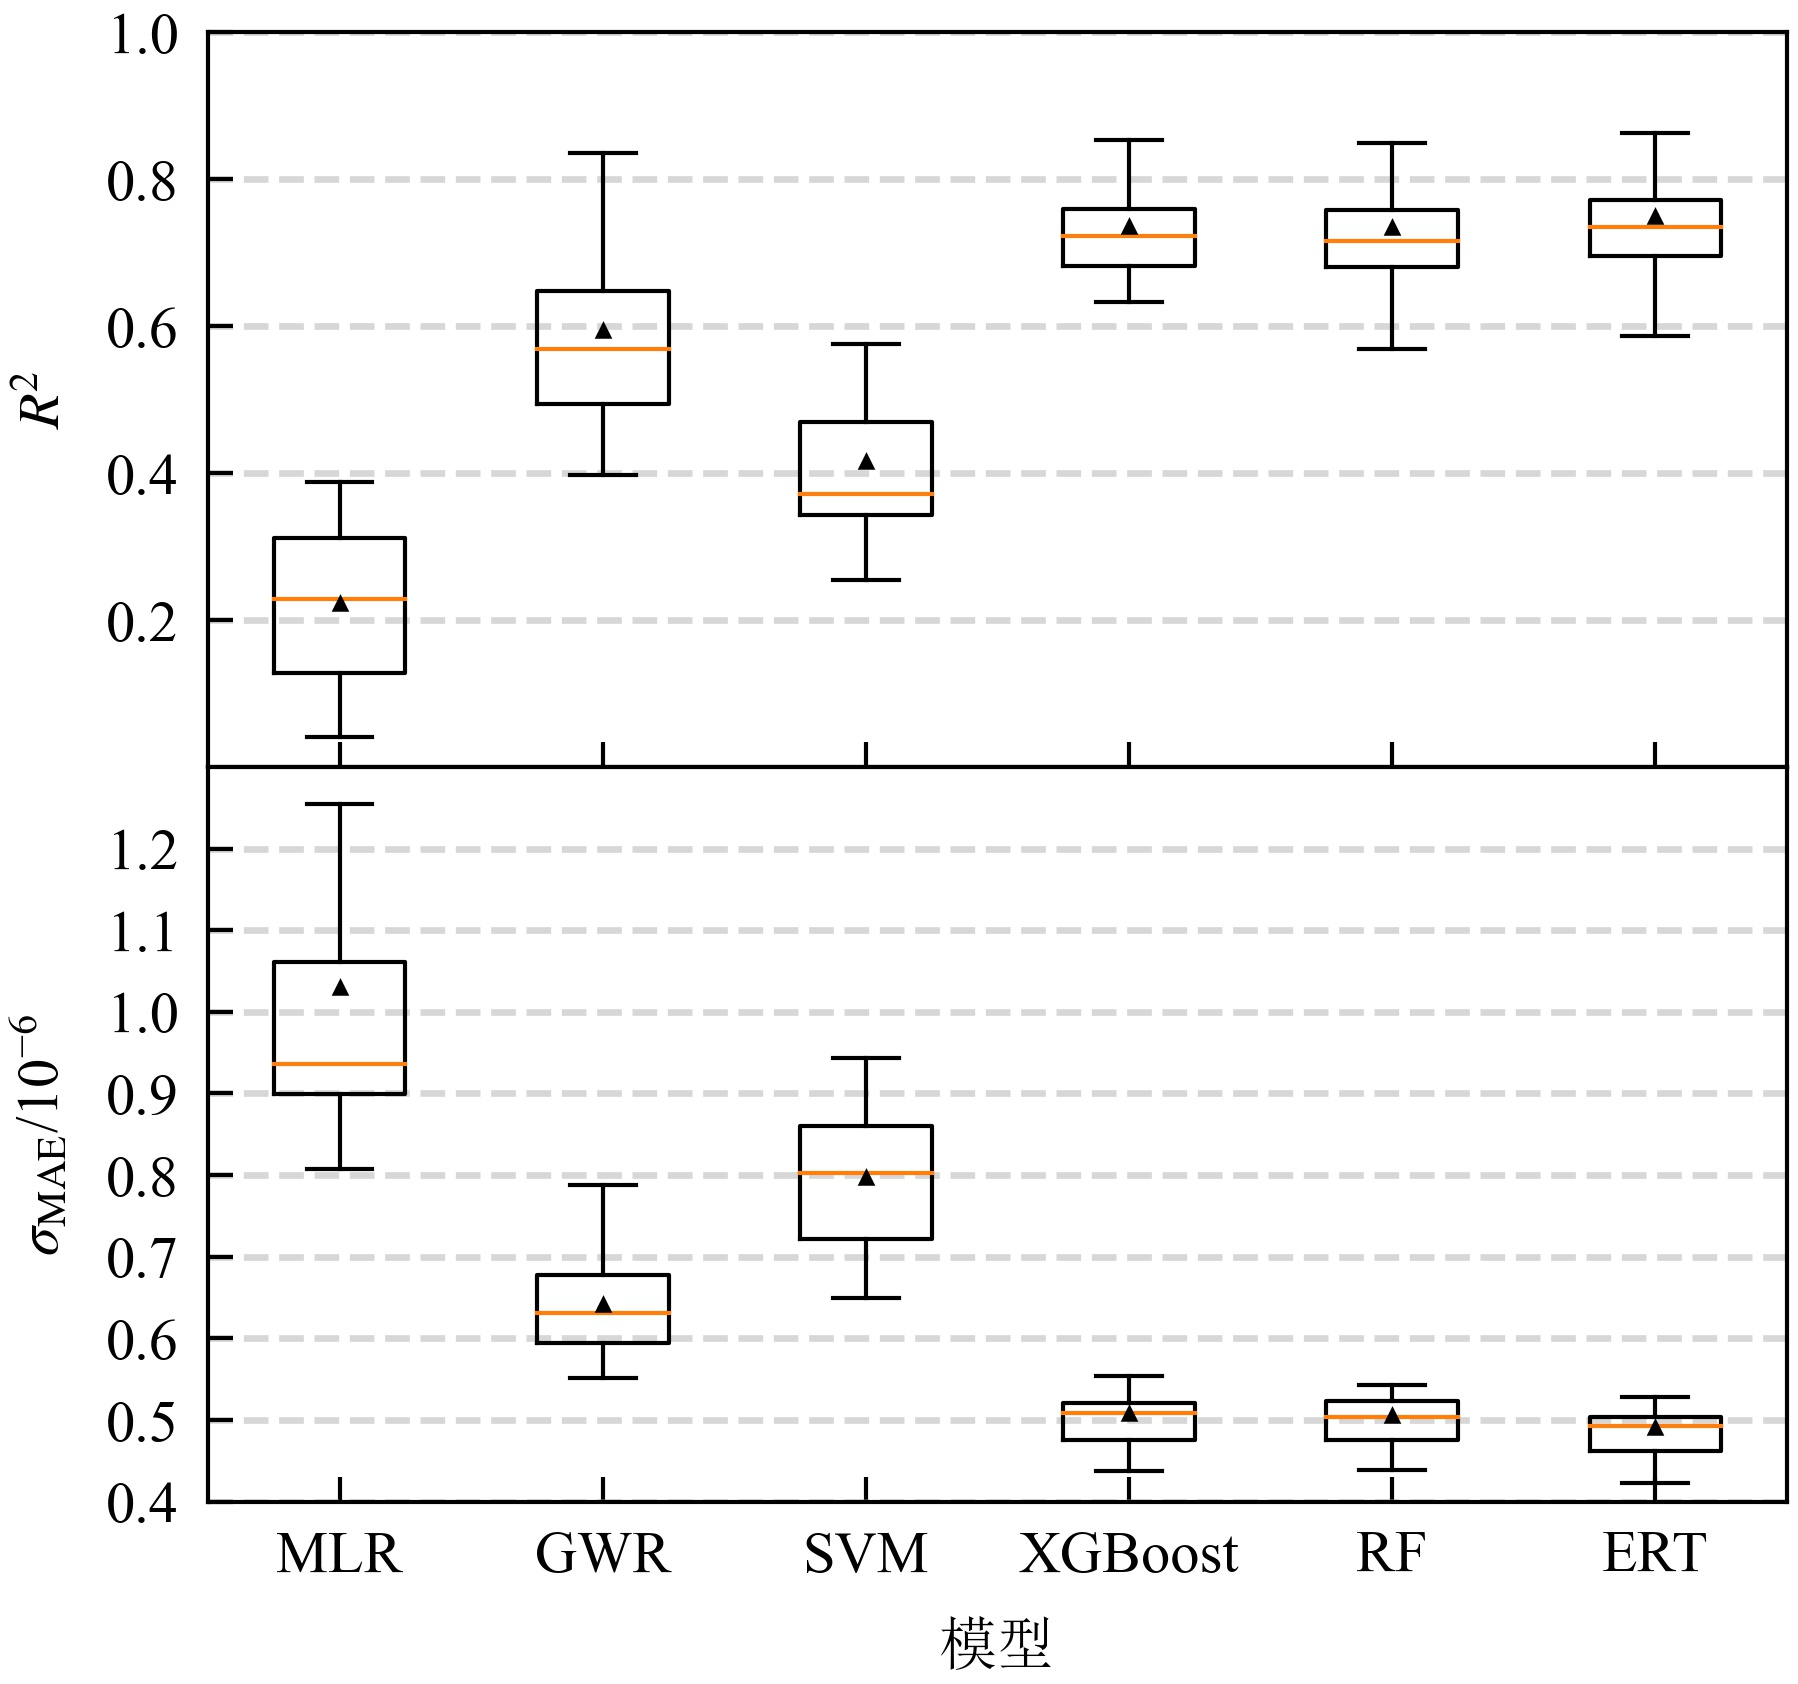
Figure 3 Box plot of cross-validation accuracy for 7 models

Figure 4 Scatter plot of model estimates and remote sensing observations
| 范围 (×10−6) | 数量 | σMBE (×10−6) | σMAE (×10−6) |
|---|---|---|---|
| 395-405 | 22691 | 0.359 | 0.544 |
| 405-415 | 313536 | −0.024 | 0.468 |
| 415-425 | 748 | −1.80 | 1.90 |
Table 3 Error statistics for different intervals of the dataset
| 范围 (×10−6) | 数量 | σMBE (×10−6) | σMAE (×10−6) |
|---|---|---|---|
| 395-405 | 22691 | 0.359 | 0.544 |
| 405-415 | 313536 | −0.024 | 0.468 |
| 415-425 | 748 | −1.80 | 1.90 |
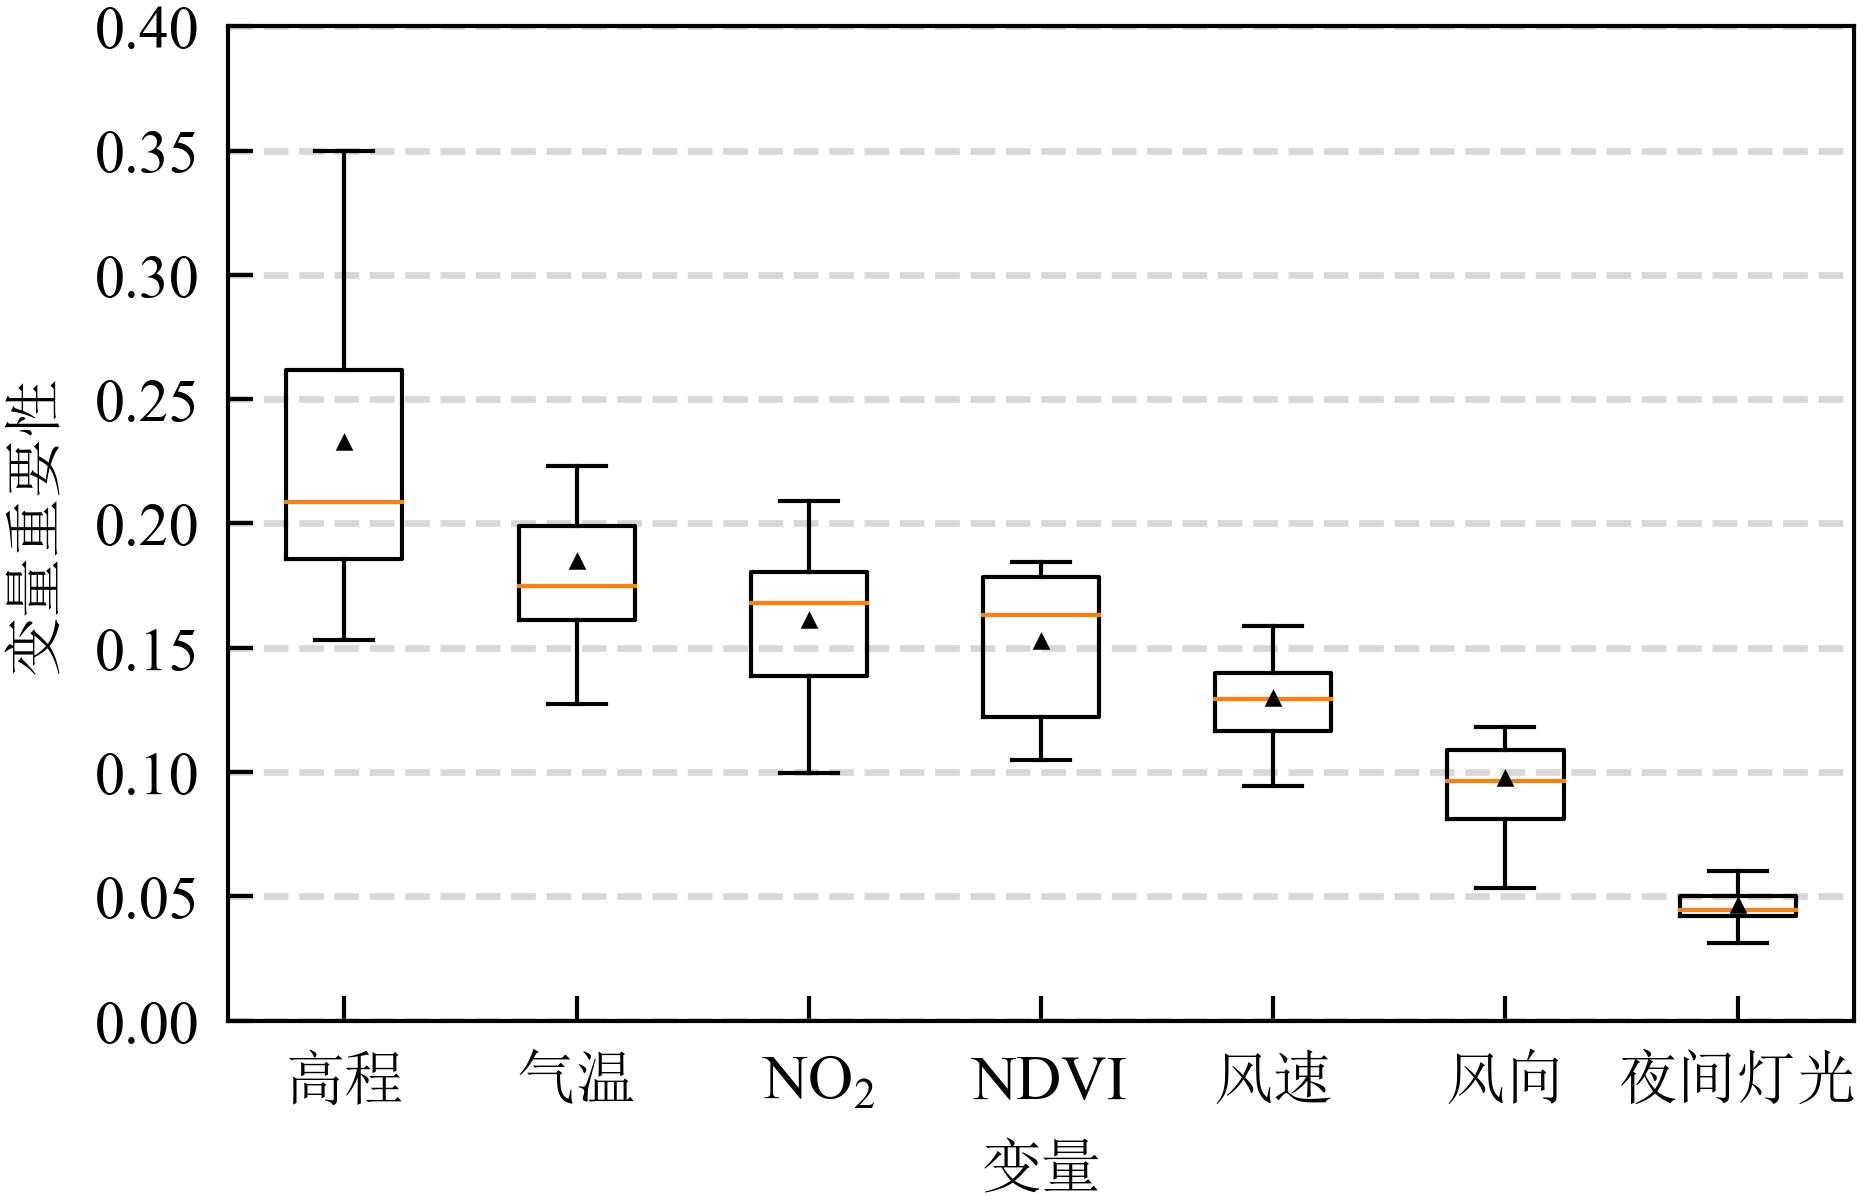
Figure 5 Importance of ERT model variables
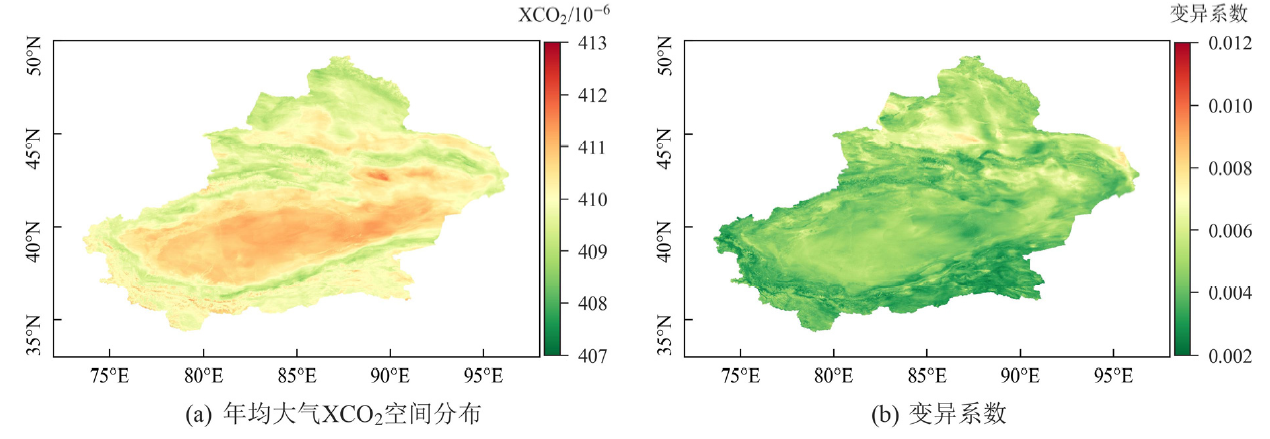
Figure 6 Spatial distribution characteristics of atmospheric XCO2 of Xinjiang Uygur Autonomous Region in 2019
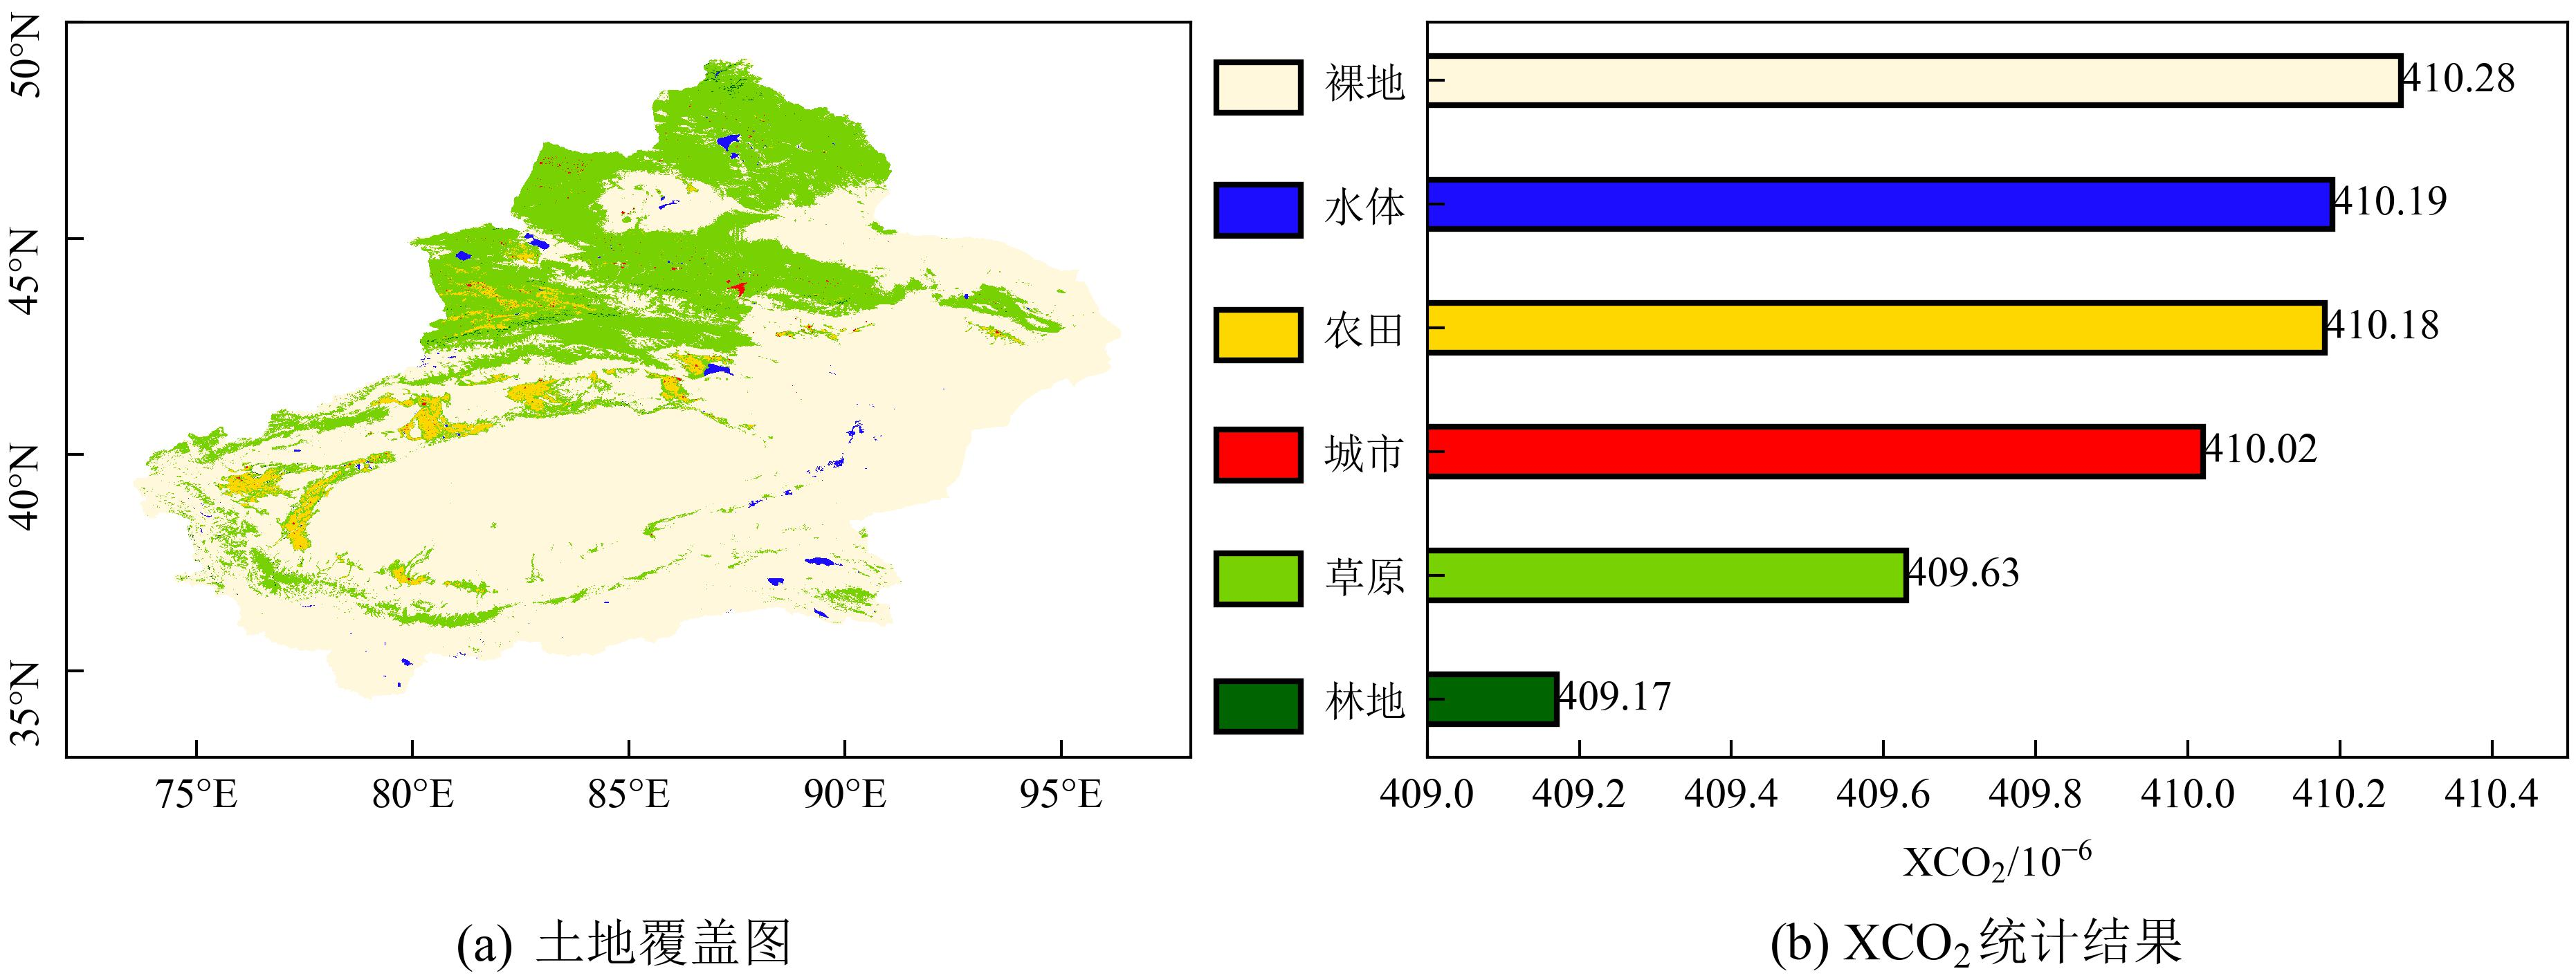
Figure 7 Landcover map and XCO2 statistics results of Xinjiang Uygur Autonomous Region in 2019

Figure 8 Spatial distribution of monthly XCO2 in Xinjiang Uygur Autonomous Region in 2019
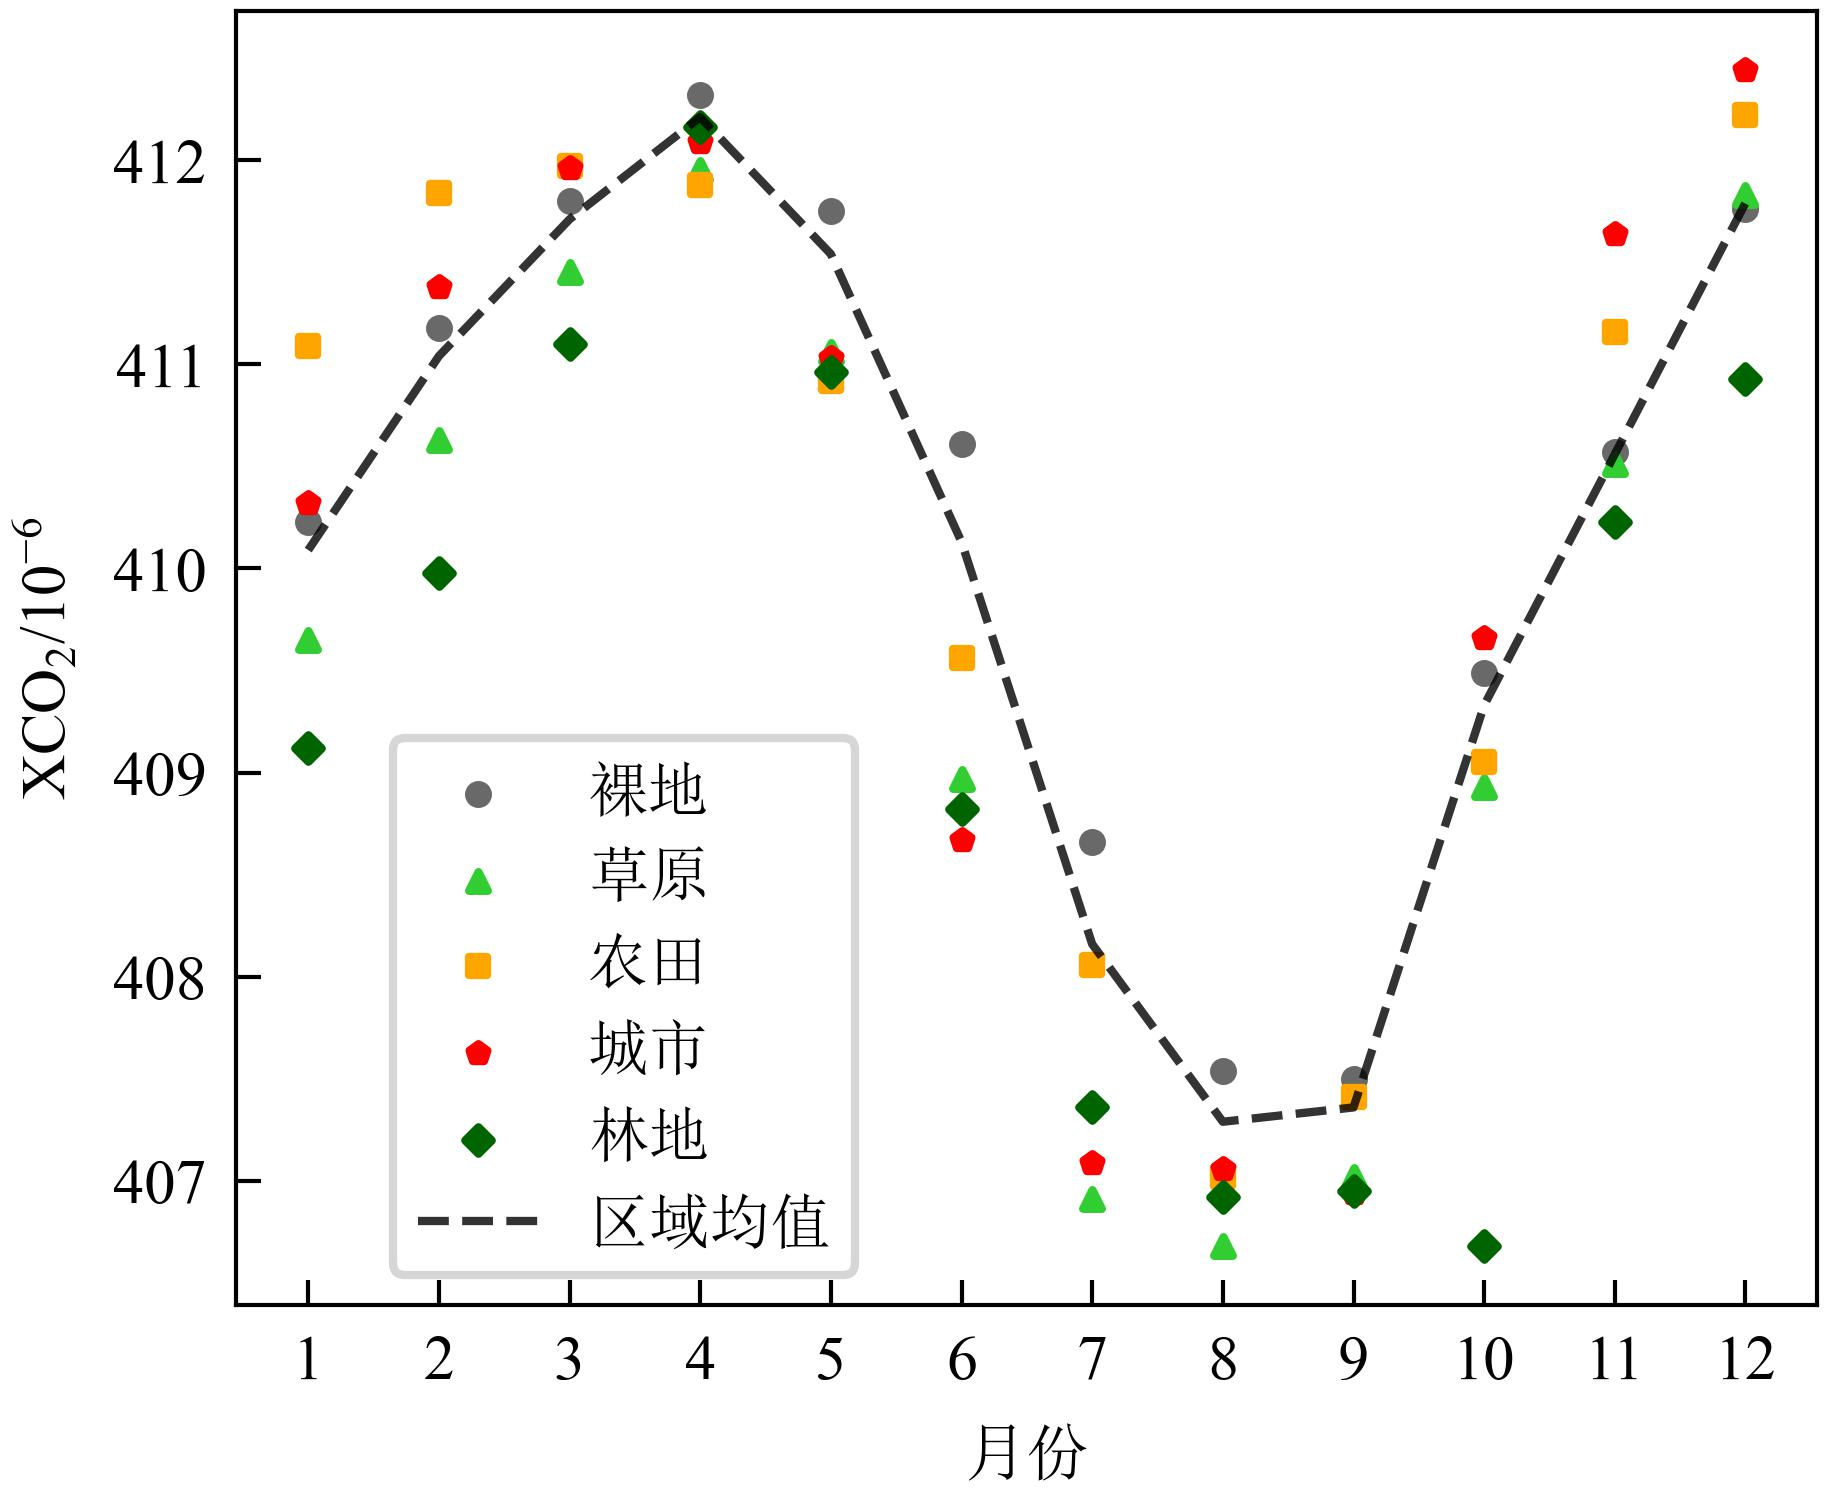
Figure 9 XCO2 changes in different land cover types
| [1] |
AUMANN H H, CHAHINE M T, GAUTIER C, et al., 2003. AIRS/AMSU/ HSB on the aqua mission: Design, science objectives, data products, and processing systems[J]. IEEE Transactions on Geoscience and Remote Sensing, 41(2): 253-264.
DOI URL |
| [2] |
BHATTACHARJEE S, CHEN J, 2020. Prediction of satellite-based column CO2 concentration by combining emission inventory and LULC information[J]. IEEE Transactions on Geoscience and Remote Sensing, 58(12): 8285-8300.
DOI URL |
| [3] |
BOVENSMANN H, BURROWS J P, BUCHWITZ M, et al., 1999. SCIAMACHY: Mission objectives and measurement modes[J]. Journal of the Atmospheric Sciences, 56(2): 127-150.
DOI URL |
| [4] |
BREIMAN L, 2001. Random forests[J]. Machine Learning, 45(1): 5-32.
DOI URL |
| [5] | BRUNSDON C, FOTHERINGHAM S, CHARLTON M, 1998. Geographically weighted regression[J]. Journal of the Royal Statistical Society: Series D (The Statistician), 47(3): 431-443. |
| [6] |
CHEN H P, SUN J Q, 2019. Increased population exposure to extreme droughts in China due to 0.5 ℃ of additional warming[J]. Environmental Research Letters, 14(6): 064011.
DOI |
| [7] |
CHEN J, SHI X Y, GU L, et al., 2023. Impacts of climate warming on global floods and their implication to current flood defense standards[J]. Journal of Hydrology, 618(4): 129236.
DOI URL |
| [8] | CHEN T Q, GUESTRIN C, 2016. Xgboost: A scalable tree boosting system[C]// Proceedings of the 22nd acm sigkdd international conference on knowledge discovery and data mining. San Francisco: Association for Computing Machinery: 785-794. |
| [9] |
CRISP D, POLLOCK H R, ROSENBERG R, et al., 2017. The on-orbit performance of the Orbiting Carbon Observatory-2 (OCO-2) instrument and its radiometrically calibrated products[J]. Atmospheric Measurement Techniques, 10(1): 59-81.
DOI URL |
| [10] |
ELDERING A, WENNBERG P O, CRISP D, et al., 2017. The Orbiting Carbon Observatory-2 early science investigations of regional carbon dioxide fluxes[J]. Science, 358(6360): eaam5745.
DOI URL |
| [11] |
FALAHATKAR S, MOUSAVI S M, FARAJZADEH M, 2017. Spatial and temporal distribution of carbon dioxide gas using GOSAT data over IRAN[J]. Environmental Monitoring and Assessment, 189(12): 627.
DOI PMID |
| [12] |
GEURTS P, ERNST D, WEHENKEL L, 2006. Extremely randomized trees[J]. Machine Learning, 63(1): 3-42.
DOI URL |
| [13] |
GOLKAR F, AL-WARDY M, SAFFARI S F, et al., 2019. Using OCO-2 satellite data for investigating the variability of atmospheric CO2 concentration in relationship with precipitation, relative humidity, and vegetation over Oman[J]. Water, 12(1): 101.
DOI URL |
| [14] |
GUO M, XU J W, WANG X F, et al., 2015. Estimating CO2 concentration during the growing season from MODIS and GOSAT in East Asia[J]. International Journal of Remote Sensing, 36(17): 4363-4383.
DOI URL |
| [15] |
HOEGH-GULDBERG O, JACOB D, TAYLOR M, et al., 2019. The human imperative of stabilizing global climate change at 1.5 ℃[J]. Science, 365(6459): eaaw6974.
DOI URL |
| [16] |
HOFMANN D J, BUTLER J H, TANS P P, 2009. A new look at atmospheric carbon dioxide[J]. Atmospheric Environment, 43(12): 2084-2086.
DOI URL |
| [17] |
JONES M W, PETERS G P, GASSER T, et al., 2023. National contributions to climate change due to historical emissions of carbon dioxide, methane, and nitrous oxide since 1850[J]. Scientific Data, 10(1): 155.
DOI PMID |
| [18] |
KIEL M, O’DELL C W, FISHER B, et al., 2019. How bias correction goes wrong: measurement of XCO2 affected by erroneous surface pressure estimates[J]. Atmospheric Measurement Techniques, 12(4): 2241-2259.
DOI URL |
| [19] |
KIM J B, SO J M, BAE D H, 2020. Global warming impacts on severe drought characteristics in Asia monsoon region[J]. Water, 12(5): 1360.
DOI URL |
| [20] |
LI J, JIA K, WEI X Q, et al., 2022. High-spatiotemporal resolution mapping of spatiotemporally continuous atmospheric CO2 concentrations over the global continent[J]. International Journal of Applied Earth Observation and Geoinformation, 108: 102743.
DOI URL |
| [21] |
LIU Q W, WU S M, LEI Y L, et al., 2021. Exploring spatial characteristics of city-level CO2 emissions in China and their influencing factors from global and local perspectives[J]. Science of the Total Environment, 754: 142206.
DOI URL |
| [22] |
LIU Y, WANG X F, GUO M, et al., 2012. Mapping the FTS SWIR L2 product of XCO2 and XCH4 data from the GOSAT by the Kriging method: A case study in East Asia[J]. International Journal of Remote Sensing, 33(10): 3004-3025.
DOI URL |
| [23] |
PARK C, JEONG S, PARK H, et al., 2021. Evaluation of the potential use of satellite-derived XCO2 in detecting CO2 enhancement in megacities with limited ground observations: A case study in Seoul using orbiting carbon Observatory-2[J]. Asia-Pacific Journal of Atmospheric Sciences, 57(2): 289-299.
DOI |
| [24] |
RAN Y H, LI X, 2019. TanSat: A new star in global carbon monitoring from China[J]. Science Bulletin, 64(5): 284-285.
DOI PMID |
| [25] |
SIABI Z, FALAHATKAR S, ALAVI S J, 2019. Spatial distribution of XCO2 using OCO-2 data in growing seasons[J]. Journal of Environmental Management, 244: 110-118.
DOI URL |
| [26] |
SMOLA A J, SCHÖLKOPF B, 2004. A tutorial on support vector regression[J]. Statistics and Computing, 14(3): 199-222.
DOI URL |
| [27] |
WANG L B, ROHLI R V, LIN Q G, et al., 2022. Impact of extreme heatwaves on population exposure in China due to additional warming[J]. Sustainability, 14(18): 11458.
DOI URL |
| [28] |
WATANABE H, HAYASHI K, SAEKI T, et al., 2015. Global mapping of greenhouse gases retrieved from GOSAT Level 2 products by using a kriging method[J]. International Journal of Remote Sensing, 36(6): 1509-1528.
DOI URL |
| [29] |
YANG D X, LIU Y, CAI Z N, et al., 2018. First global carbon dioxide maps produced from TanSat measurements[J]. Advances in Atmospheric Sciences, 35(6): 621-623.
DOI |
| [30] |
YOKOTA T, YOSHIDA Y, EGUCHI N, et al., 2009. Global concentrations of CO2 and CH4 retrieved from GOSAT: First preliminary results[J]. Sola, 5: 160-163.
DOI URL |
| [31] |
ZENG Z C, LEI L P, STRONG K, et al., 2017. Global land mapping of satellite-observed CO2 total columns using spatio-temporal geostatistics[J]. International Journal of Digital Earth, 10(4): 426-456.
DOI URL |
| [32] |
ZHANG M Q, LIU G J, 2023. Mapping contiguous XCO2 by machine learning and analyzing the spatio-temporal variation in China from 2003 to 2019[J]. Science of The Total Environment, 858(Part 2): 159588.
DOI URL |
| [33] | 陈慧, 缪启龙, 买买提艾力·买买提依明, 等, 2015. 塔克拉玛干沙漠腹地春、夏季CO2通量特征[J]. 干旱区地理, 38(3): 487-493. |
| CHEN H, MIAO Q L, ALI M, et al., 2015. CO2 flux characteristics of Taklimakan Desert in spring and summer[J]. Arid Land Geography, 38(3): 487-493. | |
| [34] | 陈良富, 尚华哲, 范萌, 等, 2021. 高分五号卫星大气参数探测综述[J]. 遥感学报, 25(9): 1917-1931. |
|
CHEN L F, SHANG H Z, FAN M, et al., 2021. Mission overview of the GF-5 satellite for atmospheric parameter monitoring[J]. National Remote Sensing Bulletin, 25(9): 1917-1931.
DOI URL |
|
| [35] | 付宏臣, 孙艳玲, 陈莉, 等, 2020. 基于AOD数据与GWR模型的2016年新疆地区PM2.5和PM10时空分布特征[J]. 环境科学学报, 40(1): 27-35. |
| FU H C, SUN Y L, CHEN L, et al., 2020. Temporal and spatial distribution characteristics of PM2.5 and PM10 in Xinjiang region in 2016 based on AOD data and GWR model[J]. Acta Scientiae Circumstantiae, 40(1): 27-35. | |
| [36] | 刘良云, 陈良富, 刘毅, 等, 2022. 全球碳盘点卫星遥感监测方法、进展与挑战[J]. 遥感学报, 26(2): 243-267. |
|
LIU L Y, CHEN L F, LIU Y, et al., 2022. Satellite remote sensing for global stocktaking: methods, progress and perspectives[J]. National Remote Sensing Bulletin, 26(2): 243-267.
DOI URL |
|
| [37] | 孟倩文, 尹球, 2016. 中国区域CO2多年时空变化的卫星遥感分析[J]. 遥感技术与应用, 31(2): 203-213. |
| MENG Q W, YIN Q, 2016. Remote sensing analysis of multi-years spatial and temporal variation of CO2 in China[J]. Remote Sensing Technology and Application, 31(2): 203-213. | |
| [38] | 莫露, 巫兆聪, 张熠, 2021. 中国XCO2时空分布与影响因素分析[J]. 中国环境科学, 41(6): 2562-2570. |
| MO L, WU Z C, ZHANG Y, 2021. Spatial and temporal variations of XCO2 in China and its influencing factors analysis[J]. China Environmental Science, 41(6): 2562-2570. | |
| [39] | 肖钟湧, 陈颖锋, 林晓凤, 等, 2022. 基于多源卫星遥感数据的中国2003年-2018年CO2时空变化研究[J]. 遥感学报, 26(12): 2486-2496. |
|
XIAO Z Y, CHEN Y F, LIN X F et al., 2022. The temporal and spatial variation of CO2 column concentration over China from 2003 to 2018 based on multi-source satellite remote sensing data[J]. National Remote Sensing Bulletin, 26(12): 2486-2496.
DOI URL |
| [1] | WEI Xiaofeng, HAN Hong, YAN Xuejun, WANG Zaifeng, LI Shengzeng, TIAN Yong, LIANG Di, MA Mingliang, ZHANG Guiqin. Source Apportionment of PM2.5 during Heavy Pollution Process in Ji'nan Based on Satellite Remote Sensing and CMB Model [J]. Ecology and Environment, 2022, 31(6): 1175-1183. |
| [2] | WANG Jinjie, ZHAO Anzhou, HU Xiaofeng. Spatiotemporal Distribution of Vegetation Net Primary Productivity in Beijing-Tianjin-Hebei and Natural Driving Factors [J]. Ecology and Environment, 2021, 30(6): 1158-1167. |
| Viewed | ||||||
|
Full text |
|
|||||
|
Abstract |
|
|||||
Copyright © 2021 Editorial Office of ACTA PETROLEI SINICA
Address:No. 6 Liupukang Street, Xicheng District, Beijing, P.R.China, 510650
Tel: 86-010-62067128, 86-010-62067137, 86-010-62067139
Fax: 86-10-62067130
Email: syxb@cnpc.com.cn
Support byBeijing Magtech Co.ltd, E-mail:support@magtech.com.cn