Ecology and Environment ›› 2024, Vol. 33 ›› Issue (1): 80-91.DOI: 10.16258/j.cnki.1674-5906.2024.01.009
• Research Article • Previous Articles Next Articles
WANG Chuanyang1( ), ZHANG Xiaoling1,2,*(), LAN Linhui1, PAN Jie1
Received:2023-07-03
Online:2024-01-18
Published:2024-03-19
Contact:
ZHANG Xiaoling
王传扬1(), 张小玲1,2,*(), 兰琳惠1, 潘婕1
通讯作者:
张小玲
作者简介:王传扬(2000年生),男,硕士研究生,研究方向为大气环境。E-mail: 18061171646@163.com
基金资助:CLC Number:
WANG Chuanyang, ZHANG Xiaoling, LAN Linhui, PAN Jie. Analysis of the Impact of High Temperature and Drought on the Concentration Changes of Pollutants in the Sichuan Basin in Summer of 2022[J]. Ecology and Environment, 2024, 33(1): 80-91.
王传扬, 张小玲, 兰琳惠, 潘婕. 2022年夏季高温干旱对四川盆地污染物浓度变化的影响分析[J]. 生态环境学报, 2024, 33(1): 80-91.
Add to citation manager EndNote|Ris|BibTeX
URL: https://www.jeesci.com/EN/10.16258/j.cnki.1674-5906.2024.01.009

Figure 1 Monthly average 500 hPa geopotential height field in the summer of 2021 and 2022
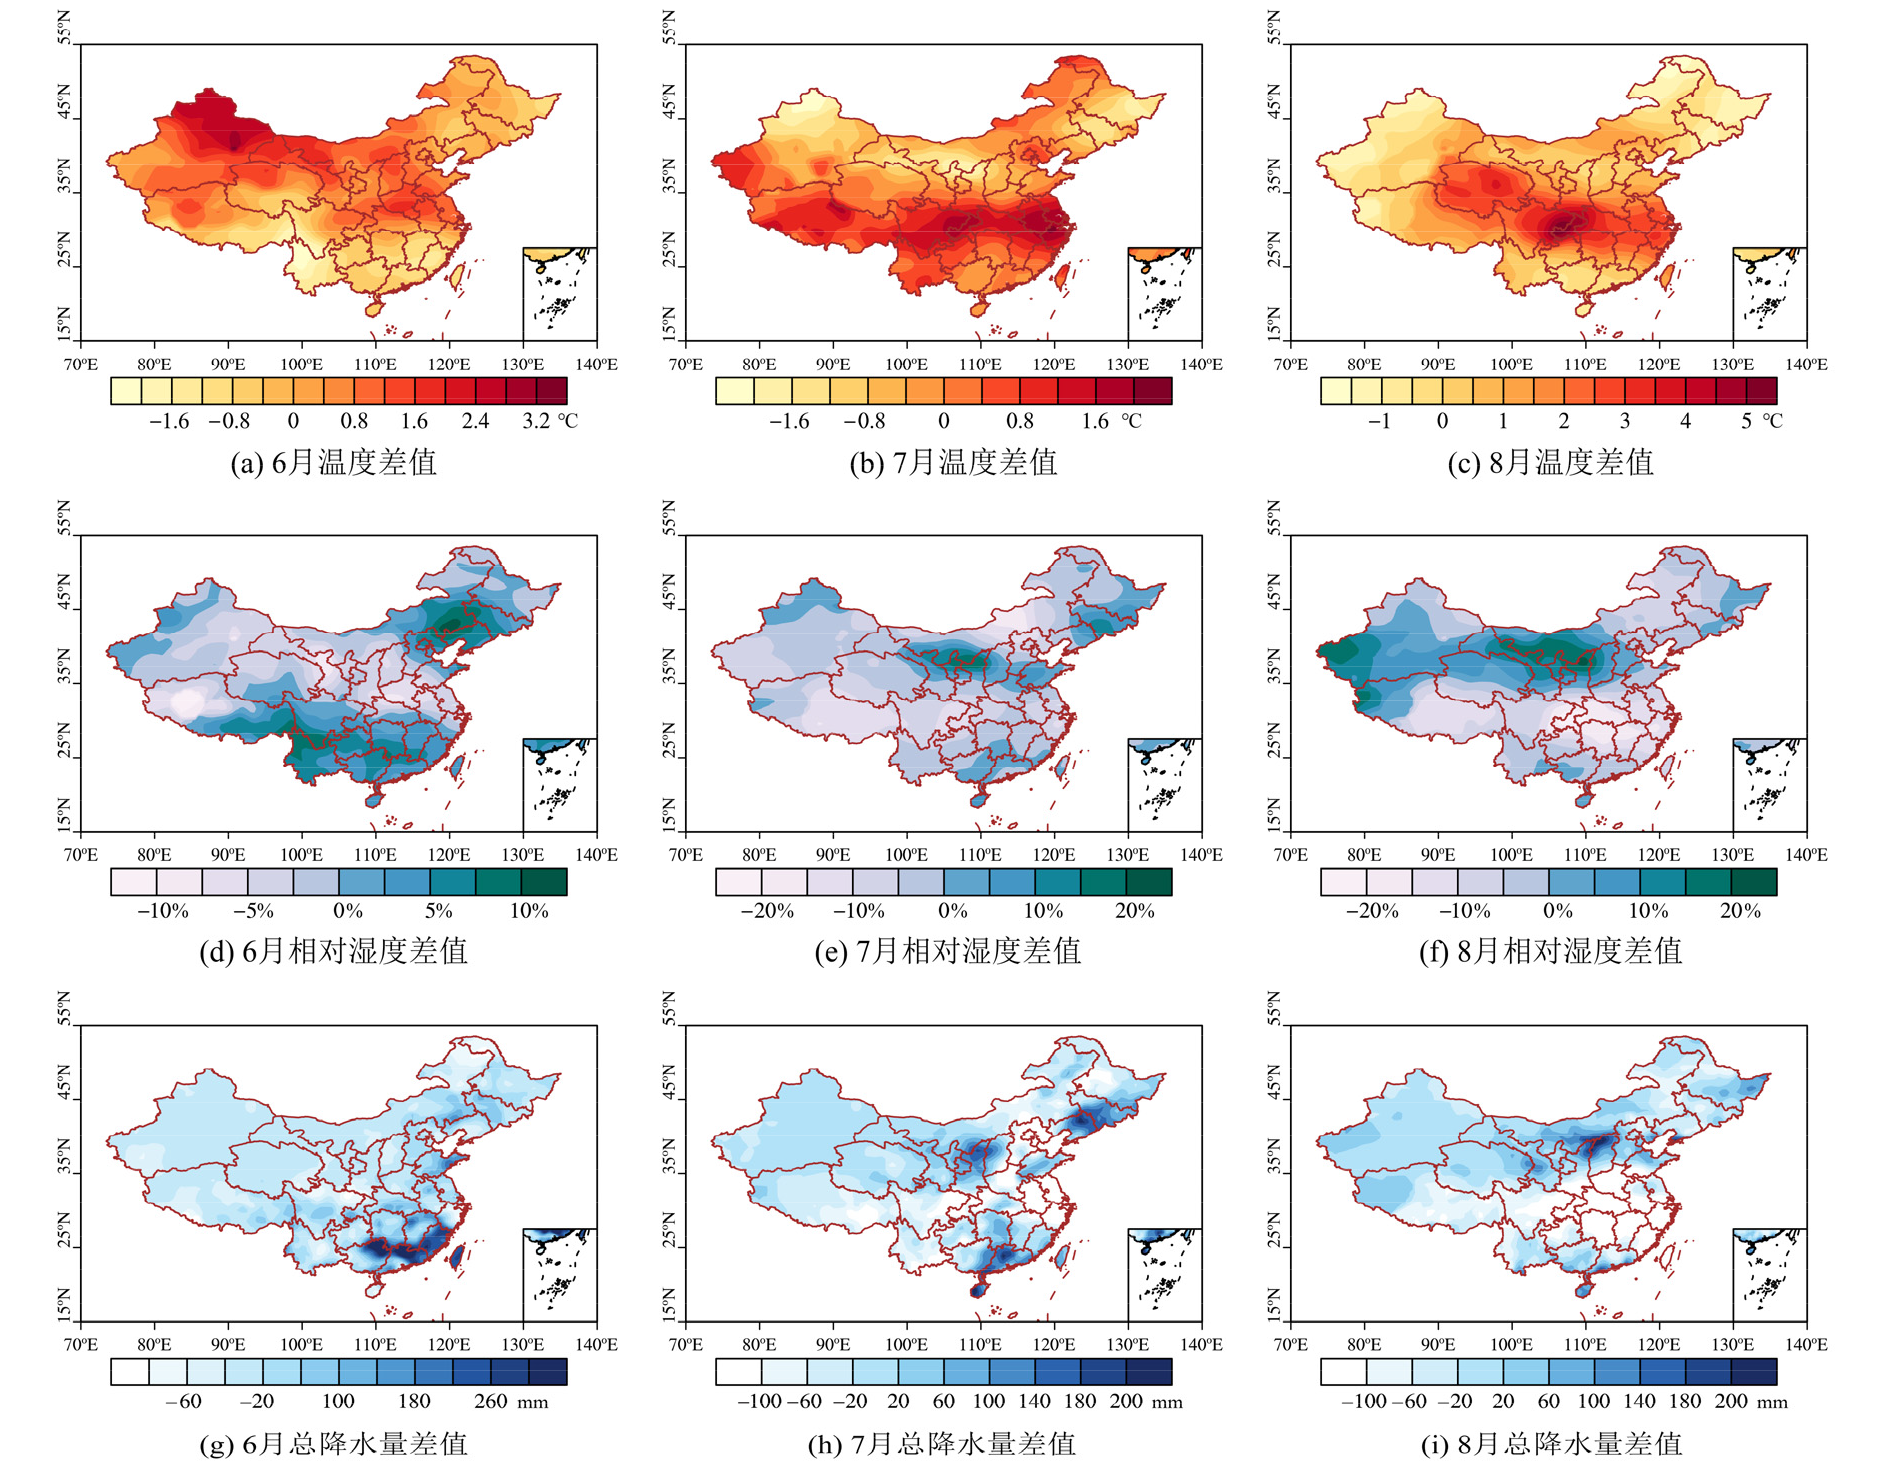
Figure 2 Difference between surface meteorological elements in the summer of 2022 and the same period in 2021

Figure 3 Differencesin O3 and PM2.5 concentrations between the summer months of 2022 and the same period in 2021

Figure 4 The spatial distribution of surface meteorological elements in the Sichuan andChongqing region during the summer of 2022 and the average values of the same period from 2015 to 2021

Figure 5 Anomalous distribution of O3 concentration in the summer months of 2022 in the Sichuan and Chongqing region compared to the average value of the same period from 2015 to 2021
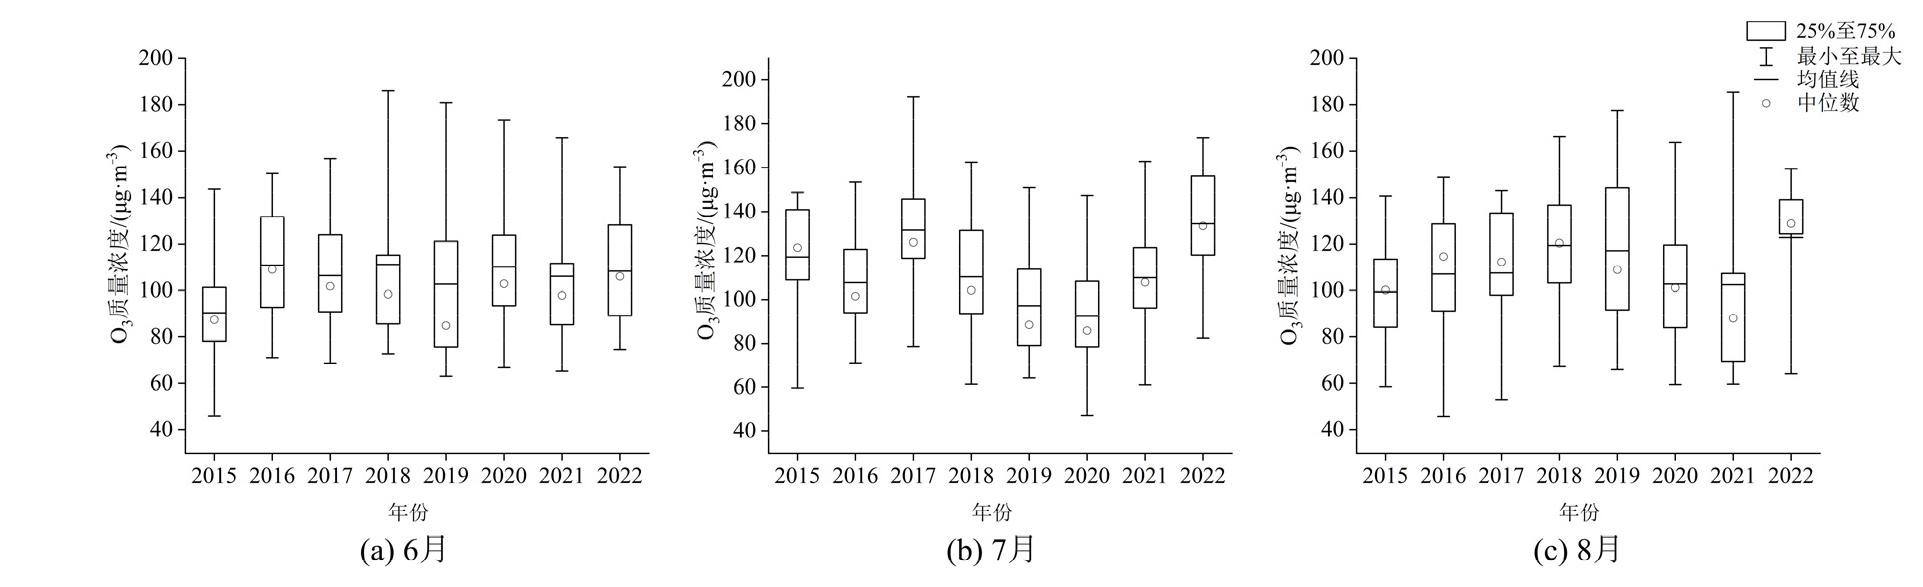
Figure 6 Box plot of monthly O3 concentration in the Sichuan Basin in summer from 2015 to 2022
| 城市 | 年份 | |||||||
|---|---|---|---|---|---|---|---|---|
| 2015 | 2016 | 2017 | 2018 | 2019 | 2020 | 2021 | 2022 | |
| 重庆 | 88.09(3) | 101.53(6) | 112.83(26) | 125.30(24) | 113.54(18) | 102.07(11) | 98.31(10) | 112.92(4) |
| 成都 | 130.68(32) | 139.06(29) | 135.39(27) | 123.25(19) | 118.83(17) | 121.89(21) | 120.57(16) | 146.32(40) |
| 绵阳 | 99.11(5) | 103.66(6) | 101.38(0) | 108.35(5) | 104.28(8) | 102.37(4) | 108.23(9) | 128.83(18) |
| 德阳 | 114.23(10) | 125.84(20) | 128.30(20) | 112.11(11) | 109.55(13) | 114.89(14) | 117.23(11) | 136.80(28) |
| 遂宁 | 106.73(8) | 130.76(16) | 123.82(13) | 111.93(9) | 99.82(7) | 97.37(2) | 99.36(8) | 121.55(7) |
| 眉山 | 125.18(15) | 123.08(9) | 131.53(12) | 123.48(13) | 121.22(15) | 114.32(10) | 119.62(13) | 143.33(34) |
| 雅安 | 56.91(0) | 98.14(1) | 107.76(5) | 97.58(0) | 98.88(5) | 94.38(0) | 95.89(4) | 116.00(8) |
| 资阳 | 118.31(12) | 121.88(13) | 119.32(5) | 115.25(11) | 107.14(11) | 107.90(6) | 107.49(8) | 134.49(16) |
| 乐山 | 106.10(2) | 116.51(8) | 126.10(10) | 90.47(1) | 103.60(8) | 104.52(5) | 113.76(7) | 132.04(22) |
| 泸州 | 84.23(1) | 117.93(14) | 113.93(10) | 116.32(11) | 107.27(13) | 106.84(5) | 108.85(8) | 121.51(15) |
| 自贡 | 101.15 (0) | 84.87(0) | 118.35(18) | 127.77(19) | 112.60(13) | 110.38(6) | 114.42(10) | 128.59(16) |
| 内江 | 118.34 (13) | 125.35(12) | 126.98(13) | 115.80(11) | 100.39(9) | 101.89(5) | 107.14(10) | 128.37(18) |
| 宜宾 | 99.75(1) | 108.56(5) | 117.37(6) | 113.95(11) | 109.85(10) | 106.16(5) | 109.09(7) | 128.00(20) |
| 南充 | 85.47(7) | 89.82(0) | 121.58(11) | 111.83(6) | 92.92(1) | 78.46(0) | 85.75(0) | 109.69(0) |
| 广元 | 105.45(4) | 104.10(2) | 98.75(0) | 91.53(1) | 76.93(0) | 83.96(0) | 88.41(4) | 103.57(0) |
| 广安 | 118.29(15) | 118.53(10) | 115.74(6) | 116.35(11) | 103.76(9) | 100.53(3) | 102.00(8) | 121.54(6) |
| 达州 | 89.65(2) | 89.32(0) | 95.66(1) | 123.11(9) | 93.93(3) | 77.98(0) | 76.83(2) | 96.80(2) |
| 巴中 | 98.12(1) | 67.63(0) | 93.52(0) | 89.96(1) | 79.47(0) | 75.49(0) | 79.94(0) | 100.64(0) |
| 平均 | 102.54(7) | 109.25(8) | 116.59(10) | 111.91(10) | 103.00(9) | 100.08(5) | 102.94(7) | 122.83(14) |
Table 1 Statistics on O3 concentration and O3 exceeding days in 18 cities in the Sichuan Basin during the summer from 2015 to 2022 μg·m?3·d?1
| 城市 | 年份 | |||||||
|---|---|---|---|---|---|---|---|---|
| 2015 | 2016 | 2017 | 2018 | 2019 | 2020 | 2021 | 2022 | |
| 重庆 | 88.09(3) | 101.53(6) | 112.83(26) | 125.30(24) | 113.54(18) | 102.07(11) | 98.31(10) | 112.92(4) |
| 成都 | 130.68(32) | 139.06(29) | 135.39(27) | 123.25(19) | 118.83(17) | 121.89(21) | 120.57(16) | 146.32(40) |
| 绵阳 | 99.11(5) | 103.66(6) | 101.38(0) | 108.35(5) | 104.28(8) | 102.37(4) | 108.23(9) | 128.83(18) |
| 德阳 | 114.23(10) | 125.84(20) | 128.30(20) | 112.11(11) | 109.55(13) | 114.89(14) | 117.23(11) | 136.80(28) |
| 遂宁 | 106.73(8) | 130.76(16) | 123.82(13) | 111.93(9) | 99.82(7) | 97.37(2) | 99.36(8) | 121.55(7) |
| 眉山 | 125.18(15) | 123.08(9) | 131.53(12) | 123.48(13) | 121.22(15) | 114.32(10) | 119.62(13) | 143.33(34) |
| 雅安 | 56.91(0) | 98.14(1) | 107.76(5) | 97.58(0) | 98.88(5) | 94.38(0) | 95.89(4) | 116.00(8) |
| 资阳 | 118.31(12) | 121.88(13) | 119.32(5) | 115.25(11) | 107.14(11) | 107.90(6) | 107.49(8) | 134.49(16) |
| 乐山 | 106.10(2) | 116.51(8) | 126.10(10) | 90.47(1) | 103.60(8) | 104.52(5) | 113.76(7) | 132.04(22) |
| 泸州 | 84.23(1) | 117.93(14) | 113.93(10) | 116.32(11) | 107.27(13) | 106.84(5) | 108.85(8) | 121.51(15) |
| 自贡 | 101.15 (0) | 84.87(0) | 118.35(18) | 127.77(19) | 112.60(13) | 110.38(6) | 114.42(10) | 128.59(16) |
| 内江 | 118.34 (13) | 125.35(12) | 126.98(13) | 115.80(11) | 100.39(9) | 101.89(5) | 107.14(10) | 128.37(18) |
| 宜宾 | 99.75(1) | 108.56(5) | 117.37(6) | 113.95(11) | 109.85(10) | 106.16(5) | 109.09(7) | 128.00(20) |
| 南充 | 85.47(7) | 89.82(0) | 121.58(11) | 111.83(6) | 92.92(1) | 78.46(0) | 85.75(0) | 109.69(0) |
| 广元 | 105.45(4) | 104.10(2) | 98.75(0) | 91.53(1) | 76.93(0) | 83.96(0) | 88.41(4) | 103.57(0) |
| 广安 | 118.29(15) | 118.53(10) | 115.74(6) | 116.35(11) | 103.76(9) | 100.53(3) | 102.00(8) | 121.54(6) |
| 达州 | 89.65(2) | 89.32(0) | 95.66(1) | 123.11(9) | 93.93(3) | 77.98(0) | 76.83(2) | 96.80(2) |
| 巴中 | 98.12(1) | 67.63(0) | 93.52(0) | 89.96(1) | 79.47(0) | 75.49(0) | 79.94(0) | 100.64(0) |
| 平均 | 102.54(7) | 109.25(8) | 116.59(10) | 111.91(10) | 103.00(9) | 100.08(5) | 102.94(7) | 122.83(14) |
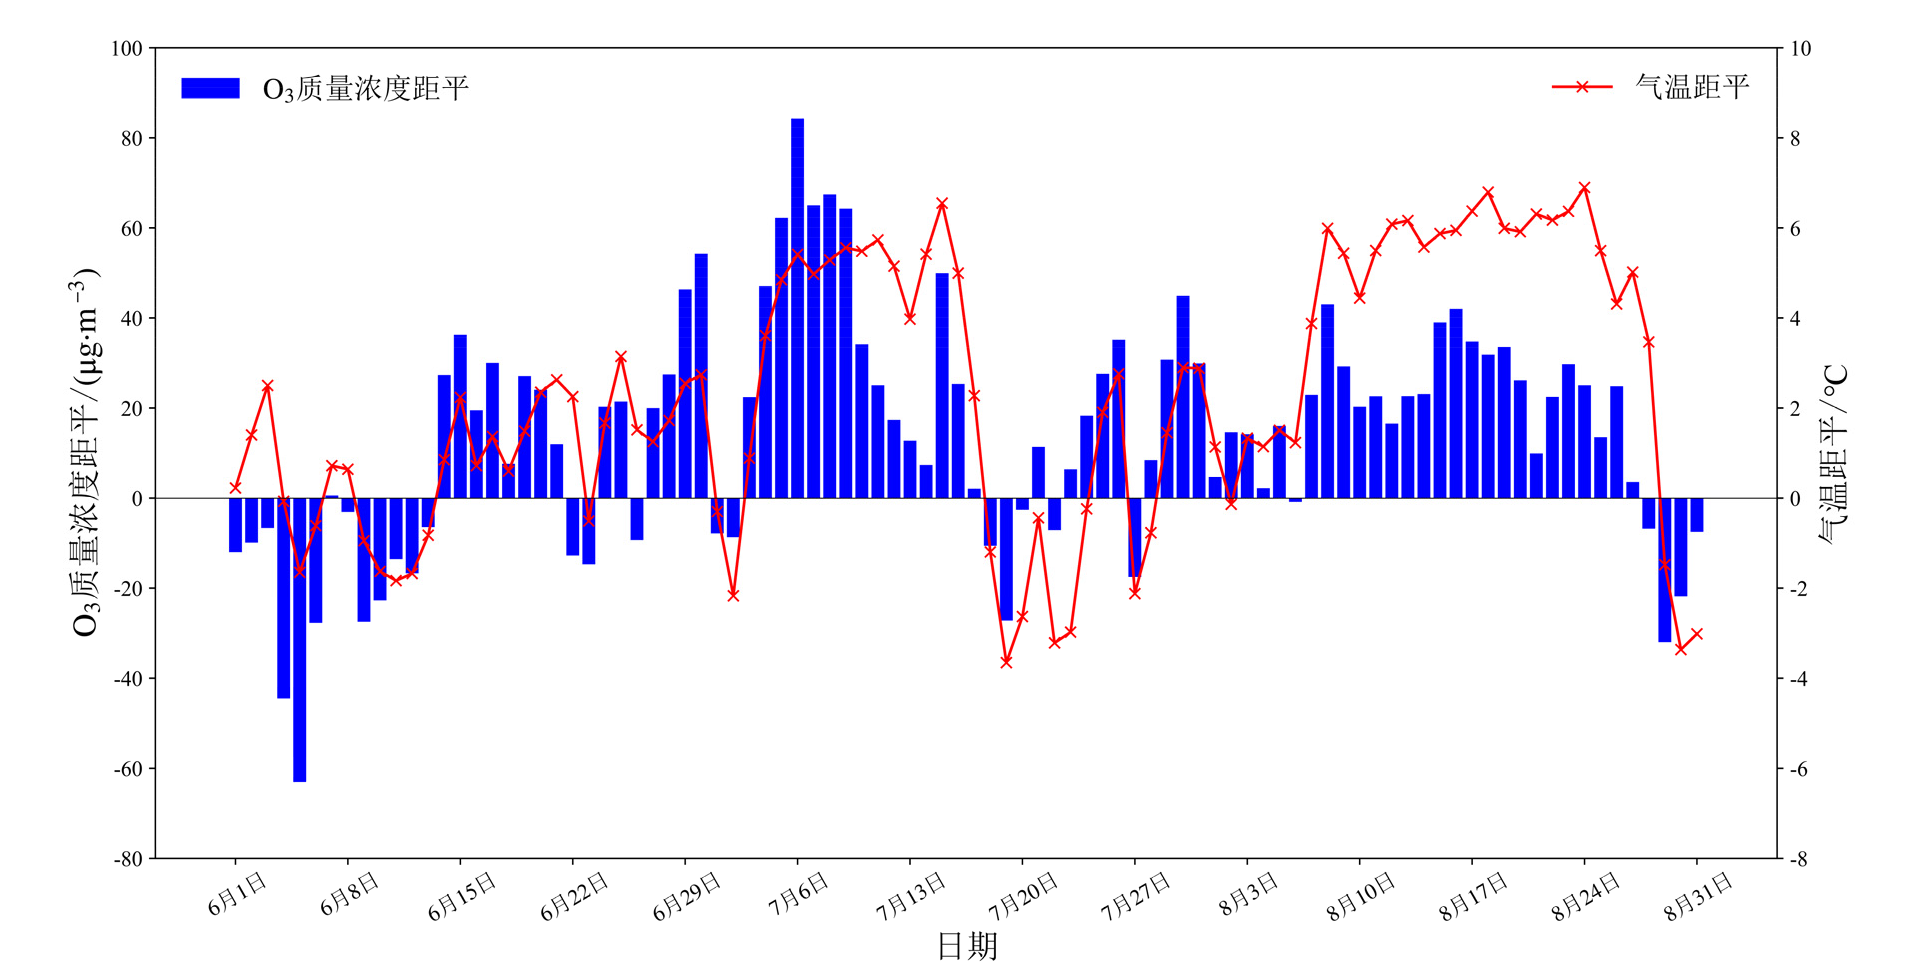
Figure 7 Daily O3-8h concentration and temperature anomaly in the Sichuan Basin from June to August in 2022 compared to the same period average from 2015 to 2021
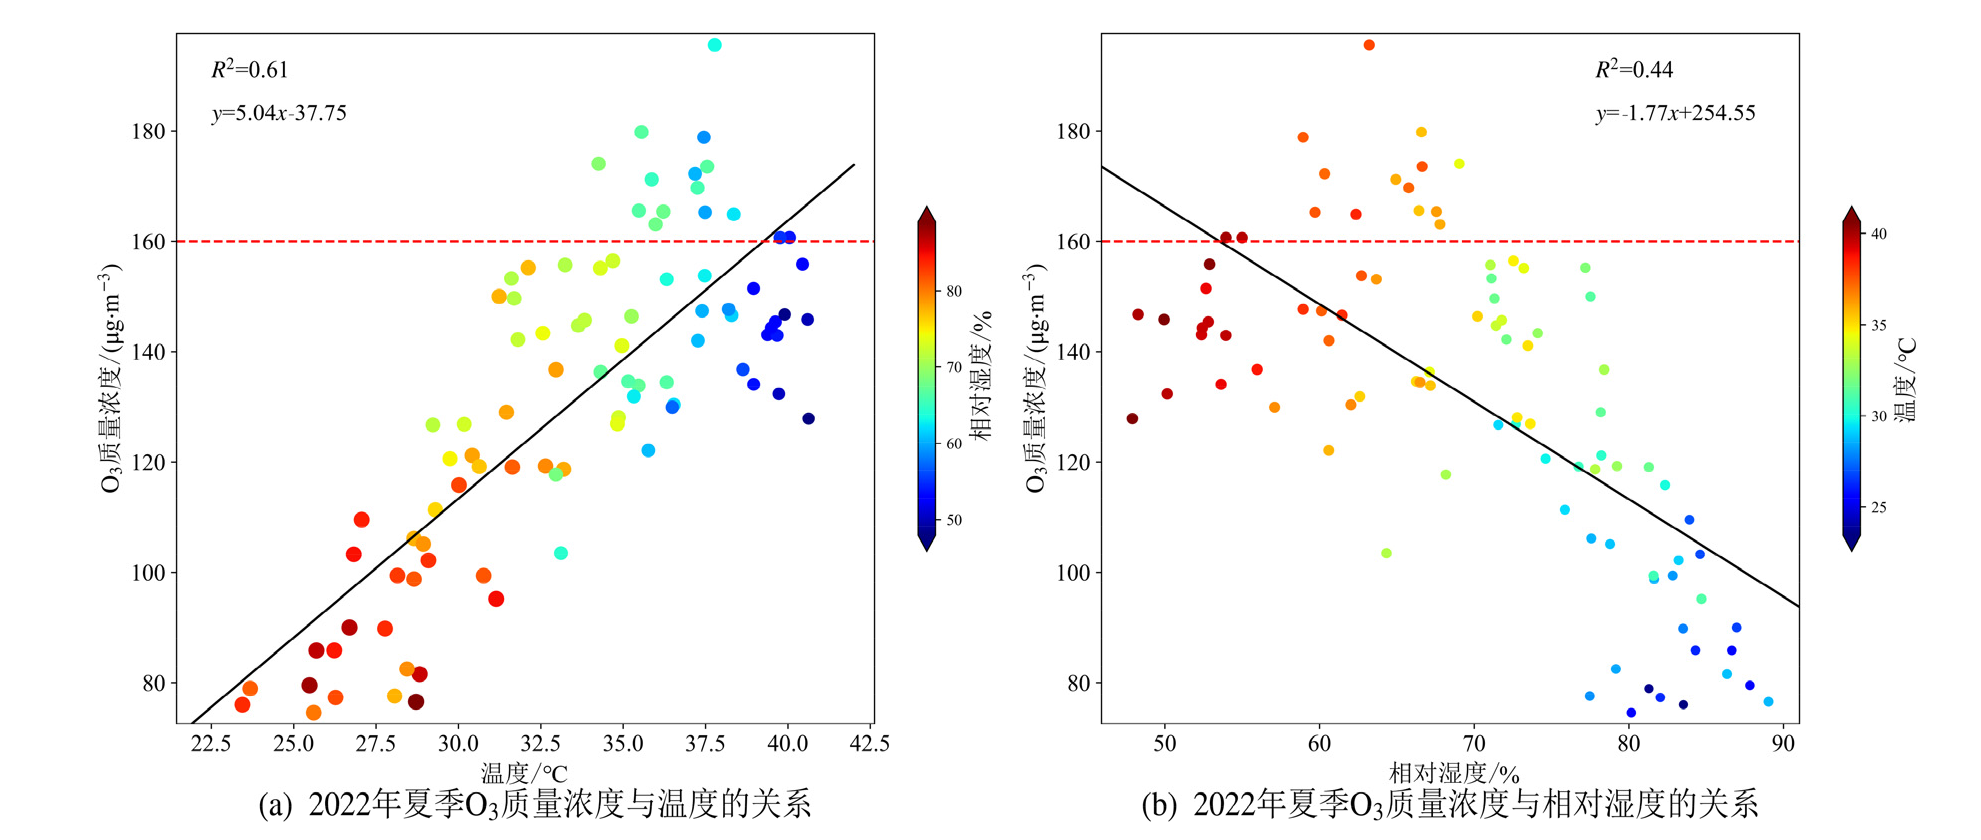
Figure 8 Relationship between O3 concentration, temperature and relative humidity in the Sichuan Basin in summer of 2022
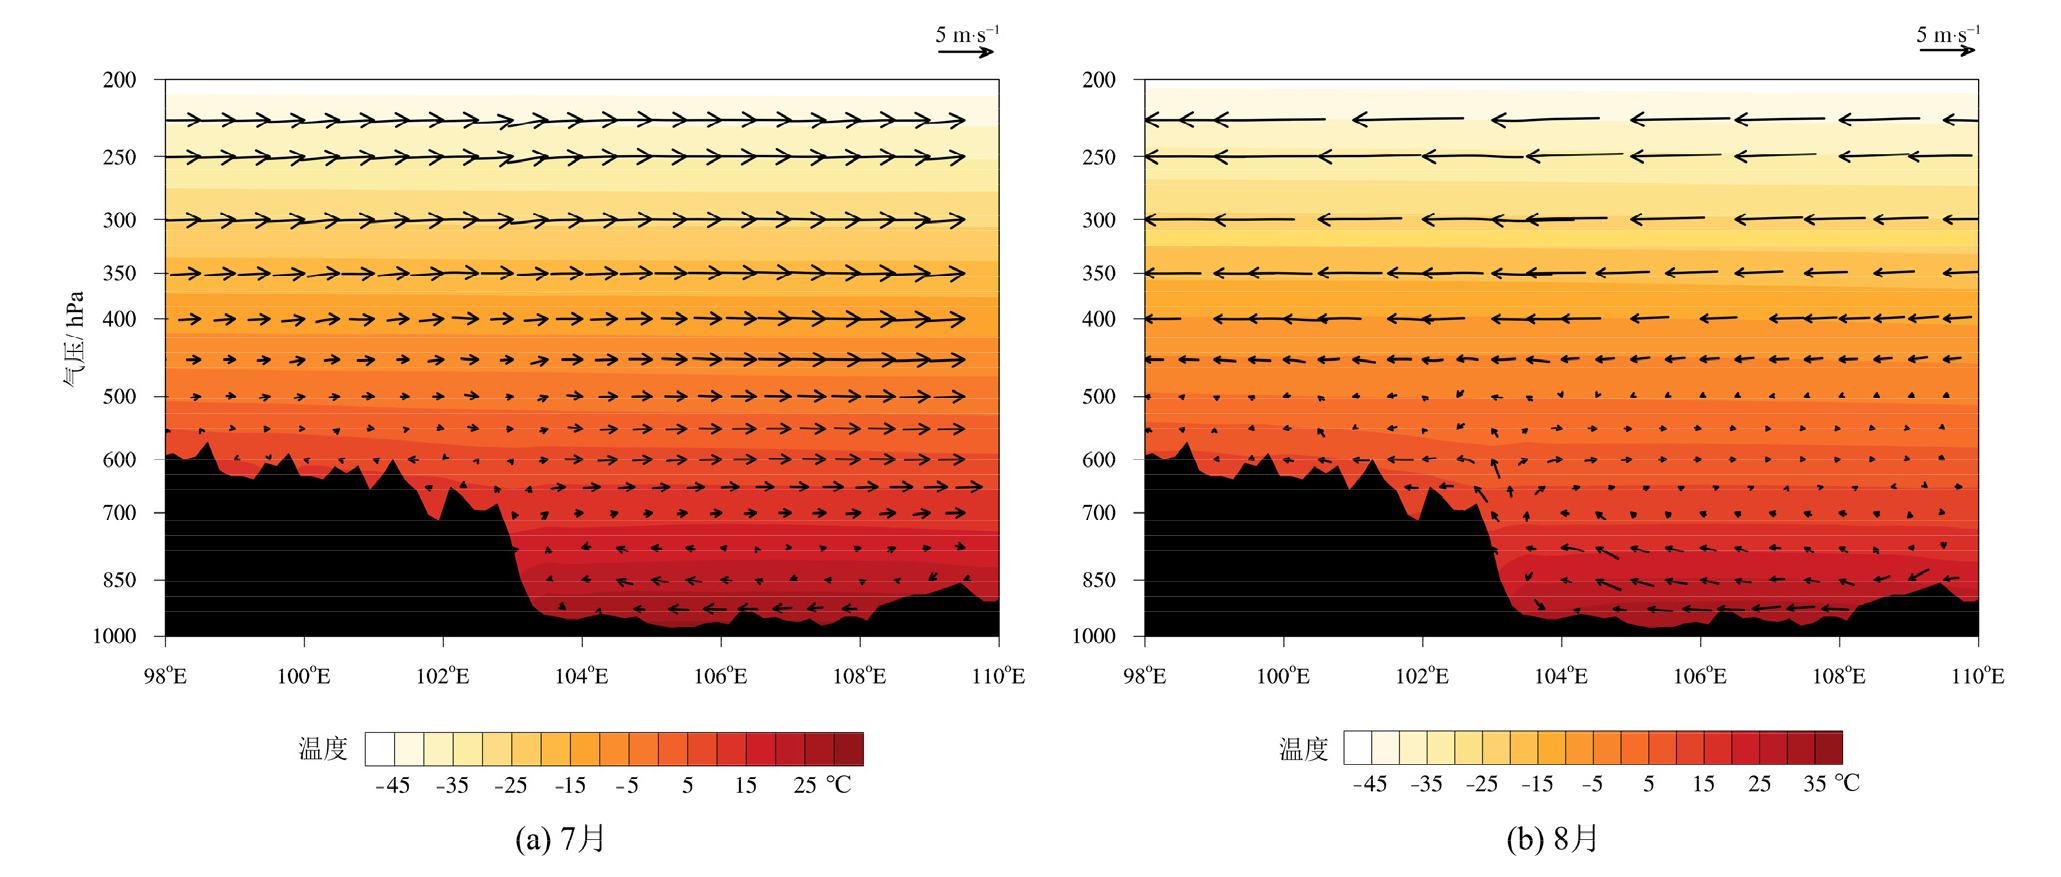
Figure 9 Vertical section of the average temperature and combined wind of u and w along 30.75°N in July and August of 2022
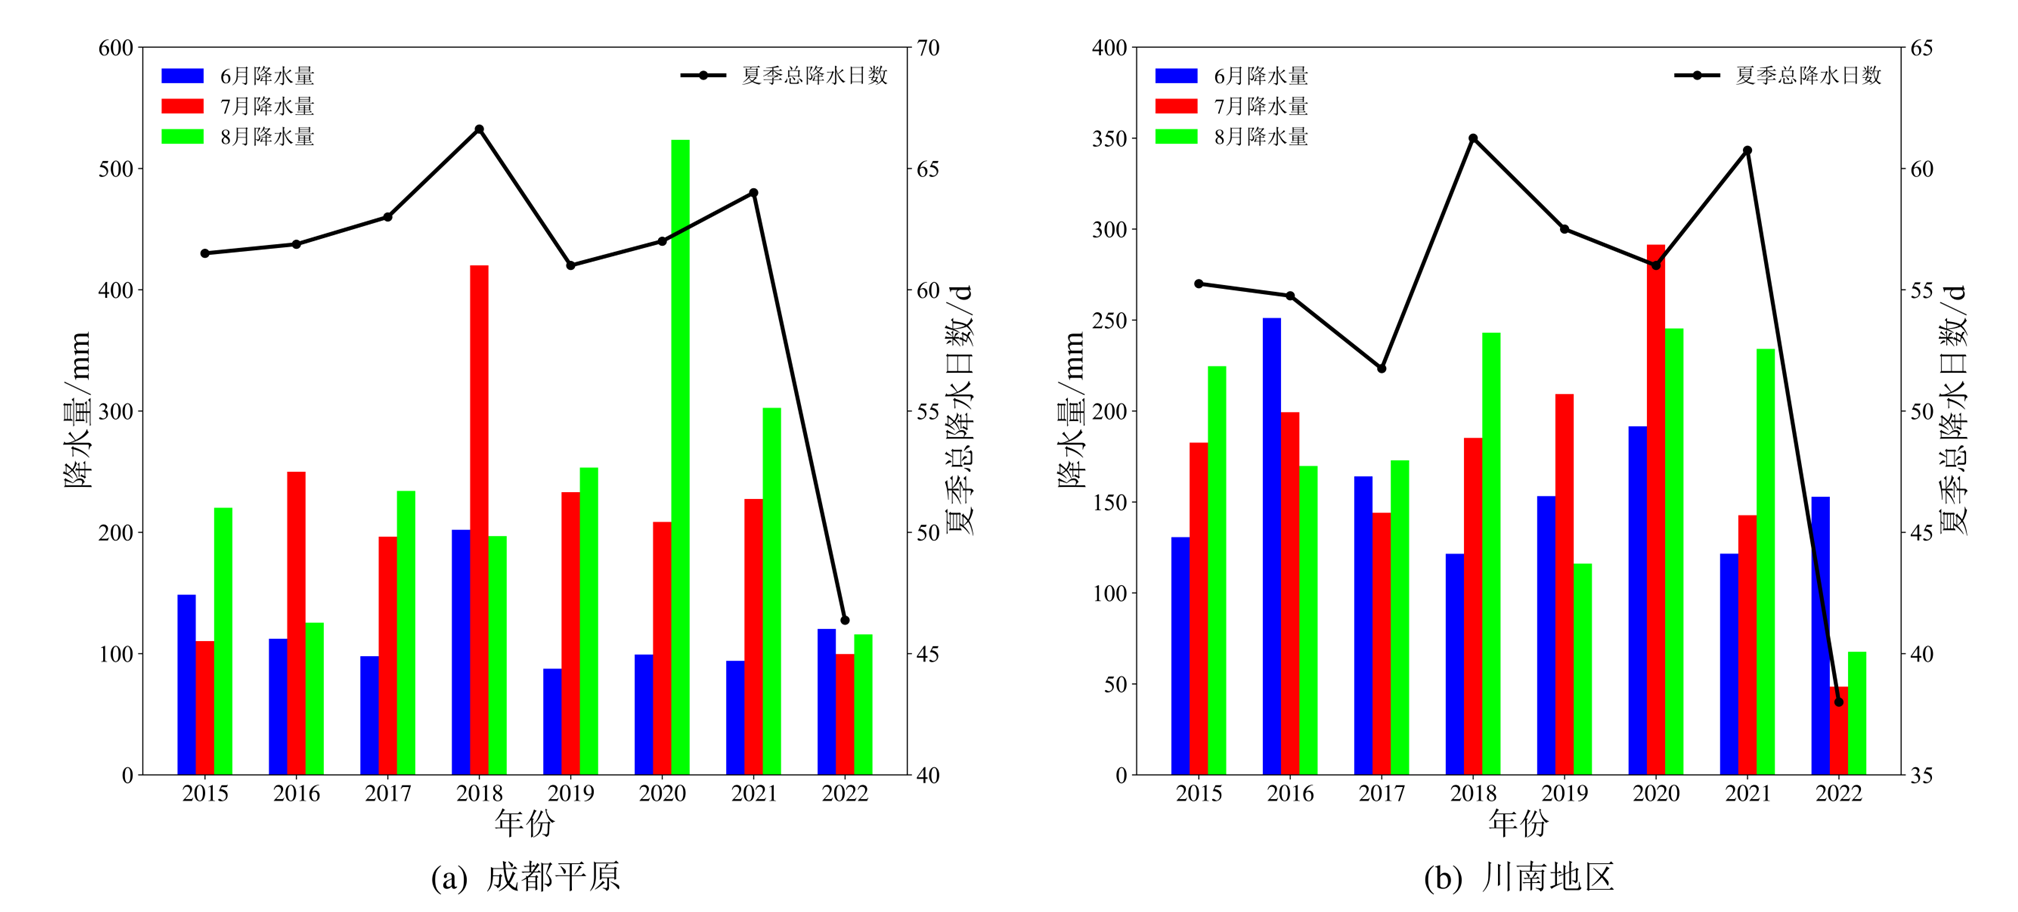
Figure 10 Monthly precipitation in June, July, August and total rainfall days in summer in the two urban agglomerations of Sichuan Basin from 2015 to 2022
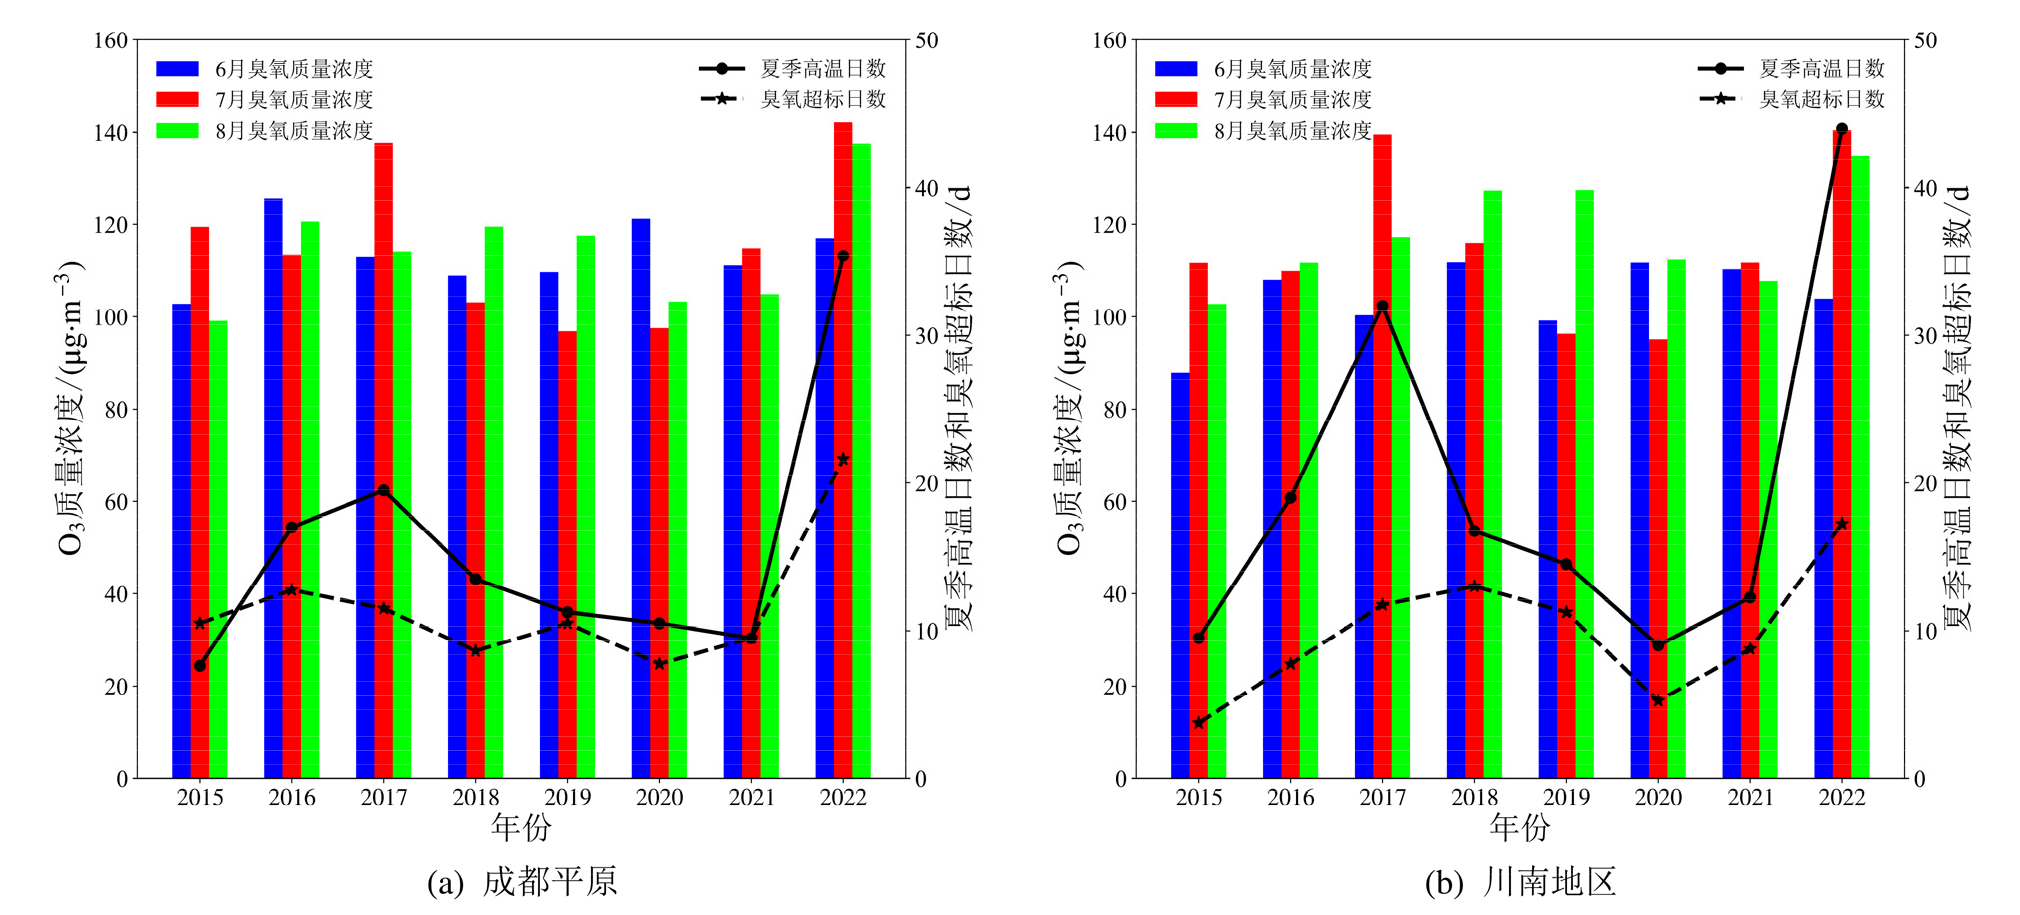
Figure 11 The monthly O3 concentration and the number of days with excessive O3 concentration and high temperature in the summer of the two urban agglomerationsfrom 2015 to 2022
| [1] | HAN H, LIU J, SHU L, et al., 2020. Local and synoptic meteorological influences on daily variability in summertime surface ozone in eastern China[J]. Atmospheric Chemistry and Physics, 20(1): 203-222. |
| [2] | JIANG Z J, LI J, LU X, et al., 2021. Impact of western pacific subtropical high on ozone pollution over eastern China[J]. Atmospheric Chemistry and Physics, 21(4): 2601-2613. |
| [3] |
LEI Y, WU K, ZHANG X L, et al., 2023. Role of meteorology-driven regional transport on O3 pollution over the Chengdu Plain, southwestern China[J]. Atmospheric Research, 285: 106619.
DOI URL |
| [4] | LI J Y, GAO W K, CAO L M, et al., 2021. Significant changes in autumn and winter aerosol composition and sources in Beijing from 2012 to 2018: Effects of clean airactions[J]. Environmental Pollution, 268(Part B): 115855. |
| [5] | NING G C, WARDLE D A, YIM S H L, 2022. Suppression of ozone formation at high temperature in China: From historical observations to future projections[J]. Geophysical Research Letters, 49(4): e2021GL097090. |
| [6] | SUN Y W, YIN H, LU X, et al., 2021. The drivers and health risks of unexpected surface ozone enhancements over the Sichuan Basin, China, in 2020[J]. Atmospheric Chemistry and Physics, 21(24): 18589-18608. |
| [7] |
XIANG X, SHI G M, WU X D, et al., 2022. The extraordinary trend of the spatial distribution of PM2.5 concentration and its meteorological causes in Sichuan Basin[J]. Atmosphere, 13(6): 853.
DOI URL |
| [8] |
WANG R Y, YANG X Y, WU K, et al., 2022. Long-term trends of ozone and precursors from 2013 to 2020 in a megacity (Chengdu), China: Evidence of changing emissions and chemistry[J]. Atmospheric Research, 278(11): 106309.
DOI URL |
| [9] |
WANG T, XUE L K, FENG ZZ, et al., 2022. Ground-level ozone pollution in China: A synthesis of recent findings on influencing factors and impacts[J]. Environmental Research Letters, 17(6): 063003.
DOI |
| [10] |
WANG Z Q, LUO H L, YANG S, 2023. Different mechanisms for the extremely hot central-eastern China in July-August 2022 from a Eurasian large-scale circulation perspective[J]. Environmental Research Letters, 18(2): 024023.
DOI |
| [11] |
WU K, WANG Y R, QIAO Y H, et al., 2022. Drivers of 2013-2020 ozone trends in the Sichuan Basin, China: Impacts of meteorology and precursor emission changes[J]. Environmental Pollution, 300: 118914.
DOI URL |
| [12] |
YANG X Y, YANG T, LU Y Q, et al., 2022. Assessment of summertime ozone formation in the Sichuan Basin, southwestern China[J]. Frontiers in Ecology and Evolution, 10:931662.
DOI URL |
| [13] |
ZHENG H, KONG S F, HE Y, et al., 2023. Enhanced ozone pollution in the summer of 2022 in China: The roles of meteorology and emission variations[J]. Atmospheric Environment, 301: 119701.
DOI URL |
| [14] |
付桂琴, 张杏敏, 尤凤春, 等, 2016. 气象条件对石家庄PM2.5浓度的影响分析[J]. 干旱气象, 34(2): 349-355.
DOI |
| FU G Q, ZHANG X M, YOU F C, et al., 2016. Analysis of the influence of meteorological conditions on PM2.5 concentration in Shijiazhuang[J]. Journal of Arid Meteorology, 34(2): 349-355. | |
| [15] | 环境保护部, 国家质量监督检验检疫总局, 2012. 环境空气质量标准: GB 3095—2012[S]. 北京: 中国环境科学出版社. |
| Ministry of environmental protection, General administration of quality supervision, inspection and quarantine, 2012. Ambient air quality standards: GB 3095—2012[S]. Beijing: China Environmental Press. | |
| [16] | 环境保护部, 2013. 环境空气质量评价技术规范(试行): HJ 663—2013[S]. 北京: 中国环境科学出版社. |
| Ministry of environmental protection, 2013. Technical regulation for ambient air quality assessment (on trial): HJ 663—2013[S]. Beijing: China Environmental Press. | |
| [17] | 黄俊, 廖碧婷, 吴兑, 等, 2018. 广州近地面臭氧浓度特征及气象影响分析[J]. 环境科学学报, 38(1): 23-31. |
| HUANG J, LIAO B T, WU D, et al., 2018. Guangzhou ground level ozone concentration characteristics and associated meteorological factors[J]. Acta Scientiae Circumstantiae, 38(1): 23-31. | |
| [18] |
李忆平, 张金玉, 岳平, 等, 2022. 2022年夏季长江流域重大干旱特征及其成因研究[J]. 干旱气象, 40(5): 733-747.
DOI |
| LI Y P, ZHANG J Y, YUE P, et al., 2022. Study on characteristics of severe drought event over Yangtze River Basin in summer of 2022 and its causes[J]. Journal of Arid Meteorology, 40(5): 733-747. | |
| [19] |
林纾, 李红英, 黄鹏程, 等, 2022. 2022年夏季我国高温干旱特征及其环流形势分析[J]. 干旱气象, 40(5): 748-763.
DOI |
| LIN S, LI H Y, HUANG P C, et al., 2022. Characteristics of high temperature, drought and circulation situation in summer 2022 in China[J]. Journal of Arid Meteorology, 40(5): 748-763. | |
| [20] |
林昕, 段焜瑀, 郭弘, 等, 2023. 极端高温形势下福州市臭氧浓度异常升高及影响因素分析[J]. 生态环境学报, 32(2): 320-330.
DOI |
| LIN X, DUAN K Y, GUO H, et al., 2023. The causes of the abnormal increase of ozone in Fuzhou city under extreme high temperature[J]. Ecology and Environmental Sciences, 32(2): 320-330. | |
| [21] | 刘建, 吴兑, 范绍佳, 等, 2017. 前体物与气象因子对珠江三角洲臭氧污染的影响[J]. 中国环境科学, 37(3): 813-820. |
| LIU J, WU D, FAN S J, et al., 2017. Impacts of precursors and meteorological factors on ozone pollution in Pearl River Delta[J]. China Environmental Science, 37(3): 813-820. | |
| [22] |
卢宁生, 张小玲, 杜云松, 等, 2023. 成都平原城市群夏季臭氧污染天气形势与潜在源分析[J]. 高原气象, 42(2): 515-528.
DOI |
| LU N S, ZHANG X L, DU Y S, et al., 2023. Objective weather classification and potential source analysis of ozone pollution during summerin Chengdu Plain urban agglomeration[J]. Plateau Meteorology, 42(2): 515-528. | |
| [23] | 孟庆涛, 于超, 2022. 2022年6月大气环流和天气分析[J]. 气象, 48(9):1209-1216. |
| MENG Q T, YU C, 2022. Analysis of the June 2022 atmospheric circulation and weather[J]. Meteorological Monthly, 48(9): 1209-1216. | |
| [24] | 欧林冲, 陈伟华, 伍永康, 等, 2023. 中国高温下臭氧抑制事件的时空特征及其影响因素[J]. 环境科学, 44(12): 6586-6597. |
| OU L C, CHEN W H, WU Y K, et al., 2023. The spatiotemporal characteristics and influencing factors of ozone suppression events under high temperatures in China[J]. Environmental Science, 44(12): 6586-6597. | |
| [25] | 祁宏, 2022. 西太平洋副热带高压活动对中国臭氧浓度的影响研究[D]. 成都: 成都信息工程大学. |
| QI H, 2022. Influence of the Western Pacific Subtropical High activity on ozone concentration in China[D]. Chengdu: Chengdu University of Information Technology. | |
| [26] | 史之浩, 2022. 气象条件对中国地区细颗粒物和臭氧污染影响的模拟研究[D]. 南京: 南京信息工程大学. |
| SHI Z H, 2022. Simulation study on the impact of meteorological conditions on fine particulate matter and ozone pollution in China[D]. Nanjing: Nanjing University of Information Science and Technology. | |
| [27] | 孙博, 王会军, 黄艳艳, 等, 2023. 2022年夏季中国高温干旱气候特征及成因探讨[J]. 大气科学学报, 46(1):1-8. |
| SUN B, WANG H J, HUANG Y Y, et al., 2023. Characteristics and causes of the hot-dry climate anomalies in China during summer of 2022[J]. Transactions of Atmospheric Sciences, 46(1): 1-8. | |
| [28] |
孙昭萱, 张强, 孙蕊, 等, 2022. 2022年西南地区极端高温干旱特征及其主要影响[J]. 干旱气象, 40(5): 764-770.
DOI |
| SUN Z X, ZHANG Q, SUN R, et al., 2022. Characteristics of the extreme high temperature and drought and their main impacts in southwestern China of 2022[J]. Journal of Arid Meteorology, 40(5): 764-770. | |
| [29] | 谭桂容, 张祎, 2023. 2022年夏季中国高温的环流异常特征[J]. 海洋气象学报, 43(2): 31-41. |
| TAN G R, ZHANG Y, 2023. Anomalous characteristics of high temperature circulation in China in the Summer of 2022[J]. Journal of Marine Meteorology, 43(2): 31-41. | |
| [30] | 王磊, 刘端阳, 韩桂荣, 等, 2018. 南京地区近地面臭氧浓度与气象条件关系研究[J]. 环境科学学报, 38(4): 1285-1296. |
| WANG L, LIU R Y, HAN G R, et al., 2018. A study on the relationship between near ground ozone concentration and meteorological conditions in Nanjing Area[J]. Acta Scientiae Circumstantiae, 38(4): 1285-1296. | |
| [31] | 王皘, 董林, 2022. 2022年8月大气环流和天气分析[J]. 气象, 48(11): 1487-1496. |
| WANG Q, DONG L, 2022. Analysis of the August 2022 atmospheric circulation and weather[J]. Meteorological Monthly, 48(11): 1487-1496. | |
| [32] | 谢雨竹, 潘月鹏, 倪长健, 等, 2015. 成都市区夏季大气污染物浓度时空变化特征分析[J]. 环境科学学报, 35(4): 975-983. |
| XIE Y Z, PAN Y P, NI C J, et al., 2015. Temporal and spatial variations of atmospheric pollutants in urban Chengdu during summer[J]. Acta Scientiae Circumstantiae, 35(4): 975-983. | |
| [33] |
谢祖欣, 冯宏芳, 林文, 等, 2020. 气象条件对福州市夏季臭氧(O3)浓度的影响研究[J]. 生态环境学报, 29(11): 2251-2261.
DOI |
| XIE Z X, FENG H F, LIN W, et al., 2020. Meteorological factors impact on summertime ozone(O3) concentration in Fuzhou[J]. Ecology and Environmental Sciences, 29(11): 2251-2261. | |
| [34] | 徐成鹏, 于超, 2022. 2022年7月大气环流和天气分析[J]. 气象, 48(10): 1354-1360. |
| XU C P, YU C, 2022. Analysis of the July 2022 atmospheric circulation and weather[J]. Meteorological Monthly, 48(10): 1354-1360. | |
| [35] | 徐敬, 丁国安, 颜鹏, 等, 2007. 北京地区PM2.5的成分特征及来源分析[J]. 应用气象学报, 18(5): 645-654. |
| XU J, DING G A, YAN P, et al., 2007. Composition characteristics and source analysis of PM2.5 in Beijing area[J]. Journal of Applied Meteorological Science, 18(5): 645-654. | |
| [36] | 徐敬, 张小玲, 赵秀娟, 等, 2009. 夏季局地环流对北京下风向地区O3输送的影响[J]. 中国环境科学, 29(11): 1140-1146. |
| XU J, ZHANG X L, ZHAO X J, et al., 2009. Influence of summer local circulation on the transportation of ozone from urban to the downwind area in Beijing[J]. China Environmental Science, 29(11): 1140-1146. | |
| [37] | 叶笃正, 黄荣辉, 1991. 我国长江黄河两流域旱涝规律成因与预测研究的进展、成果与问题[J]. 地球科学进展, 6(4): 24-29. |
| YE D Z, HUANG R H, 1991. Advances, results and problems of the project “Investigation on laws, causes and predictions of droughts and floods in the Yellow River valley and the Yangtze River valley of China”[J]. Advances in Earth Science, 6(4): 24-29. | |
| [38] | 章大全, 袁媛, 韩荣青, 2023. 2022年夏季我国气候异常特征及成因分析[J]. 气象, 49(1): 110-121. |
| ZHANG D Q, YUAN Y, HAN R Q, 2023. Characteristics and possible causes of the climate anomalies over China in summer 2022[J]. Meteorological Monthly, 49(1): 110-121. |
| [1] | LIAO Tong, XIONG Xin, WANG Zaihua, YANG Xiajie, HUANG Yingnan, FENG Jiaying. The Experience of Prevention and Control of Air Pollution in International Advanced Bay Areas and Its Enlightenment to Guangdong-Hong Kong-Macao Greater Bay Area in China [J]. Ecology and Environment, 2022, 31(11): 2242-2250. |
| Viewed | ||||||
|
Full text |
|
|||||
|
Abstract |
|
|||||
Copyright © 2021 Editorial Office of ACTA PETROLEI SINICA
Address:No. 6 Liupukang Street, Xicheng District, Beijing, P.R.China, 510650
Tel: 86-010-62067128, 86-010-62067137, 86-010-62067139
Fax: 86-10-62067130
Email: syxb@cnpc.com.cn
Support byBeijing Magtech Co.ltd, E-mail:support@magtech.com.cn