Ecology and Environment ›› 2023, Vol. 32 ›› Issue (4): 814-824.DOI: 10.16258/j.cnki.1674-5906.2023.04.019
• Research Articles • Previous Articles
XIA Meijun1,2( ), LI Jian2,*(), YAN Yongcan2
Received:2023-02-01
Online:2023-04-18
Published:2023-07-12
Contact:
LI Jian
夏美君1,2(), 李健2,*(), 闫永蚕2
通讯作者:
李健
作者简介:夏美君(1993年生),女(蒙古族),博士研究生,主要从事循环经济与生态工业工程研究。E-mail: xia1922649561@163.com
基金资助:CLC Number:
XIA Meijun, LI Jian, YAN Yongcan. Spatial-temporal Patterns and Evolution Characteristics of Ecological Well-being Performance in Beijing-Tianjin-Hebei Urban Agglomeration[J]. Ecology and Environment, 2023, 32(4): 814-824.
夏美君, 李健, 闫永蚕. 京津冀城市群生态福利绩效时空格局及演进特征[J]. 生态环境学报, 2023, 32(4): 814-824.
Add to citation manager EndNote|Ris|BibTeX
URL: https://www.jeesci.com/EN/10.16258/j.cnki.1674-5906.2023.04.019
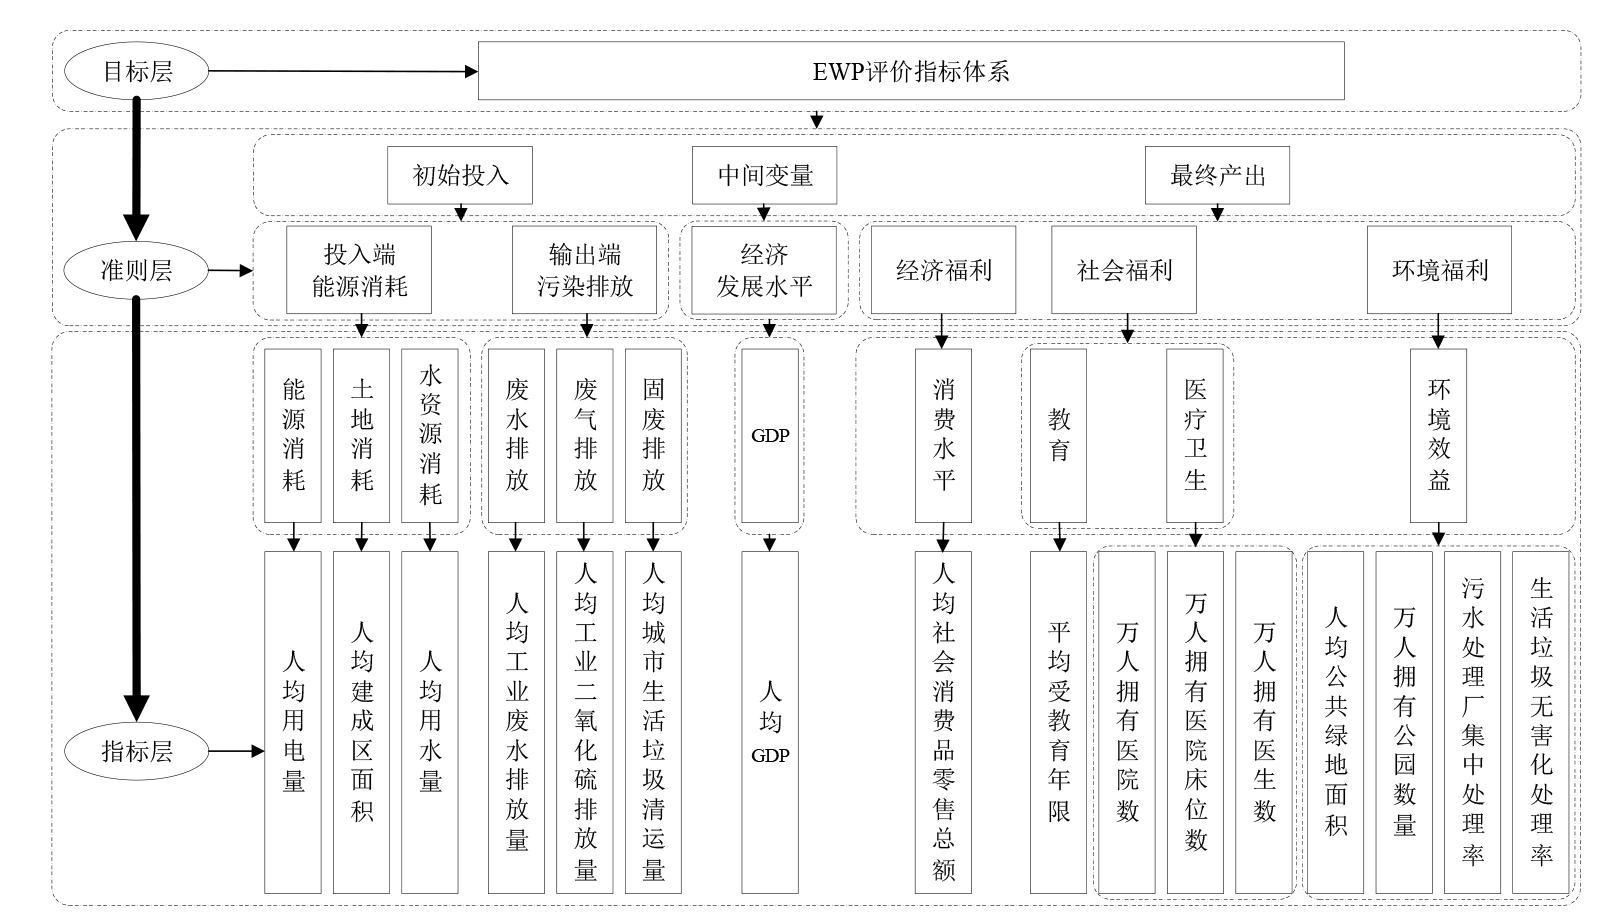
Figure 1 Ecological well-being performance evaluation index system
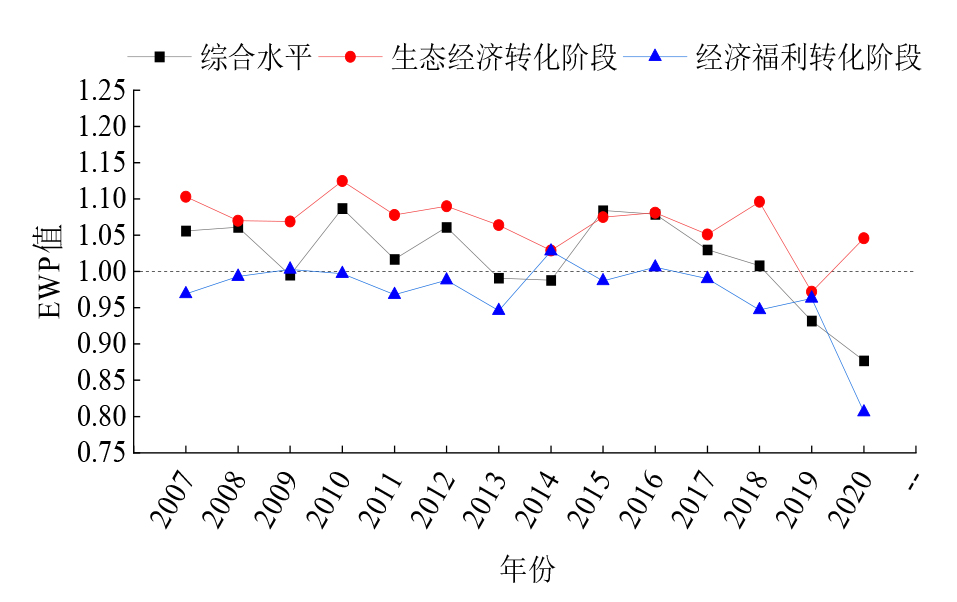
Figure 2 The performance of EWP and its each stage in Beijing-Tianjin-Hebei urban agglomeration
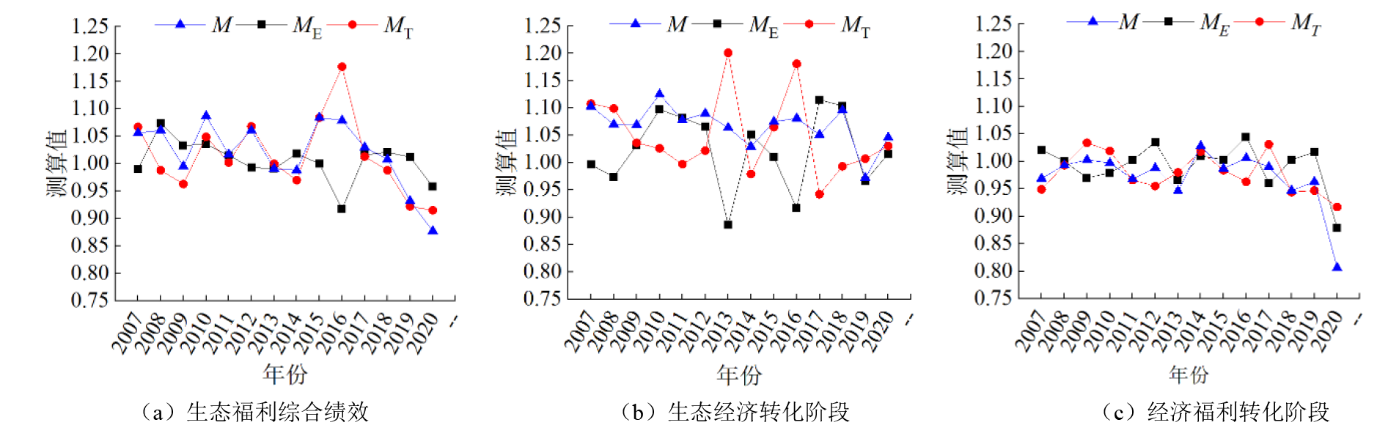
Figure 3 Time series evolution of EWP and its decomposition in Beijing-Tianjin-Hebei urban agglomeration
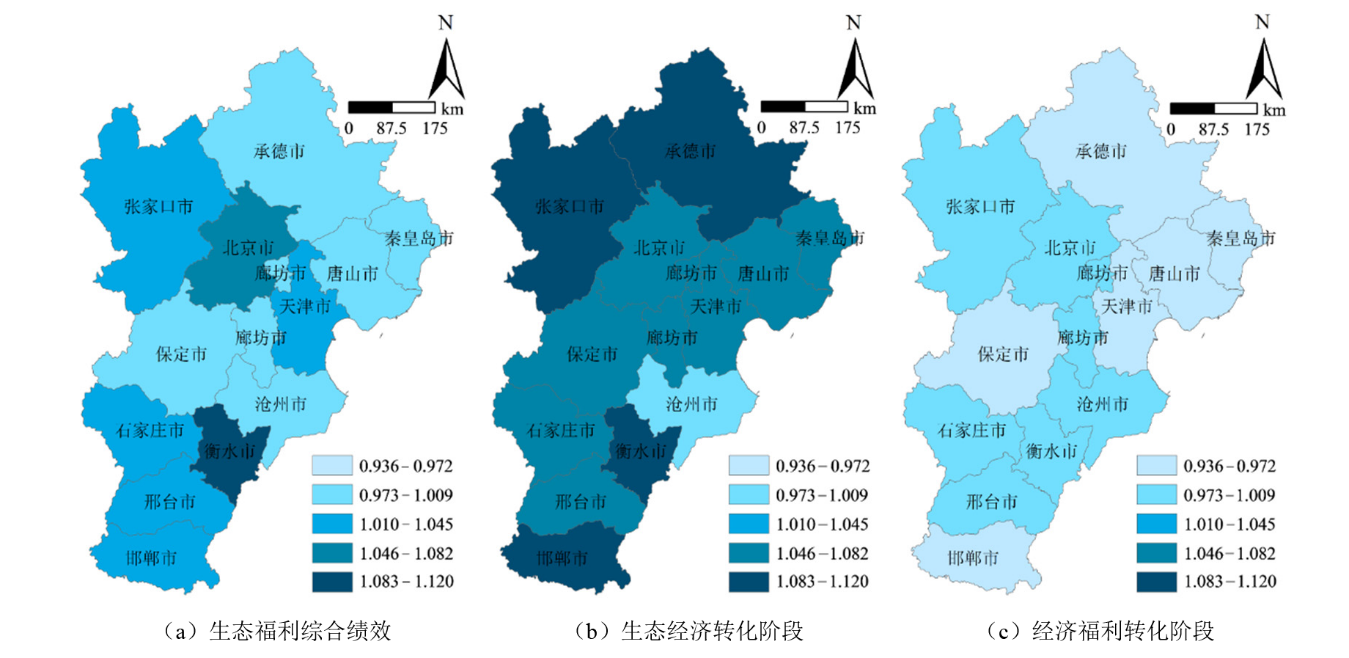
Figure 4 Spatial distribution pattern of EWP in Beijing-Tianjin-Hebei urban agglomeration

Figure 5 Kernel density estimation for the two stages of EWP in Beijing-Tianjin-Hebei urban agglomeration
| 年份 | S1 | S2 |
|---|---|---|
| 2007 | 0.222*** (2.985) | 0.204** (1.956) |
| 2008 | 0.291*** (4.033) | 0.099 (1.233) |
| 2009 | 0.215** (2.234) | 0.164** (1.742) |
| 2010 | 0.300*** (2.669) | 0.111* (1.304) |
| 2011 | 0.291*** (2.710) | 0.092 (1.187) |
| 2012 | 0.243*** (2.447) | 0.155** (1.643) |
| 2013 | 0.067 (1.120) | 0.019 (0.690) |
| 2014 | 0.163** (1.845) | 0.137** (1.755) |
| 2015 | 0.130* (1.511) | 0.102* (1.287) |
| 2016 | −0.023 (0.443) | 0.239** (2.220) |
| 2017 | 0.202** (1.902) | 0.150** (1.740) |
| 2018 | 0.009 (0.712) | 0.199** (2.037) |
| 2019 | 0.198** (1.989) | 0.204** (2.009) |
| 2020 | 0.014 (0.721) | 0.309*** (2.626) |
Table 1 Moran index for two stages of EWP in Beijing-Tianjin-Hebei urban agglomeration
| 年份 | S1 | S2 |
|---|---|---|
| 2007 | 0.222*** (2.985) | 0.204** (1.956) |
| 2008 | 0.291*** (4.033) | 0.099 (1.233) |
| 2009 | 0.215** (2.234) | 0.164** (1.742) |
| 2010 | 0.300*** (2.669) | 0.111* (1.304) |
| 2011 | 0.291*** (2.710) | 0.092 (1.187) |
| 2012 | 0.243*** (2.447) | 0.155** (1.643) |
| 2013 | 0.067 (1.120) | 0.019 (0.690) |
| 2014 | 0.163** (1.845) | 0.137** (1.755) |
| 2015 | 0.130* (1.511) | 0.102* (1.287) |
| 2016 | −0.023 (0.443) | 0.239** (2.220) |
| 2017 | 0.202** (1.902) | 0.150** (1.740) |
| 2018 | 0.009 (0.712) | 0.199** (2.037) |
| 2019 | 0.198** (1.989) | 0.204** (2.009) |
| 2020 | 0.014 (0.721) | 0.309*** (2.626) |
| 空间 滞后 | t/t+1 | S1 | S2 | |||||||||
|---|---|---|---|---|---|---|---|---|---|---|---|---|
| n | Ⅰ | Ⅱ | Ⅲ | Ⅳ | n | Ⅰ | Ⅱ | Ⅲ | Ⅳ | |||
| 无 | Ⅰ | 44 | 0.705 | 0.295 | 0.000 | 0.000 | 30 | 0.933 | 0.033 | 0.033 | 0.000 | |
| Ⅱ | 45 | 0.022 | 0.689 | 0.289 | 0.000 | 39 | 0.154 | 0.615 | 0.179 | 0.051 | ||
| Ⅲ | 39 | 0.000 | 0.026 | 0.718 | 0.256 | 43 | 0.023 | 0.279 | 0.535 | 0.163 | ||
| Ⅳ | 28 | 0.000 | 0.000 | 0.036 | 0.964 | 44 | 0.000 | 0.068 | 0.227 | 0.705 | ||
| Ⅰ | Ⅰ | 30 | 0.700 | 0.300 | 0.000 | 0.000 | 8 | 1.000 | 0.000 | 0.000 | 0.000 | |
| Ⅱ | 6 | 0.000 | 1.000 | 0.000 | 0.000 | 2 | 0.500 | 0.500 | 0.000 | 0.000 | ||
| Ⅲ | 0 | 0.000 | 0.000 | 0.000 | 0.000 | 4 | 0.000 | 0.500 | 0.500 | 0.000 | ||
| Ⅳ | 0 | 0.000 | 0.000 | 0.000 | 0.000 | 0 | 0.000 | 0.000 | 0.000 | 0.000 | ||
| Ⅱ | Ⅰ | 10 | 0.600 | 0.400 | 0.000 | 0.000 | 12 | 0.917 | 0.000 | 0.083 | 0.000 | |
| Ⅱ | 29 | 0.034 | 0.655 | 0.310 | 0.000 | 15 | 0.067 | 0.600 | 0.333 | 0.000 | ||
| Ⅲ | 13 | 0.000 | 0.000 | 0.923 | 0.077 | 9 | 0.111 | 0.222 | 0.667 | 0.000 | ||
| Ⅳ | 0 | 0.000 | 0.000 | 0.000 | 0.000 | 6 | 0.000 | 0.000 | 0.167 | 0.833 | ||
| Ⅲ | Ⅰ | 3 | 1.000 | 0.000 | 0.000 | 0.000 | 8 | 0.875 | 0.125 | 0.000 | 0.000 | |
| Ⅱ | 10 | 0.000 | 0.600 | 0.400 | 0.000 | 19 | 0.158 | 0.684 | 0.053 | 0.105 | ||
| Ⅲ | 20 | 0.000 | 0.050 | 0.500 | 0.450 | 24 | 0.000 | 0.250 | 0.542 | 0.208 | ||
| Ⅳ | 13 | 0.000 | 0.000 | 0.077 | 0.923 | 28 | 0.000 | 0.107 | 0.143 | 0.750 | ||
| Ⅳ | Ⅰ | 1 | 1.000 | 0.000 | 0.000 | 0.000 | 2 | 1.000 | 0.000 | 0.000 | 0.000 | |
| Ⅱ | 0 | 0.000 | 0.000 | 0.000 | 0.000 | 3 | 0.333 | 0.333 | 0.333 | 0.000 | ||
| Ⅲ | 6 | 0.000 | 0.000 | 1.000 | 0.000 | 6 | 0.000 | 0.333 | 0.333 | 0.333 | ||
| Ⅳ | 15 | 0.000 | 0.000 | 0.000 | 1.000 | 10 | 0.000 | 0.000 | 0.500 | 0.500 | ||
Table 2 Markov transfer probability matrix for two stages of EWP in Beijing-Tianjin-Hebei urban agglomeration
| 空间 滞后 | t/t+1 | S1 | S2 | |||||||||
|---|---|---|---|---|---|---|---|---|---|---|---|---|
| n | Ⅰ | Ⅱ | Ⅲ | Ⅳ | n | Ⅰ | Ⅱ | Ⅲ | Ⅳ | |||
| 无 | Ⅰ | 44 | 0.705 | 0.295 | 0.000 | 0.000 | 30 | 0.933 | 0.033 | 0.033 | 0.000 | |
| Ⅱ | 45 | 0.022 | 0.689 | 0.289 | 0.000 | 39 | 0.154 | 0.615 | 0.179 | 0.051 | ||
| Ⅲ | 39 | 0.000 | 0.026 | 0.718 | 0.256 | 43 | 0.023 | 0.279 | 0.535 | 0.163 | ||
| Ⅳ | 28 | 0.000 | 0.000 | 0.036 | 0.964 | 44 | 0.000 | 0.068 | 0.227 | 0.705 | ||
| Ⅰ | Ⅰ | 30 | 0.700 | 0.300 | 0.000 | 0.000 | 8 | 1.000 | 0.000 | 0.000 | 0.000 | |
| Ⅱ | 6 | 0.000 | 1.000 | 0.000 | 0.000 | 2 | 0.500 | 0.500 | 0.000 | 0.000 | ||
| Ⅲ | 0 | 0.000 | 0.000 | 0.000 | 0.000 | 4 | 0.000 | 0.500 | 0.500 | 0.000 | ||
| Ⅳ | 0 | 0.000 | 0.000 | 0.000 | 0.000 | 0 | 0.000 | 0.000 | 0.000 | 0.000 | ||
| Ⅱ | Ⅰ | 10 | 0.600 | 0.400 | 0.000 | 0.000 | 12 | 0.917 | 0.000 | 0.083 | 0.000 | |
| Ⅱ | 29 | 0.034 | 0.655 | 0.310 | 0.000 | 15 | 0.067 | 0.600 | 0.333 | 0.000 | ||
| Ⅲ | 13 | 0.000 | 0.000 | 0.923 | 0.077 | 9 | 0.111 | 0.222 | 0.667 | 0.000 | ||
| Ⅳ | 0 | 0.000 | 0.000 | 0.000 | 0.000 | 6 | 0.000 | 0.000 | 0.167 | 0.833 | ||
| Ⅲ | Ⅰ | 3 | 1.000 | 0.000 | 0.000 | 0.000 | 8 | 0.875 | 0.125 | 0.000 | 0.000 | |
| Ⅱ | 10 | 0.000 | 0.600 | 0.400 | 0.000 | 19 | 0.158 | 0.684 | 0.053 | 0.105 | ||
| Ⅲ | 20 | 0.000 | 0.050 | 0.500 | 0.450 | 24 | 0.000 | 0.250 | 0.542 | 0.208 | ||
| Ⅳ | 13 | 0.000 | 0.000 | 0.077 | 0.923 | 28 | 0.000 | 0.107 | 0.143 | 0.750 | ||
| Ⅳ | Ⅰ | 1 | 1.000 | 0.000 | 0.000 | 0.000 | 2 | 1.000 | 0.000 | 0.000 | 0.000 | |
| Ⅱ | 0 | 0.000 | 0.000 | 0.000 | 0.000 | 3 | 0.333 | 0.333 | 0.333 | 0.000 | ||
| Ⅲ | 6 | 0.000 | 0.000 | 1.000 | 0.000 | 6 | 0.000 | 0.333 | 0.333 | 0.333 | ||
| Ⅳ | 15 | 0.000 | 0.000 | 0.000 | 1.000 | 10 | 0.000 | 0.000 | 0.500 | 0.500 | ||
| [1] |
BIAN J, REN H, LIU P, 2020a. Evaluation of urban ecological well-being performance in China: A case study of 30 provincial capital cities[J]. Journal of Cleaner Production, 254: 120109.
DOI URL |
| [2] |
BIAN J, ZHANG Y, SHUAI C Y, et al., 2020b. Have cities effectively improved ecological well-being performance? Empirical analysis of 278 Chinese cities[J]. Journal of Cleaner Production, 245: 118913.
DOI URL |
| [3] |
COMMON M, 2007. Measuring national economic performance without using prices[J]. Ecological Economics, 64(1): 92-102.
DOI URL |
| [4] | DALY H E, 1974. The economics of the steady state[J]. American Economic Review, 64(2): 15-21. |
| [5] |
FENG Y J, ZHONG S Y, LI Q Y, et al., 2019. Ecological well-being performance growth in China (1994-2014): From perspectives of industrial structure green adjustment and green total factor productivity[J]. Journal of Cleaner Production, 236: 117556.
DOI URL |
| [6] |
KAO C, HWANG S N, 2008. Efficiency decomposition in two-stage data envelopment analysis: An application to non-life insurance companies in Taiwan[J]. European Journal of Operational Research, 185(1): 418-429.
DOI URL |
| [7] |
LONG X Y, YU H J, SUN M X, et al., 2020. Sustainability evaluation based on the three-dimensional ecological footprint and human development index: A case study on the four island regions in China[J]. Journal of Environmental Management, 265: 110509.
DOI URL |
| [8] |
VERHOFSTADT E, VAN OOTEGEM L, DEFLOOR B, et al., 2016. Linking individuals’ ecological footprint to their subjective well-being[J]. Ecological Economics, 127: 80-89.
DOI URL |
| [9] | WANG R, FENG Y, 2020. Research on China’s ecological welfare performance evaluation and improvement path from the perspective of high-quality development[J]. Mathematical Problems in Engineering, 2020: 5476089. |
| [10] |
ZHANG S, ZHU D J, SHI Q H, et al., 2018. Which countries are more ecologically efficient in improving human well-being? An application of the index of ecological well-being performance[J]. Resources, Conservation and Recycling, 129: 112-119.
DOI URL |
| [11] | 陈明华, 刘玉鑫, 张晓萌, 等, 2019. 中国城市群民生发展水平测度及趋势演进——基于城市DLI的经验考察[J]. 中国软科学 (1): 45-61, 81. |
| CHEN M H, LIU Y X, ZHANG X M, et al., 2019. The measurement and trend evolution of the development level of the people’s livelihood in China’s urban agglomeration: An empirical study based on the urban DLI[J]. China Soft Science (1): 45-61, 81. | |
| [12] | 邓远建, 杨旭, 陈光炬, 等, 2020. 中国生态福利绩效水平的空间非均衡及动态演进[J]. 中国地质大学学报 (社会科学版), 20(4): 115-127. |
| DENG Y J, YANG X, CHEN G J, et al., 2020. Spatial unbalanced and dynamic evolution of China's ecological welfare performance level[J]. Journal of China University of Geosciences (Social Sciences Edition), 20(4): 115-127. | |
| [13] | 邓远建, 杨旭, 马强文, 等, 2021. 中国生态福利绩效水平的地区差距及收敛性[J]. 中国人口·资源与环境, 31(4): 132-143. |
| DENG Y J, YANG X, MA Q W, et al., 2021. Regional disparity and convergence of China’s ecological welfare performance level[J]. China Population, Resources and Environment, 31(4): 132-143. | |
| [14] | 冯吉芳, 袁健红, 2016. 中国区域生态福利绩效及其影响因素[J]. 中国科技论坛 (3): 100-105. |
| FENG J F, YUAN J H, 2016. On Chinese regional ecological well-being performance and its influence factors[J]. Forum on Science and Technology in China (3): 100-105. | |
| [15] | 郭炳南, 唐利, 张浩, 2021. 环境规制与长江经济带生态福利绩效的空间效应研究[J]. 经济体制改革 (3): 73-79. |
| GUO B N, TANG L, ZHANG H, 2021. Spatial effects of environmental regulation and ecological welfare performance in Yangtze River Economic Belt[J]. Reform of Economic System (3): 73-79. | |
| [16] | 姬志恒, 张鹏, 2020. 环境约束下中国城市土地利用效率空间差异及驱动机制——基于285个地级及以上城市的研究[J]. 中国土地科学, 34(8): 72-79. |
| JI Z H, ZHANG P, 2020. Spatial difference and driving mechanism of urban land use efficiency under the environmental constraints: Based on 285 cities in China[J]. China Land Science, 34(8): 72-79. | |
| [17] |
李成宇, 张士强, 张伟, 等, 2019. 中国省际生态福利绩效测算及影响因素研究[J]. 地理科学, 39(12): 1875-1883.
DOI |
|
LI C Y, ZHANG S Q, ZHANG W, et al., 2019. Measurement and influencing factors of inter-provincial ecological well-being performance in China[J]. Scientia Geographica Sinica, 39(12): 1875-1883.
DOI |
|
| [18] | 李红霞, 郑石明, 要蓉蓉, 2022. 环境与经济目标设置何以影响减污降碳协同管理绩效?[J]. 中国人口·资源与环境, 32(11): 109-120. |
| LI H X, ZHENG S M, YAO R R, 2022. How do environmental and economic goal-settings affect the synergistic performance of air pollution and carbon reduction?[J]. China Population, Resources and Environment, 32(11): 109-120. | |
| [19] | 李研, 2021. 中国数字经济产出效率的地区差异及动态演变[J]. 数量经济技术经济研究, 38(2): 60-77. |
| LI Y, 2021. Regional differences and dynamic evolution of China's digital economy output efficiency[J]. Journal of Quantitative & Technological Economics, 38(2): 60-77. | |
| [20] |
林克涛, 邓惺炜, 叶颉, 2020. 基于Super-NSBM与Window DEA模型的区域生态福利绩效评价研究——以福建省为例[J]. 生态环境学报, 29(10): 2110-2117.
DOI URL |
| LIN K T, DENG X W, YE J, 2020. Evaluation of regional ecological well-being performance based on Super-NSBM and Window DEA model: A case study of Fujian Province[J]. Ecology and Environmental Sciences, 29(10): 2110-2117. | |
| [21] | 林木西, 耿蕊, 李国柱, 2019. 省域生态福利绩效水平的空间非均衡性研究——基于MLD指数与分布动态学模型[J]. 东岳论丛, 40(10): 73-83. |
| LIN M X, GENG R, LI G Z, 2019. Research on the spatial unbalanced level of provincial ecological well-being performance: Based on MLD index and distribution dynamics model[J]. Dongyue Tribune, 40(10): 73-83. | |
| [22] | 刘华军, 石印, 郭立祥, 等, 2022. 新时代的中国能源革命: 历程、成就与展望[J]. 管理世界, 38(7): 6-24. |
| LIU H J, SHI Y, GUO L X, et al., 2022. China’s energy reform in the new era: Process, achievements and prospects[J]. Journal of Management World, 38(7): 6-24. | |
| [23] | 刘煜, 刘跃军, 2021. 中国生态福利绩效测度与空间关联网络特征分析[J]. 统计与决策, 37(24): 52-57. |
| LIU Y, LIU Y J, 2021. Measurement on China's ecological welfare performance and analysis on spatial correlation network characteristics[J]. Statistics & Decision, 37(24): 52-57. | |
| [24] | 龙亮军, 2019a. 基于两阶段Super-NSBM模型的城市生态福利绩效评价研究[J]. 中国人口·资源与环境, 29(7): 1-10. |
| LONG L J, 2019a. Evaluation of urban ecological well-being performance of Chinese major cities based on two-stage Super-efficiency Network SBM model[J]. China Population, Resources and Environment, 29(7): 1-10. | |
| [25] | 龙亮军, 2019b. 综合福利视角下中国生态文明建设绩效评价及国际比较[J]. 自然资源学报, 34(6): 1259-1272. |
|
LONG L J, 2019b. Evaluation of ecological civilization construction performance and its international comparison from the perspective of overall well-being[J]. Journal of Natural Resources, 34(6): 1259-1272.
DOI URL |
|
| [26] | 龙亮军, 2019c. 中国主要城市生态福利绩效评价研究——基于PCA-DEA方法和Malmquist指数的实证分析[J]. 经济问题探索 (2): 69-79. |
| LONG L J, 2019c. Measurement and evaluation of urban ecological well-being performance of 35 major cities in China based on PCA-DEA and Malmquist index method[J]. Inquiry into Economic Issues (2): 69-79. | |
| [27] | 龙亮军, 王霞, 2017a. 上海市生态福利绩效评价研究[J]. 中国人口·资源与环境, 27(2): 84-92. |
| LONG L J, WANG X, 2017a. A study on Shanghai's ecological well-being performance[J]. China Population, Resources and Environment, 27(2): 84-92. | |
| [28] | 龙亮军, 王霞, 郭兵, 2017b. 基于改进DEA模型的城市生态福利绩效评价研究——以我国35个大中城市为例[J]. 自然资源学报, 32(4): 595-605. |
| LONG L J, WANG X, GUO B, 2017b. Evaluation of urban ecological well-being performance based on revised DEA model: A case study of 35 major cities in China[J]. Journal of Natural Resources, 32(4): 595-605. | |
| [29] |
马诗萍, 刘倩倩, 张文忠, 2022. 空间视角下的能源-经济-环境关系研究进展与展望[J]. 地理科学进展, 41(8): 1530-1541.
DOI |
|
MA S P, LIU Q Q, ZHANG W Z, 2022. Progress and prospect of energy-economy-environment nexus research from a spatial perspective[J]. Progress in Geography, 41(8): 1530-1541.
DOI |
|
| [30] |
邱坚坚, 刘毅华, 陈澄静, 等, 2023. 生态系统服务与人类福祉耦合的空间格局及其驱动方式——以广州市为例[J]. 自然资源学报, 38(3): 760-778.
DOI |
|
QIU J J, LIU Y H, CHEN C J, et al., 2023. Spatial structure and driving pathways of the coupling between ecosystem services and human well-beings: A case study of Guangzhou[J]. Journal of Natural Resources, 38(3): 760-778.
DOI URL |
|
| [31] | 尚秀丽, 2023. 中国三大城市群生态环境质量与发展取向研究——基于胡焕庸线的生态涵义[J]. 城市发展研究, 30(1): 72-81. |
| SHANG X L, 2023. Study on the ecological environmental quality and development orientation of three major urban agglomerations in China: Based on the ecological meaning of Hu Line[J]. Urban Development Studies, 30(1): 72-81. | |
| [32] | 孙钰, 武占云, 姜宁宁, 等, 2022. 京津冀生态文明建设的时空溢出效应及驱动因素[J]. 城市问题 (7): 43-53. |
| SUN Y, WU Z Y, JIANG N N, et al., 2022. Research on spatial-temporal spillover effects and driving factors of ecological civilization construction in Beijing, Tianjin and Hebei[J]. Urban Problems (7): 43-53. | |
| [33] |
王圣云, 韩亚杰, 任慧敏, 等, 2020. 中国省域生态福利绩效评估及其驱动效应分解[J]. 资源科学, 42(5): 840-855.
DOI |
| WANG S Y, HAN Y J, REN H M, et al., 2020. Evaluation of provincial ecological well- being performance and its driving effect decomposition in China[J]. Resources Science, 42(5): 840-855. | |
| [34] | 王兆峰, 王梓瑛, 2021. 长江经济带生态福利绩效空间格局演化及影响因素研究——基于超效率SBM模型[J]. 长江流域资源与环境, 30(12): 2822-2832. |
| WANG Z F, WANG Z Y, 2021. Spatial pattern evolution and influencing factors of ecological welfare performance in Yangtze River Economic Belt: Based on super efficiency SBM model[J]. Resources and Environment in the Yangtze Basin, 30(12): 2822-2832. | |
| [35] | 文琦, 万媛媛, 陆冰洁, 等, 2022. 中国能源地理学研究进展及展望[J]. 经济地理, 42(11): 95-102. |
|
WEN Q, WAN Y Y, LU B J, et al., 2022. Progress and prospect of Chinese energy geography[J]. Economic Geography, 42(11): 95-102.
DOI URL |
|
| [36] | 肖黎明, 肖沁霖, 2021. 黄河流域城市生态福利绩效格局分异及空间收敛分析[J]. 软科学, 35(2): 46-53. |
| XIAO L M, XIAO Q L, 2021. Study on the differentiation and spatial convergence of urban ecological welfare performance patterns in the Yellow River Basin[J]. Soft Science, 35(2): 46-53. | |
| [37] | 徐志雄, 徐维祥, 刘程军, 2021. 城市生态福利绩效的动态演进及其影响因子探析——以黄河流域地级及以上城市为例[J]. 城市问题 (7): 52-60. |
| XU Z X, XU W X, LIU C J, 2021. Dynamic evolution and driving mechanism of ecological well-being performance of cities in the Yellow River Basin[J]. Urban Problems (7): 52-60. | |
| [38] | 姚常成, 宋冬林, 2019. 借用规模、网络外部性与城市群集聚经济[J]. 产业经济研究 (2): 76-87. |
| YAO C C, SONG D L, 2019. Borrowed-size, network externalities and agglomeration economies in the urban agglomerations[J]. Industrial Economics Research (2): 76-87. | |
| [39] | 袁艺, 张文彬, 焦兵, 2021. 中国省域可持续经济福利测度及阈值效应研究[J]. 统计与信息论坛, 36(12): 23-34. |
| YUAN Y, ZHANG W B, JIAO B, 2021. Study on the measurement of sustainable economic welfare and threshold effect in China province[J]. Journal of Statistics and Information, 36(12): 23-34. | |
| [40] | 臧漫丹, 诸大建, 刘国平, 2013. 生态福利绩效: 概念、内涵及G20实证[J]. 中国人口·资源与环境, 23(5): 118-124. |
| ZANG M D, ZHU D J, LIU G P, 2013. Ecological well-being performance: Concept, connotation and empirical of G20[J]. China Population, Resources and Environment, 23(5): 118-124. | |
| [41] |
赵林, 曹乃刚, 韩增林, 等, 2022. 中国生态福利绩效空间关联网络演变特征与形成机制[J]. 自然资源学报, 37(12): 3183-3200.
DOI |
|
ZHAO L, CAO N G, HAN Z L, et al., 2022. Evolution characteristics and formation mechanism of spatial correlation network of ecological well-being performance in China[J]. Journal of Natural Resources, 37(12): 3183-3200.
DOI |
|
| [42] | 诸大建, 2008. 生态经济学: 可持续发展的经济学和管理学[J]. 中国科学院院刊, 23(6): 520-530. |
| ZHU D J, 2008. Ecological economics: Economics and management of sustainable development[J]. Bulletin of Chinese Academy of Sciences, 23(6): 520-530. | |
| [43] | 诸大建, 张帅, 2014a. 生态福利绩效及其与经济增长的关系研究[J]. 中国人口·资源与环境, 24(9): 59-67. |
| ZHU D J, ZHANG S, 2014a. Research on ecological wellbeing performance and its relationship with economic growth[J]. China Population, Resources and Environment, 24(9): 59-67. | |
| [44] | 诸大建, 张帅, 2014b. 生态福利绩效与深化可持续发展的研究[J]. 同济大学学报(社会科学版), 25(5): 106-115. |
| ZHU D J, ZHANG S, 2014b. Ecological wellbeing performance and further research on sustainable development[J]. Journal of Tongji University (Social Science Edition), 25(5): 106-115. |
| [1] | WANG Jiali, FENG Jingke, YANG Yuanzheng, ZU Jiaxing, CAI Wenhua, YANG Jian. Research on Spatial Relations between Impervious Surfaces and the Urban Thermal Environment in the Central Metropolitan Area of Nanning City [J]. Ecology and Environment, 2023, 32(3): 525-534. |
| [2] | ZHENG Xiaohao, CHEN Yingbiao, ZHENG Zihao, GUO Cheng, HUANG Zhounan, ZHOU Yongshi. Dynamic Changes of Ecosystem Service Value and Evolution of Its Influencing Factors in Hubei Province [J]. Ecology and Environment, 2023, 32(1): 195-206. |
| Viewed | ||||||
|
Full text |
|
|||||
|
Abstract |
|
|||||
Copyright © 2021 Editorial Office of ACTA PETROLEI SINICA
Address:No. 6 Liupukang Street, Xicheng District, Beijing, P.R.China, 510650
Tel: 86-010-62067128, 86-010-62067137, 86-010-62067139
Fax: 86-10-62067130
Email: syxb@cnpc.com.cn
Support byBeijing Magtech Co.ltd, E-mail:support@magtech.com.cn