生态环境学报 ›› 2025, Vol. 34 ›› Issue (6): 831-844.DOI: 10.16258/j.cnki.1674-5906.2025.06.001
• 研究论文【生态学】 •
下一篇
袁艳峰1,2,3( ), 胡永红2,3,*(), 王鹤松1,*(), 鲁显楷4, 侯美亭5, 贾根锁6
收稿日期:2024-10-05
出版日期:2025-06-18
发布日期:2025-06-11
通讯作者:
* 胡永红, E-mail: 作者简介:袁艳峰(2000年生),女,硕士研究生,研究方向为全球变化生态学。E-mail: yyf10252023@163.com
基金资助:
YUAN Yanfeng1,2,3(), HU Yonghong2,3,*(), WANG Hesong1,*(), LU Xiankai4, HOU Meiting5, JIA Gensuo6
Received:2024-10-05
Online:2025-06-18
Published:2025-06-11
摘要:
全球变暖背景下北极温度屡破纪录,热浪灾害持续发生,严重影响着极地生态系统的健康。热浪事件对当地植被的扰动及植被对其响应的特征规律的变化已成为新的研究热点。使用台站观测识别热浪发生和影响程度,通过分析热浪的特征参数与植被总初级生产力的时空特征关联,分类探讨了强度、持续时间、发生季节不同的热浪事件对植被生产力的影响。结果表明,北欧地区热浪发生频率、持续日数和强度均呈现上升的趋势,且2000-2020年各热浪指数增长速率明显大于1980-2000年,年度发生热浪最多达18次,最大热浪累积日数达86 d,对植被正常的生理状态造成了威胁,导致了其生产力普遍下降。同时,热浪影响不断向其他季节扩张,其年度发生期跨度平均每年延长约4 d。除湿地与冰雪覆盖区域外,热浪事件均导致不同土地类型的植被总初级生产力下降,下降的比例占热浪事件总数的80.5%,其中下降幅度最大的是混交林,GPP平均降低了10.9%。热浪对植被生产力的影响存在显著的季节差异,其中夏秋季热浪事件对植被GPP下降的影响占主导作用,且秋季下降幅度也最大,而春季热浪与植被萌发同步,并未影响植被生产力的增长趋势。
中图分类号:
袁艳峰, 胡永红, 王鹤松, 鲁显楷, 侯美亭, 贾根锁. 高温热浪对北欧极地植被生产力的影响[J]. 生态环境学报, 2025, 34(6): 831-844.
YUAN Yanfeng, HU Yonghong, WANG Hesong, LU Xiankai, HOU Meiting, JIA Gensuo. Impact of Heat Waves on Vegetation Productivity in Northern Europe[J]. Ecology and Environmental Sciences, 2025, 34(6): 831-844.
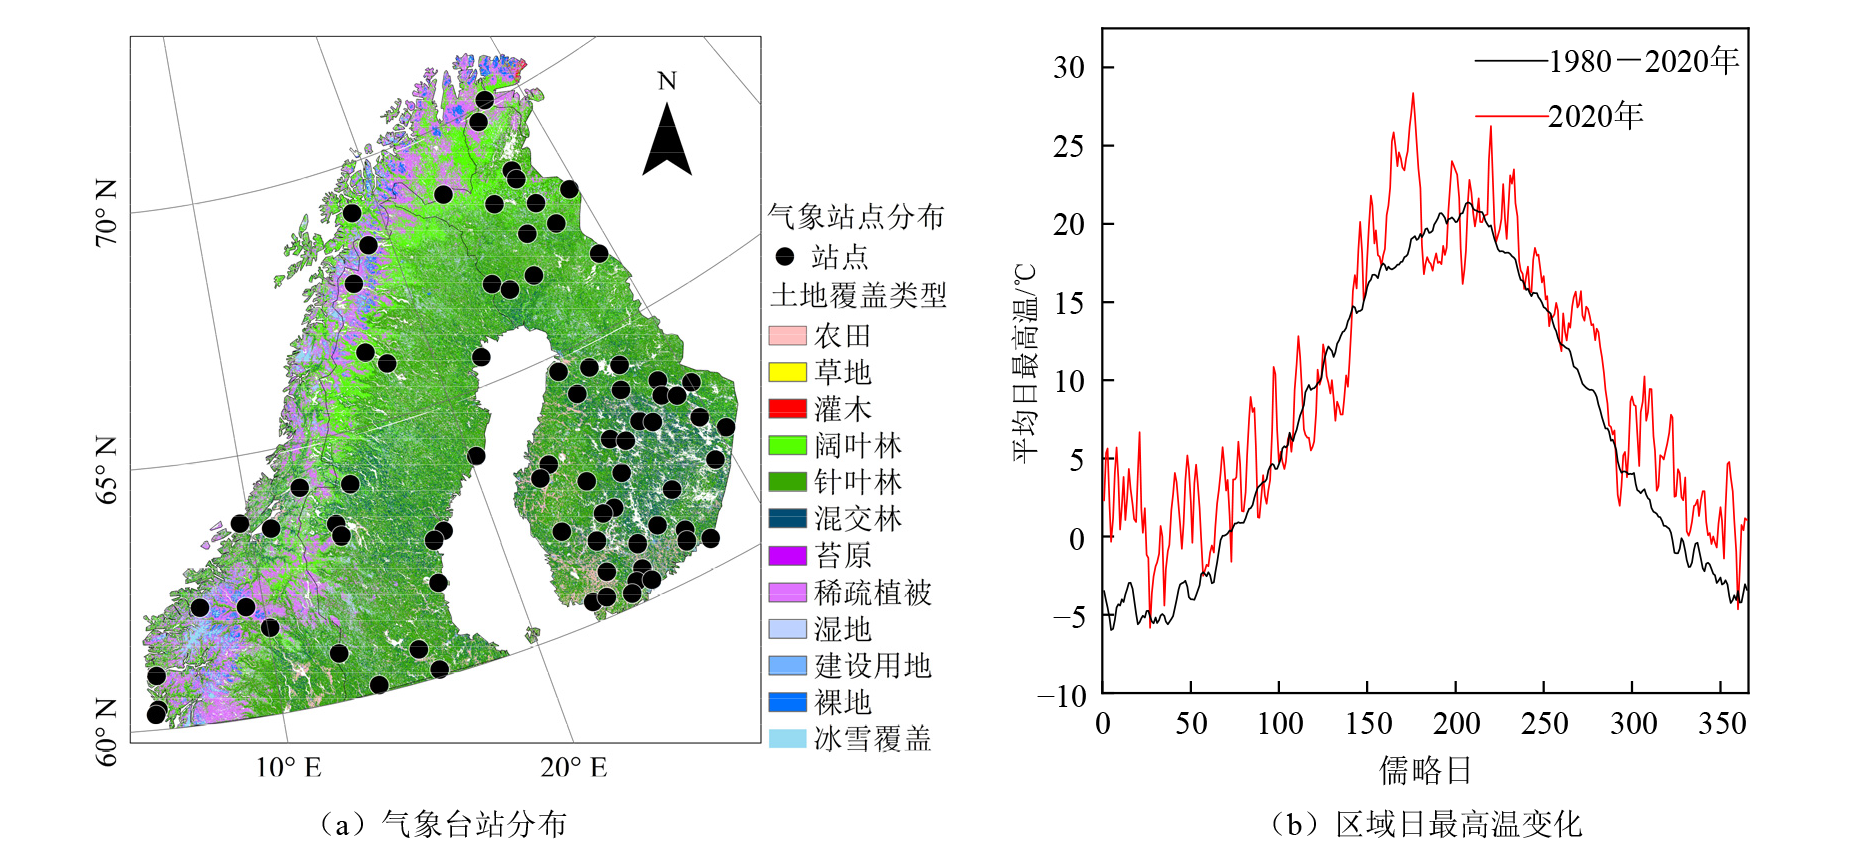
图1 研究区气象台站分布及日最高温变化特征
Figure 1 The distribution of meteorological sites and annual variation characterization of daily maximum air temperature derived from GHCN stations
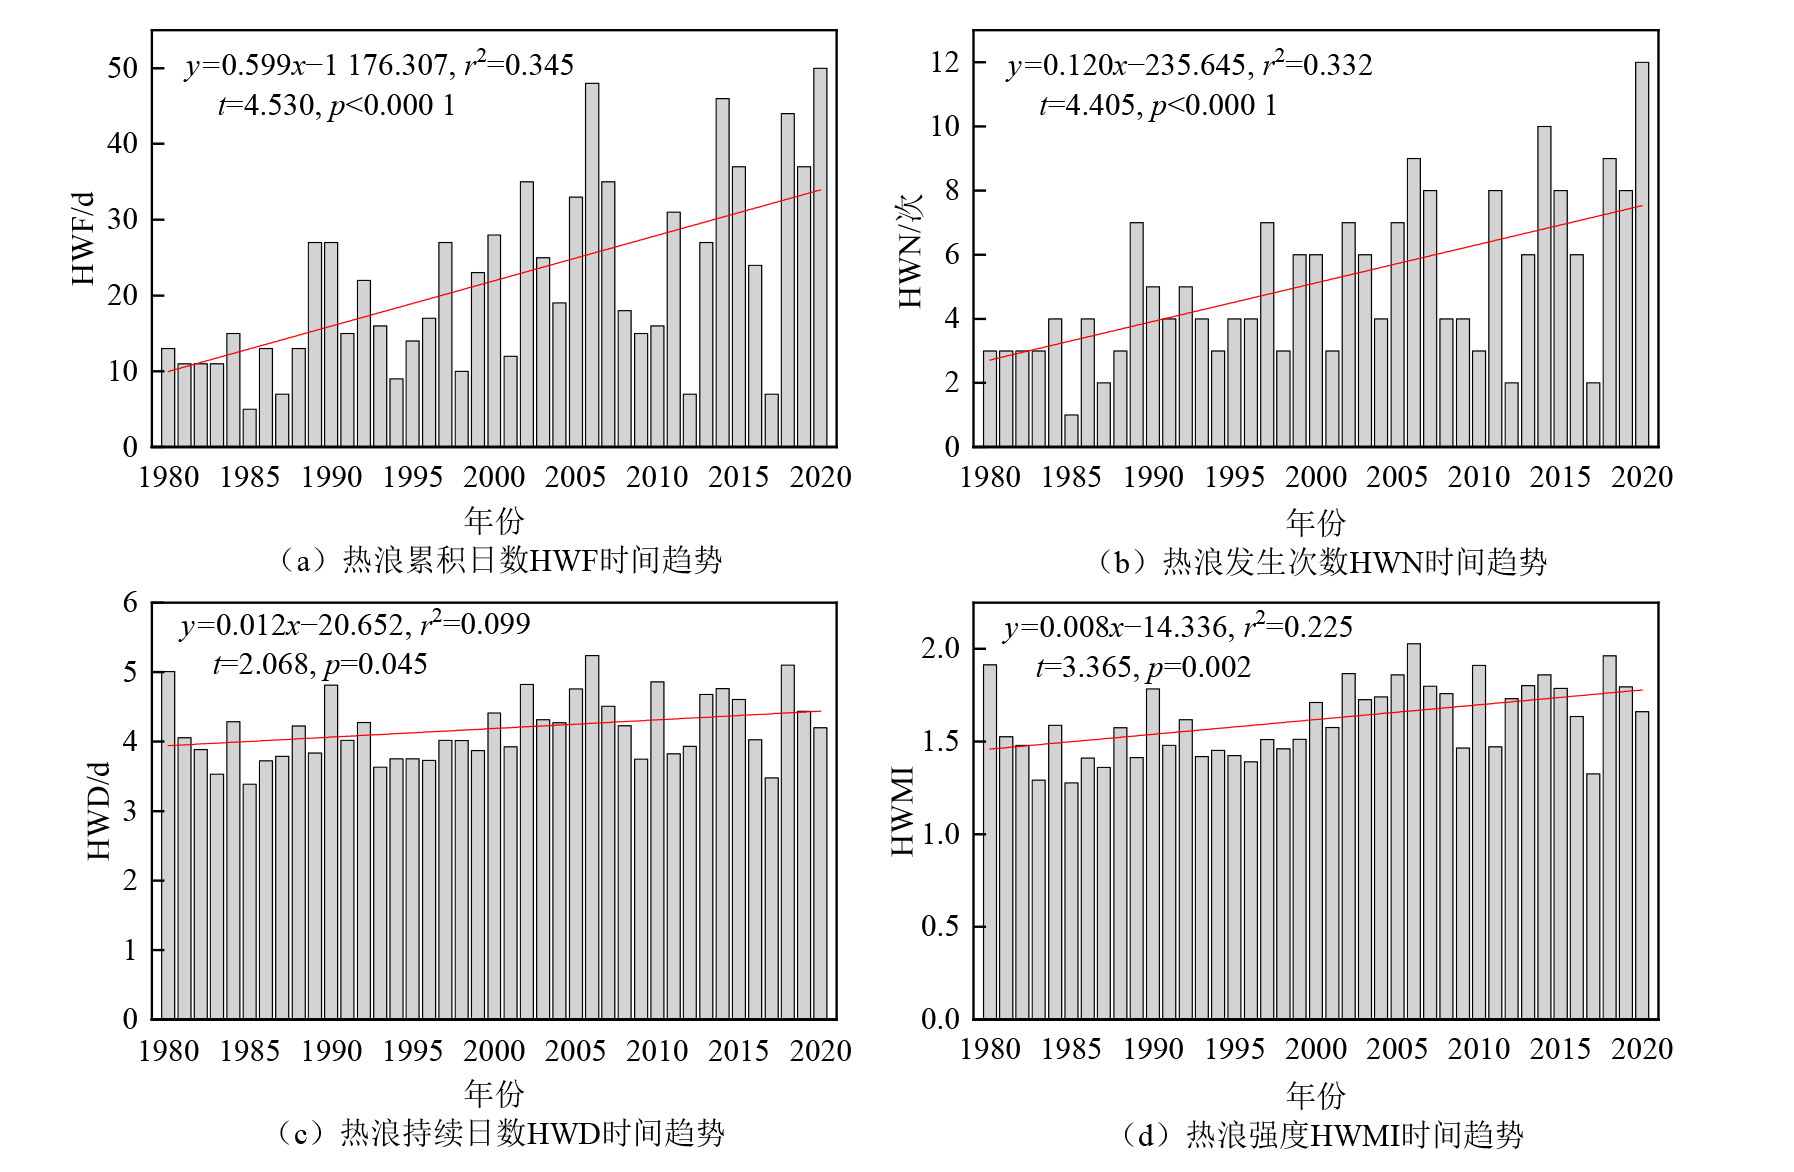
图2 1980-2020年北欧各站点平均的HWF、HWN、HWD、HWMI变化
Figure 2 The change of heat wave indices (HWF, HWN, HWD and HWMI) in northern Europe from 1980 to 2020
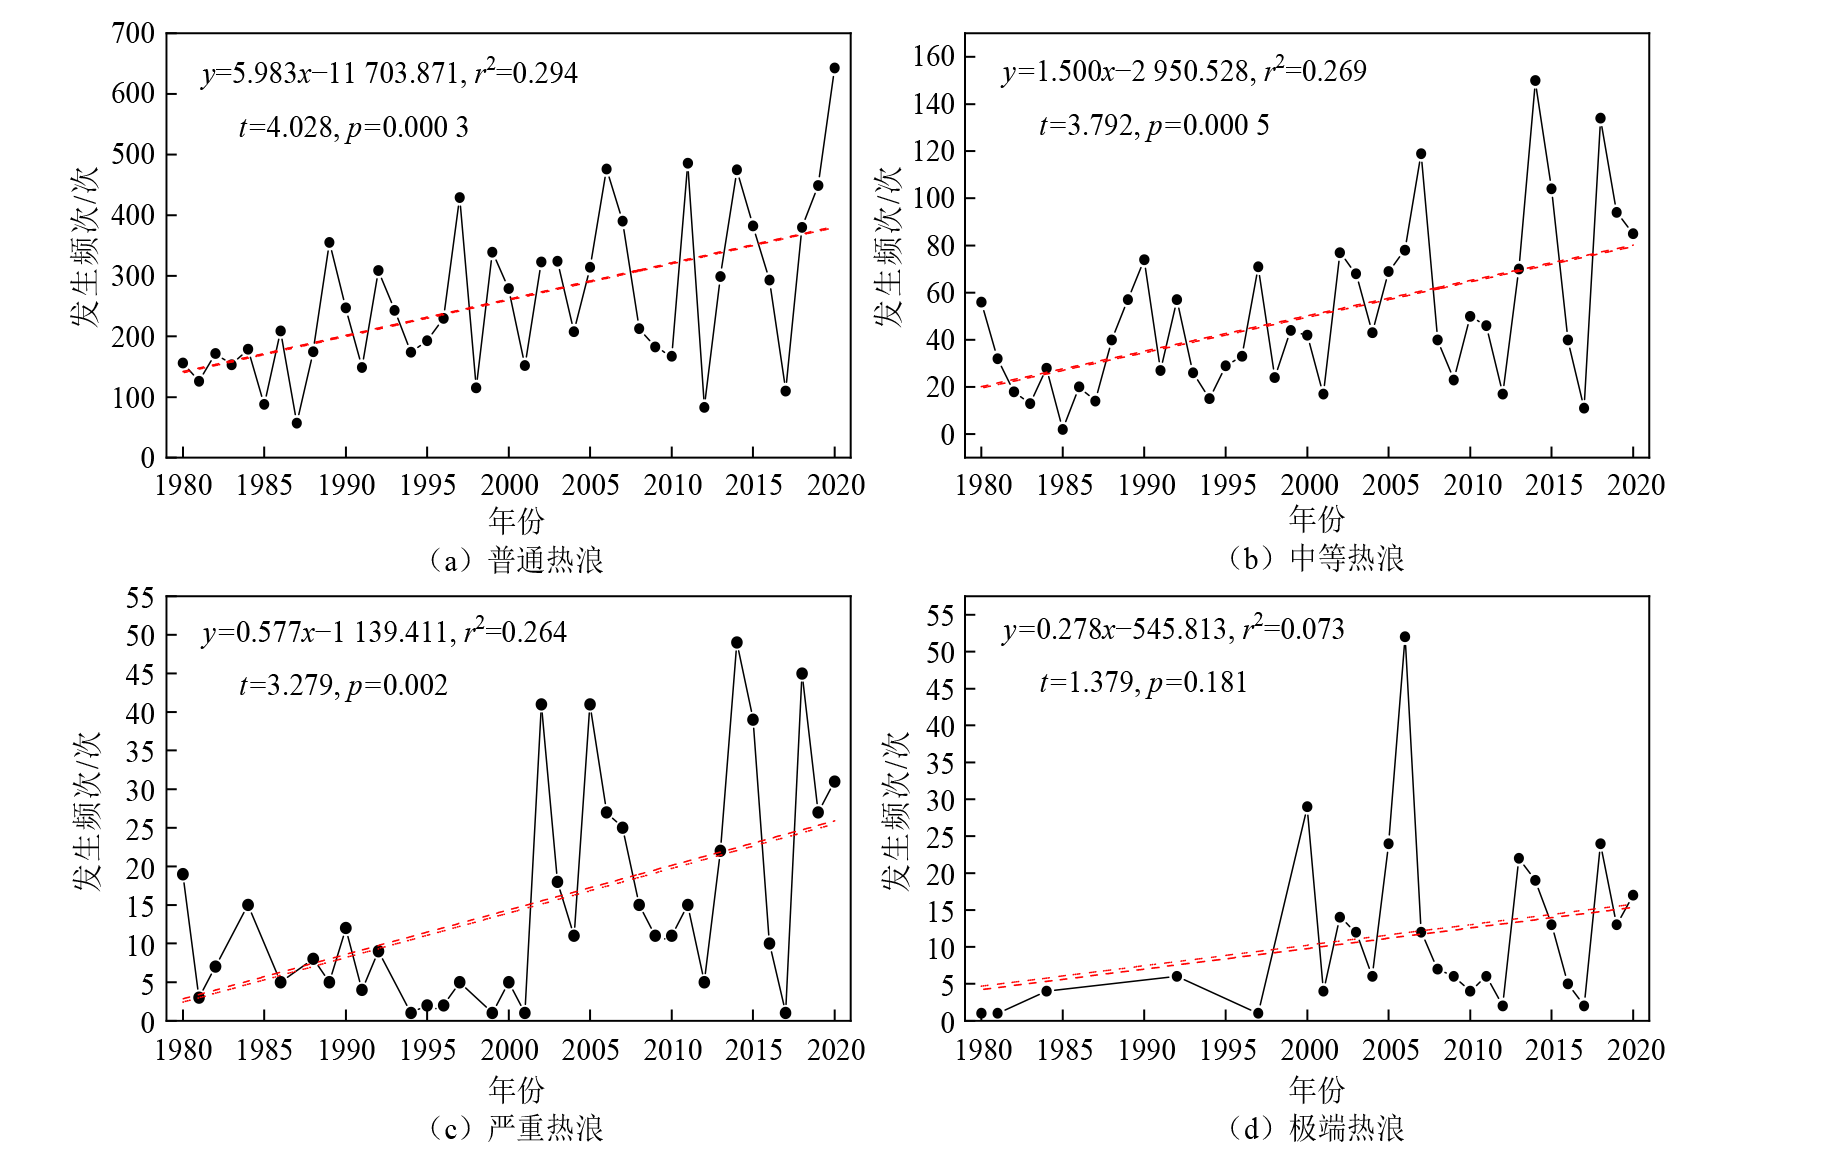
图3 近40年研究区域普通热浪、中等热浪、严重热浪、极端热浪发生总次数时间变化趋势
Figure 3 The total number of occurrences of normal, moderate, severe and extreme heat waves in last 4 decades
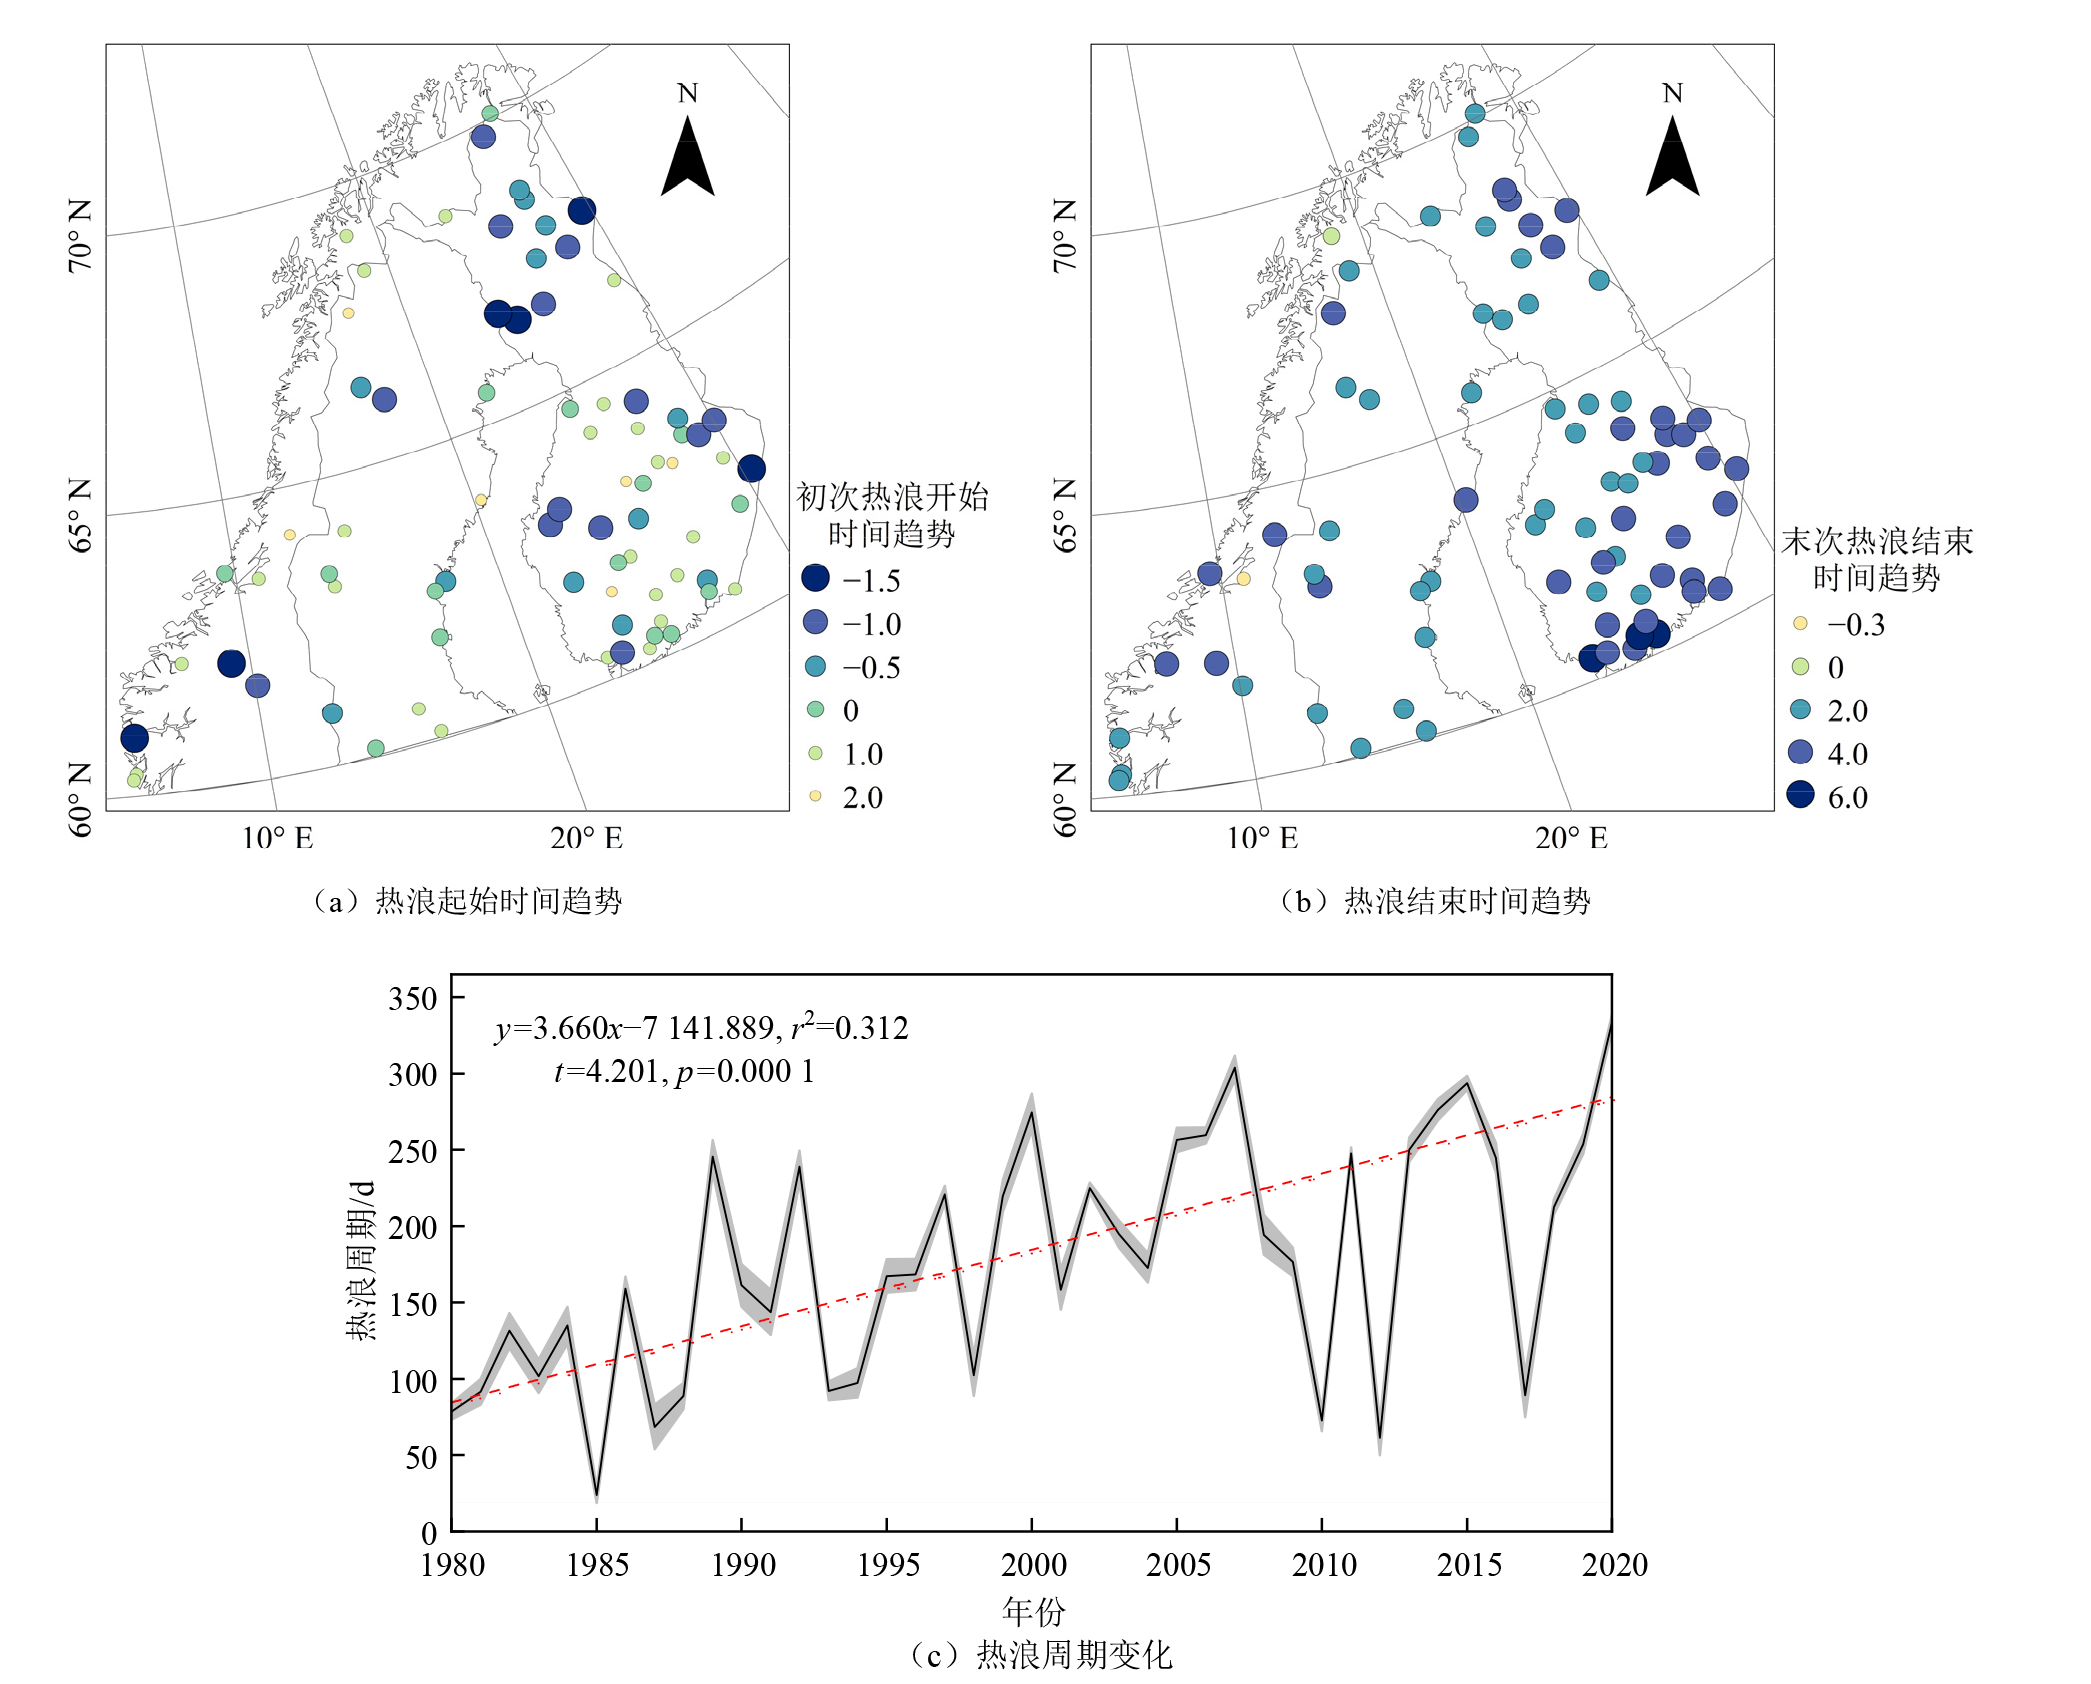
图4 1980-2020年北欧热浪发生起止时间变化的空间趋势及其影响周期的时间演变特征
Figure 4 The trend of onsetand end of annual heat waves in Northern Europe and their annual occurrence period from 1980 to 2020

图5 北欧极地热浪指数、GPP变化幅度空间分布图及热浪强度对GPP变化的影响分析
Figure 5 Spatial distribution of HWF, HWMI, the magnitude of the GPP change and analysis of the effect of heat wave intensity on GPP change in Nordic polar
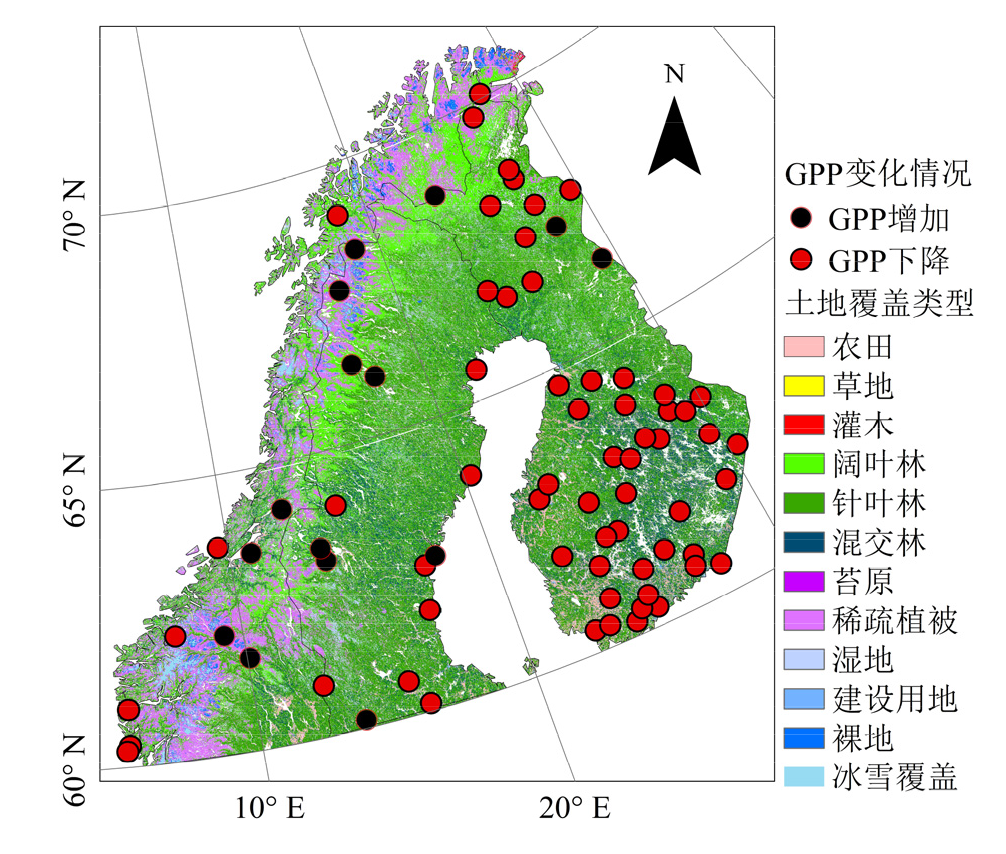
图6 研究区域不同土地覆盖类型与GPP变化
Figure 6 GPP change from 2000 to 2020 in different land cover types
| 土地覆盖类型 | GPP增加站点 个数 | GPP下降站点 个数 | GPP平均变化 幅度/% |
|---|---|---|---|
| 农田 | 3 | 16 | −8.9 |
| 草地 | 0 | 1 | −4.0 |
| 阔叶林 | 2 | 6 | −2.4 |
| 针叶林 | 4 | 13 | −4.8 |
| 混交林 | 0 | 3 | −10.9 |
| 苔原 | 1 | 2 | −6.2 |
| 湿地 | 2 | 1 | 0.2 |
| 建设用地 | 0 | 19 | −8.4 |
| 裸地 | 0 | 1 | −4.5 |
| 冰雪覆盖 | 3 | 0 | 4.1 |
表1 不同土地覆盖类型对应站点的GPP变化
Table 1 Statistics on the average change in GPP at the corresponding sites for different land cover types
| 土地覆盖类型 | GPP增加站点 个数 | GPP下降站点 个数 | GPP平均变化 幅度/% |
|---|---|---|---|
| 农田 | 3 | 16 | −8.9 |
| 草地 | 0 | 1 | −4.0 |
| 阔叶林 | 2 | 6 | −2.4 |
| 针叶林 | 4 | 13 | −4.8 |
| 混交林 | 0 | 3 | −10.9 |
| 苔原 | 1 | 2 | −6.2 |
| 湿地 | 2 | 1 | 0.2 |
| 建设用地 | 0 | 19 | −8.4 |
| 裸地 | 0 | 1 | −4.5 |
| 冰雪覆盖 | 3 | 0 | 4.1 |
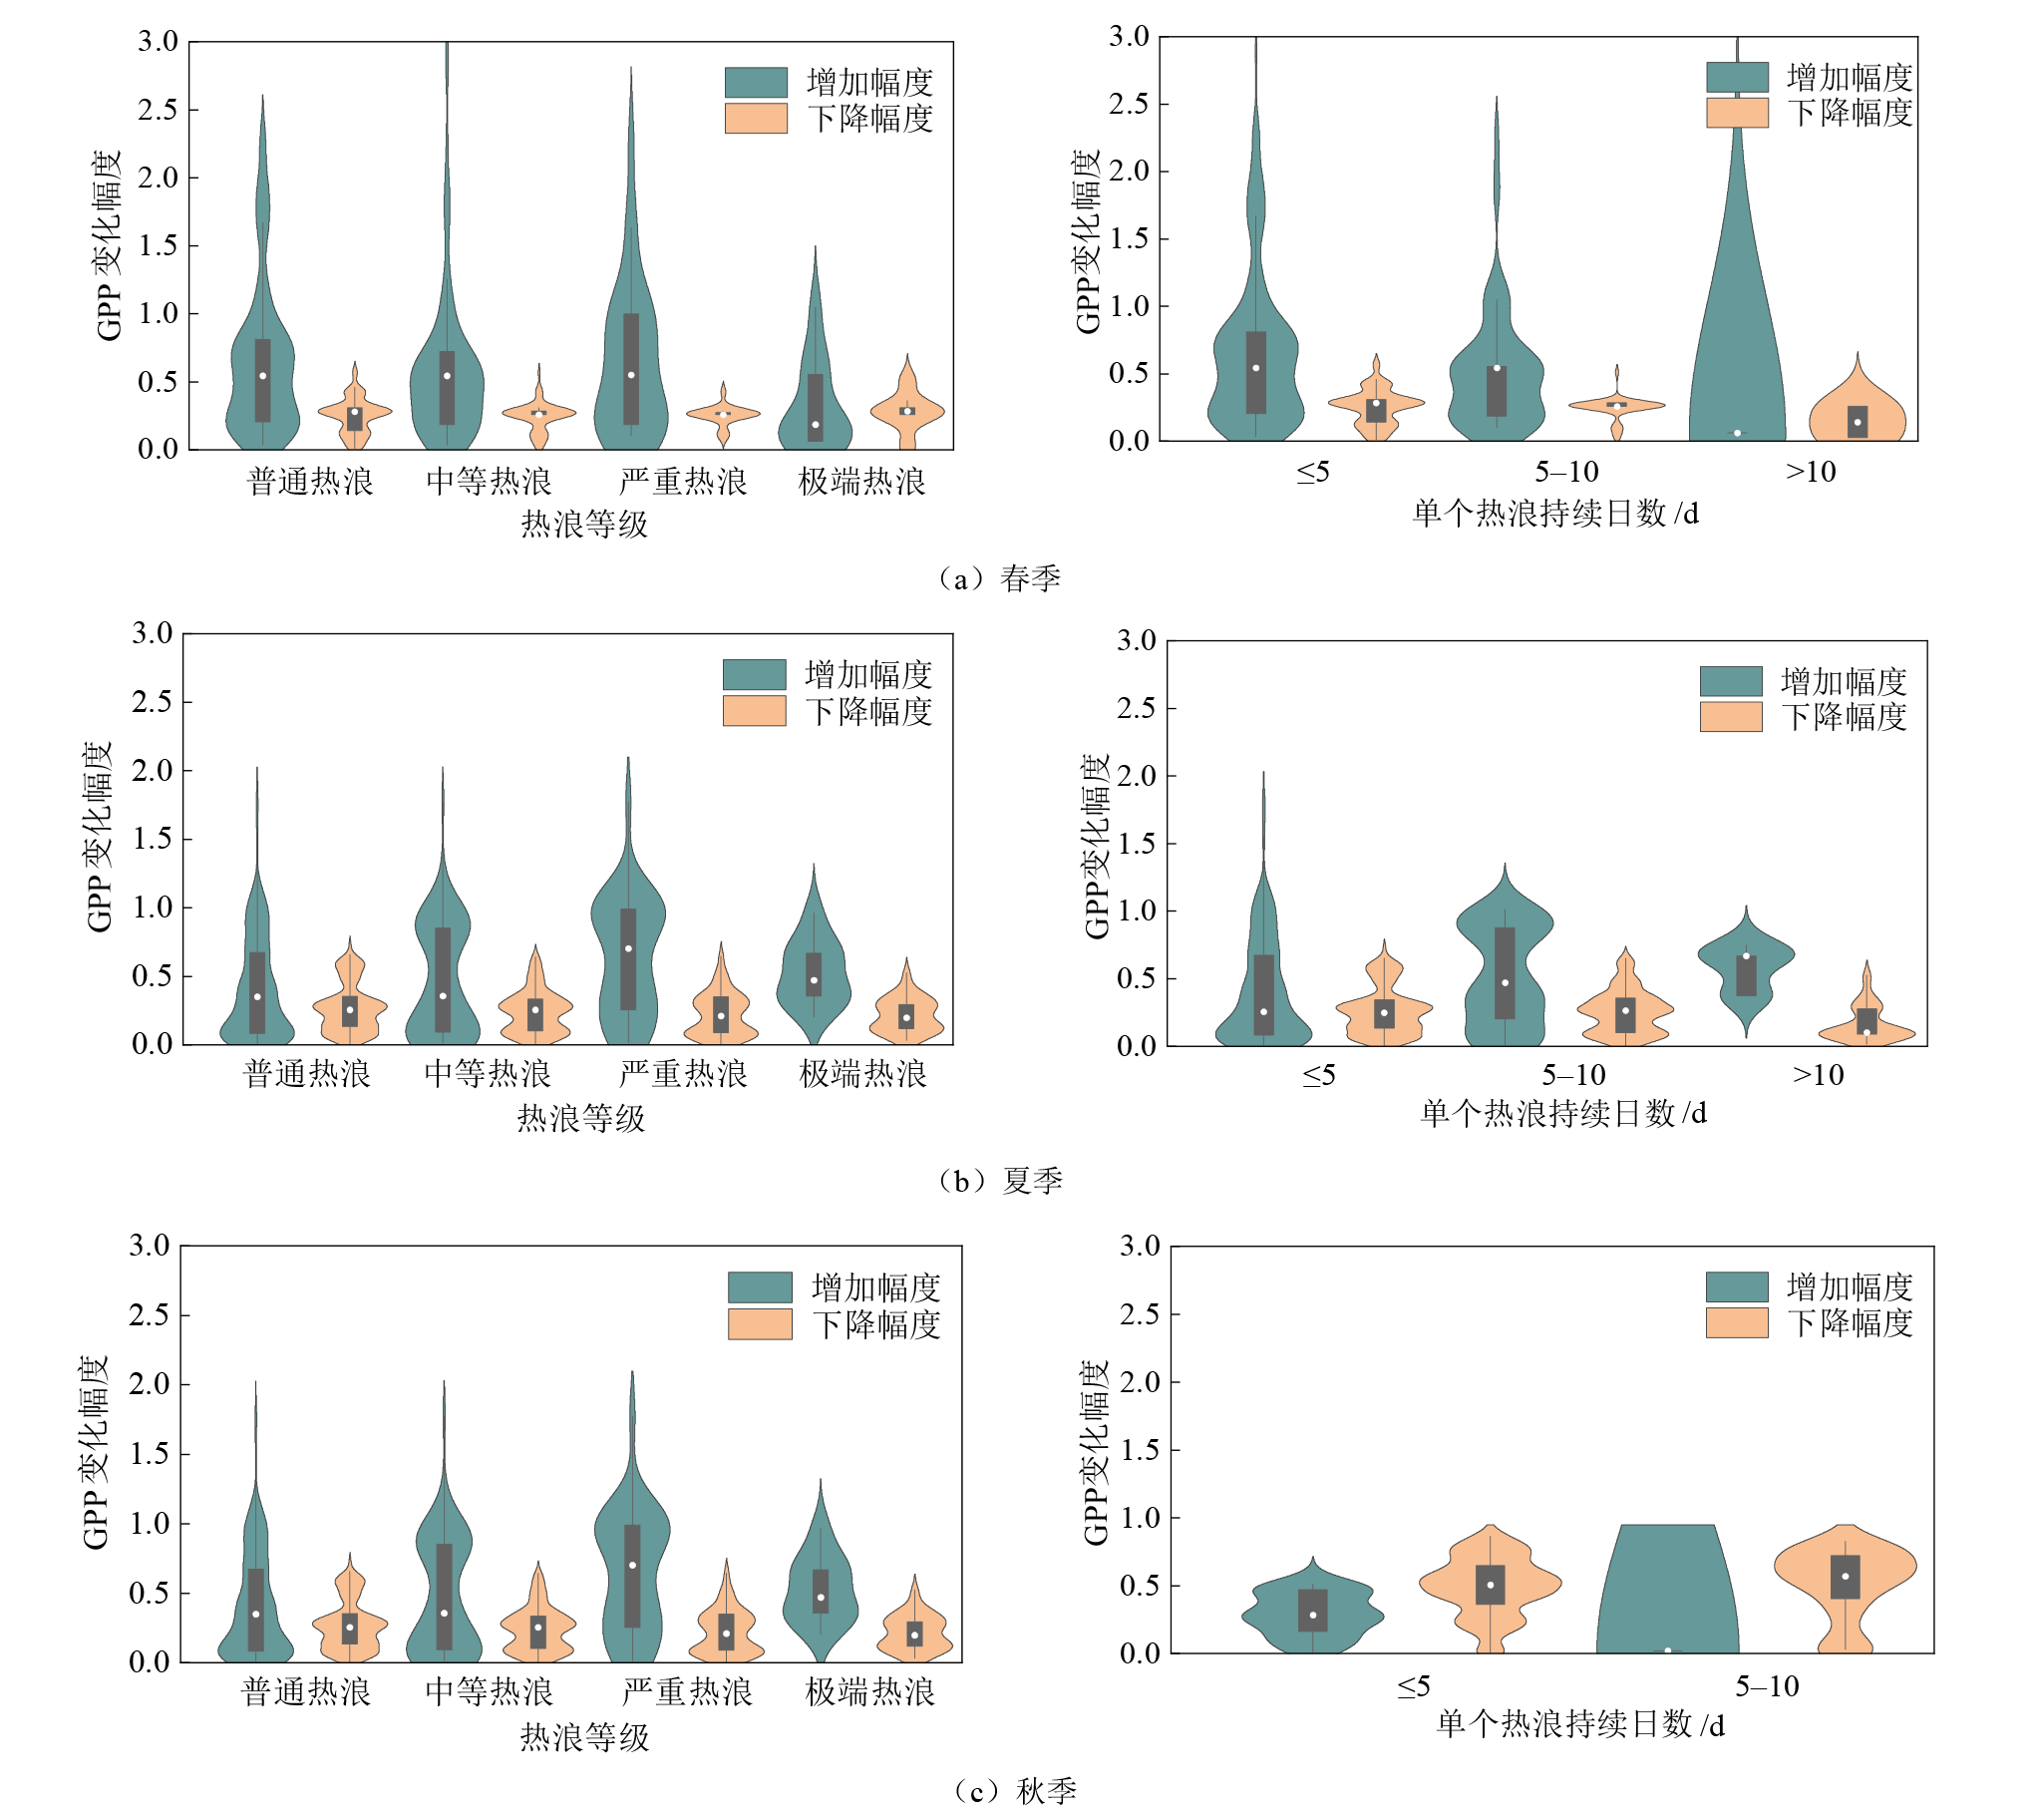
图7 不同程度与不同持续日数热浪在不同季节的GPP变化幅度
Figure 7 GPP changes in different seasons influenced by different levels of heat wave intensity and three levels of heat wave duration
| 季节 | 热浪持续 日数/d | GPP恢复周期/d | ||||||
|---|---|---|---|---|---|---|---|---|
| ≤16 | 17-24 | 25-32 | 33-40 | 41-48 | 49-56 | >56 | ||
| 春季 | ≤5 | 177 | 90 | 44 | 17 | 5 | 2 | 9 |
| 5-10 | 43 | 26 | 13 | 2 | 4 | 2 | 5 | |
| >10 | 0 | 2 | 1 | 1 | 0 | 0 | 0 | |
| 夏季 | ≤5 | 119 | 70 | 65 | 8 | 11 | 2 | 131 7 |
| 5-10 | 27 | 7 | 13 | 5 | 5 | 4 | 524 | |
| >10 | 0 | 0 | 0 | 0 | 1 | 0 | 55 | |
| 秋季 | ≤5 | 0 | 0 | 7 | 0 | 0 | 0 | 576 |
| 5-10 | 0 | 0 | 1 | 0 | 0 | 0 | 89 | |
| >10 | 0 | 0 | 0 | 0 | 0 | 0 | 0 | |
表2 不同热浪影响程度下的GPP恢复周期差异
Table 2 Differences in GPP recovery cycles at different levels of heatwave impacts
| 季节 | 热浪持续 日数/d | GPP恢复周期/d | ||||||
|---|---|---|---|---|---|---|---|---|
| ≤16 | 17-24 | 25-32 | 33-40 | 41-48 | 49-56 | >56 | ||
| 春季 | ≤5 | 177 | 90 | 44 | 17 | 5 | 2 | 9 |
| 5-10 | 43 | 26 | 13 | 2 | 4 | 2 | 5 | |
| >10 | 0 | 2 | 1 | 1 | 0 | 0 | 0 | |
| 夏季 | ≤5 | 119 | 70 | 65 | 8 | 11 | 2 | 131 7 |
| 5-10 | 27 | 7 | 13 | 5 | 5 | 4 | 524 | |
| >10 | 0 | 0 | 0 | 0 | 1 | 0 | 55 | |
| 秋季 | ≤5 | 0 | 0 | 7 | 0 | 0 | 0 | 576 |
| 5-10 | 0 | 0 | 1 | 0 | 0 | 0 | 89 | |
| >10 | 0 | 0 | 0 | 0 | 0 | 0 | 0 | |
| [1] | ALBERGEL C, DUTRA E, BONAN B, et al., 2019. Monitoring and forecasting the impact of the 2018 summer heatwave on vegetation[J]. Remote Sensing, 11(5): 520. |
| [2] | ARNONE III J A, VERBURG P S J, JOHNSON D W, et al., 2008. Prolonged suppression of ecosystem carbon dioxide uptake after an anomalously warm year[J]. Nature, 455(7211): 383-386. |
| [3] |
BARRIOPEDRO D, FISCHER E M, LUTERBACHER J, et al., 2011. The hot summer of 2010: Redrawing the temperature record map of Europe[J]. Science, 332(6026): 220-224.
DOI PMID |
| [4] | BASTOS A, GOUVEIA C M, TRIGO R M, et al., 2013. Comparing the impacts of 2003 and 2010 heatwaves in NPP over Europe[J]. Biogeosciences Discussions, 10(10): 15879-15911. |
| [5] |
CHAVES M M, FLEXAS J, PINHEIRO C, 2009. Photosynthesis under drought and salt stress: regulation mechanisms from whole plant to cell[J]. Annals of Botany, 103(4): 551-560.
DOI PMID |
| [6] |
CHEN H P, SUN J Q, LIN W Q, et al., 2020. Comparison of CMIP6 and CMIP5 models in simulating climate extremes[J]. Science Bulletin, 65(17): 1415-1418.
DOI PMID |
| [7] | CIAIS P, REICHSTEIN M, VIOVY N, et al., 2005. Europe-wide reduction in primary productivity caused by the heat and drought in 2003[J]. Nature, 437(7058): 529-533. |
| [8] | COUMOU D, ROBINSON A, RAHMSTORF S, 2013. Global increase in record-breaking monthly-mean temperatures[J]. Climatic Change, 118(3): 771-782. |
| [9] | DE BOECK H J, DREESEN F E, JANSSENS I A, et al., 2011. Whole‐system responses of experimental plant communities to climate extremes imposed in different seasons[J]. New Phytologist, 189(3): 806-817. |
| [10] | DING Q H, WALLACE J M, BATTISTI D S, et al., 2014. Tropical forcing of the recent rapid Arctic warming in northeastern Canada and Greenland[J]. Nature, 509(7499): 209-212. |
| [11] | DOUGHTY C E, KEANY J M, WIEBE B C, et al., 2023. Tropical forests are approaching critical temperature thresholds[J]. Nature, 621(7977): 105-111. |
| [12] |
ELMENDORF S C, HENRY G H, HOLLISTER R D, et al., 2012. Global assessment of experimental climate warming on tundra vegetation: Heterogeneity over space and time[J]. Ecology Letters, 15(2): 164-175.
DOI PMID |
| [13] | FENNER D, HOLTMANN A, KRUG A, et al., 2019. Heat waves in Berlin and Potsdam, Germany-Long‐term trends and comparison of heat wave definitions from 1893 to 2017[J]. International Journal of Climatology, 39(4): 2422-2437. |
| [14] | FORZIERI G, DAKOS V, MCDOWELL N G, et al., 2022. Emerging signals of declining forest resilience under climate change[J]. Nature, 608(7923): 534-539. |
| [15] | GARCIA-HERRERA R, DÍAZ J, TRIGO R M, et al., 2010. A review of the European summer heat wave of 2003[J]. Critical Reviews in Environmental Science and Technology, 40(4): 267-306. |
| [16] | GARROWAY C J, DE GREEF E, LEFORT K J, et al., 2024. Climate change introduces threatened killer whale populations and conservation challenges to the Arctic[J]. Global Change Biology, 30(6): e17352. |
| [17] | GEHRIG R, 2006. The influence of the hot and dry summer 2003 on the pollen season in Switzerland[J]. Aerobiologia, 22(1): 27-34. |
| [18] | GERSHUNOV A, GUIRGUIS K, 2012. California heat waves in the present and future[J]. Geophysical Research, Letters, 39(18): L18710. |
| [19] | HABEEB D, VARGO J, STONE B, 2015. Rising heat wave trends in large US cities[J]. Natural Hazards, 76: 1651-1665. |
| [20] |
HEUTEL G, MILLER N H, MOLITOR D, 2021. Adaptation and the mortality effects of temperature across US climate regions[J]. The Review of Economics and Statistics, 103(4): 740-753.
DOI PMID |
| [21] | KIM H Y, HORIE T, NAKAGAWA H, et al., 1996. Effects of elevated CO2 concentration and high temperature on growth and yield of rice: II. The effect on yield and its components of Akihikari rice[J]. Japanese Journal of Crop Science, 65(4): 644-651. |
| [22] | LIAN X, PIAO S L, LI L Z X, et al., 2020. Summer soil drying exacerbated by earlier spring greening of northern vegetation[J]. Science Advances, 6(1): eaax0255. |
| [23] | MARX W, HAUNSCHILD R, BORNMANN L, 2021. Heat waves: A hot topic in climate change research[J]. Theoretical and Applied Climatology, 146(1-2): 781-800. |
| [24] | MAZDIYASNI O, AGHAKOUCHAK A, DAVIS S J, et al., 2017. Increasing probability of mortality during Indian heat waves[J]. Science Advances, 3(6): e1700066. |
| [25] |
MEEHL G A, TEBALDI C, 2004. More intense, more frequent, and longer lasting heat waves in the 21st century[J]. Science, 305(5686): 994-997.
DOI PMID |
| [26] | MYERS-SMITH I H, FORBES B C, WILMKING M, et al., 2011. Shrub expansion in tundra ecosystems: Dynamics, impacts and research priorities[J]. Environmental Research Letters, 6(4): 045509. |
| [27] | PERKINS S E, ALEXANDER L V, 2013. On the measurement of heat waves[J]. Journal of Climate, 26(13): 4500-4517. |
| [28] | PIAO S L, FRIEDLINGSTEIN P, CIAIS P, et al., 2007. Changes in climate and land use have a larger direct impact than rising CO2 on global river runoff trends[J]. Proceedings of the National Academy of Sciences, 104(39): 15242-15247. |
| [29] | PITICAR A, CROITORU A E, CIUPERTEA F A, et al., 2018. Recent changes in heat waves and cold waves detected based on excess heat factor and excess cold factor in Romania[J]. International Journal of Climatology, 38(4): 1777-1793. |
| [30] | REBETEZ M, DUPONT O, GIROUD M, 2009. An analysis of the July 2006 heatwave extent in Europe compared to the record year of 2003[J]. Theoretical and Applied Climatology, 95: 1-7. |
| [31] | REICHSTEIN M, BAHN M, CIAIS P, et al., 2013. Climate extremes and the carbon cycle[J]. Nature, 500(7462): 287-295. |
| [32] | PEARSON R G, PHILLIPS S J, LORANTY M M, et al., 2013. Shifts in Arctic vegetation and associated feedbacks under climate change[J]. Nature Climate Change, 3(7): 673-677. |
| [33] | RIGOR I G, COLONY R L, MARTIN S, 2000. Variations in surface air temperature observations in the Arctic, 1979-97[J]. Journal of Climate, 13(5): 896-914. |
| [34] | RUSSO S, DOSIO A, GRAVERSEN R G, et al., 2014. Magnitude of extreme heat waves in present climate and their projection in a warming world[J]. Journal of Geophysical Research: Atmospheres, 119(22): 12500-12512. |
| [35] | RUSSO S, SILLMANN J, FISCHER E M, 2015. Top ten European heatwaves since 1950 and their occurrence in the coming decades[J]. Environmental Research Letters, 10(12): 124003. |
| [36] | SALVUCCI M E, CRAFTS-BRANDNER S J, 2004. Inhibition of photosynthesis by heat stress: the activation state of Rubisco as a limiting factor in photosynthesis[J]. Physiologia Plantarum, 120(2): 179-186. |
| [37] | SCHWALM C R, WILLIAMS C A, SCHAEFER K, et al., 2012. Reduction in carbon uptake during turn of the century drought in western north America[J]. Nature Geoscience, 5(8): 551-556. |
| [38] | SHI Z T, JIA G S, ZHOU Y Y, et al., 2021. Amplified intensity and duration of heatwaves by concurrent droughts in China[J]. Atmospheric Research, 261(24): 105743. |
| [39] | STRANDBERG G, ANDERSSON B, BERLIN A, 2024. Plant pathogen infection risk and climate change in the Nordic and Baltic countries[J]. Environmental Research Communications, 6(3): 031008. |
| [40] | SWANN A L, FUNG I Y, LEVIS S, et al., 2010. Changes in Arctic vegetation amplify high-latitude warming through the greenhouse effect[J]. Proceedings of the National Academy of Sciences, 107(4): 1295-1300. |
| [41] | TESKEY R, WERTIN T, BAUWERAERTS I, et al., 2015. Responses of tree species to heat waves and extreme heat events[J]. Plant, Cell & Environment, 38(9): 1699-1712. |
| [42] | TRENBERTH K E, FASULLO J T, 2012. Climate extremes and climate change: The Russian heat wave and other climate extremes of 2010[J]. Journal of Geophysical Research: Atmospheres, 117(D17): D17103. |
| [43] | VON BUTTLAR J, ZSCHEISCHLER J, RAMMIG A, et al., 2018. Impacts of droughts and extreme-temperature events on gross primary production and ecosystem respiration: A systematic assessment across ecosystems and climate zones[J]. Biogeosciences, 15(5): 1293-1318. |
| [44] | WANG X R, QIU B, LI W K, et al., 2019. Impacts of drought and heatwave on the terrestrial ecosystem in China as revealed by satellite solar-induced chlorophyll fluorescence[J]. Science of The Total Environment, 693: 133627. |
| [45] | WANG Y K, SONG J, 2023b. Field-measured hydraulic traits and remotely sensed NDVI of four subtropical tree species showed transient declines during the drought-heatwave event[J]. Forests, 14(7): 1420. |
| [46] | WANG H J, TANG K, 2023a. Extreme climate, innovative ability and energy efficiency[J]. Energy Economics, 120: 106586. |
| [47] | WEI Y C, YU M, WEI J F, et al., 2023. Impacts of Extreme Climates on Vegetation at Middle-to-High Latitudes in Asia[J]. Remote Sensing, 15(5): 1251. |
| [48] | YUAN W P, CAI W W, CHEN Y, et al., 2016. Severe summer heatwave and drought strongly reduced carbon uptake in southern China[J]. Scientific Reports, 6(1): 18813. |
| [49] | ZACHARIAS S, KOPPE C, MÜCKE H G, 2014. Climate change effects on heat waves and future heat wave-associated IHD mortality in Germany[J]. Climate, 3(1): 100-117. |
| [50] | ZHANG Y C, PIAO S L, SUN Y, et al., 2022. Future reversal of warming- enhanced vegetation productivity in the northern Hemisphere[J]. Nature Climate Change, 12(6): 581-586. |
| [51] | 方精云, 柯金虎, 唐志尧, 等, 2001. 生物生产力的 “4P” 概念、估算及其相互关系[J]. 植物生态学报, 25(4): 414-419. |
| FANG J Y, KE Z H, TANG Z Y, et al., 2001. Implications and estimations of four terrestrial productivity parameters[J]. Acta Phytoecological Sinica, 25(4): 414-419. | |
| [52] | 耿庆玲, 陈晓青, 赫晓慧, 等, 2022. 中国不同植被类型归一化植被指数对气候变化和人类活动的响应[J]. 生态学报, 42(9): 3557-3568. |
| GENG Q L, CHEN X Q, HE X H, et al., 2022. Vegetation dynamics and its response to climate change and human activities based on different vegetation types in China[J]. Acta Ecologica Sinica, 42(9): 3557-3568. | |
| [53] |
罗犀, 张玉兰, 康世昌, 等, 2023. AMAP评估报告解读: 北极气候变化及其影响的新认识[J]. 冰川冻土, 45(6): 1757-1766.
DOI |
|
LUO X, ZHANG Y L, KANG S C, et al., 2023. Interpretation of AMAP assessment reports: Update of arctic climate change and impacts[J]. Journal of Glaciology and Geocryology, 45(6): 1757-1766.
DOI |
|
| [54] | 孙迈, 李鹏, 任培鑫, 2023. 青藏高原植被物候对不同强度极端温度和降水的差异化响应[J]. 中国科学: 地球科学, 53(10): 2231-2242. |
| SUN M, LI P, REN P X, et al., 2023. Divergent response of vegetation phenology to extreme temperatures and precipitation of different intensities on the Tibetan Plateau[J]. Science China Earth Sciences, 53(10): 2231-2242. | |
| [55] | 吴锦成, 朱烨, 刘懿, 等, 2022. 中国热浪时空变化特征分析[J]. 水文, 42(3): 72-77. |
| WU J C, ZHU Y, LIU Y, et al., 2022. Spatial-temporal characteristics of heat waves in China[J]. Journal of China Hydrology, 42(3): 72-77. | |
| [56] |
武丰民, 李文铠, 李伟, 2019. 北极放大效应原因的研究进展[J]. 地球科学进展, 34(3): 232-242.
DOI |
| WU F M, LI W K, LI W, 2019. Causes of Arctic amplification: A review[J]. Advances in Earth Science, 34(3): 232-242. | |
| [57] | 徐勇, 黄雯婷, 窦世卿, 等, 2022. 2000-2020年西南地区植被NDVI对气候变化和人类活动响应特征[J]. 环境科学, 43(6): 3230-3240. |
| XU Y, HUANG W T, DOU S Q, et al., 2022. Responding mechanism of vegetation cover to climate change and human activities in Southwest China from 2000 to 2020[J]. Environmental Science, 43(6): 3230-3240. | |
| [58] | 周波涛, 钱进, 2021. IPCC AR6报告解读: 极端天气气候事件变化[J]. 气候变化研究进展, 17(6): 713-718. |
| ZHOU B T, QIAN J, 2021. Changes of weather and climate extremes in the IPCC AR6[J]. Climate Change Research, 17(6): 713-718. |
| [1] | 李新妹, 吴作航, 王震山, 翁升恒, 孙朝锋, 关辉, 王宏. 基于MODIS遥感数据的福建植被生产力时空分布与干旱响应分析[J]. 生态环境学报, 2024, 33(6): 841-852. |
| 阅读次数 | ||||||
|
全文 |
|
|||||
|
摘要 |
|
|||||