生态环境学报 ›› 2025, Vol. 34 ›› Issue (2): 279-292.DOI: 10.16258/j.cnki.1674-5906.2025.02.010
孙艺菲1,2,3( ), 孟丹1,2,3,*(), 宋加颖1,2,3, 胡非凡1,2,3, 李小娟1,2,3
收稿日期:2024-08-13
出版日期:2025-02-18
发布日期:2025-03-03
通讯作者:
*孟丹。E-mail: mengdan@cnu.edu.cn作者简介:孙艺菲(2002年生),女,学士,研究方向为资源环境遥感。E-mail: 1203601010@cnu.edu.cn
基金资助:
SUN Yifei1,2,3(), MENG Dan1,2,3,*(), SONG Jiaying1,2,3, HU Feifan1,2,3, LI Xiaojuan1,2,3
Received:2024-08-13
Online:2025-02-18
Published:2025-03-03
摘要:
北京作为中国首都和人口密集城市,其城市热岛效应问题较为严重,研究其热岛效应与人口热暴露风险对于减轻夏季高温对居民健康的不利影响至关重要。基于局地气候分区(Local Climate Zones,LCZ)分析北京市五环路内夏季地表温度(Land Surface Temperature,LST)及地表城市热岛强度(Surface Urban Island Intensity,SUHII)的日变化规律,探究不同LCZ间城市热环境的日动态变化和空间格局,并结合不同时刻的人口数据研究人口热暴露强度的时空分布特征,评估风险等级。结果表明:1)一天中研究区内的平均LST整体呈现先上升后下降的趋势,城市中心保持较高地表温度,SUHII先增加后减弱,夜间局部热岛现象消失,SUHII呈现出从城市中心向外围逐渐降低的层级结构;2)研究区内以紧凑型建筑区为主,不同LCZ类型的昼夜LST变化和SUHII差异显著,紧凑型建筑区的平均LST高于开阔型建筑区,白天SUHII平均值随着建筑高度升高而减小,夜间则相反;3)研究区内不同等级的人口热暴露强度在日内呈现出不同的变化趋势,一天中热暴露强度由城市中心逐渐向外扩散,正午时达到峰值,傍晚至夜间降至最低。因此在城市规划中,应避免过于密集的中高层建筑,并重视提高植被覆盖率,以缓解城市热岛效应,降低人口热暴露风险。
中图分类号:
孙艺菲, 孟丹, 宋加颖, 胡非凡, 李小娟. 局地气候分区视角下北京市五环内城市热环境及人口热暴露风险日动态变化研究[J]. 生态环境学报, 2025, 34(2): 279-292.
SUN Yifei, MENG Dan, SONG Jiaying, HU Feifan, LI Xiaojuan. Study on the Diurnal Dynamic Changes of Urban Thermal Environment and Population Heat Exposure Risk within Beijing’s Fifth Ring Road from the Perspective of Local Climate Zones[J]. Ecology and Environment, 2025, 34(2): 279-292.
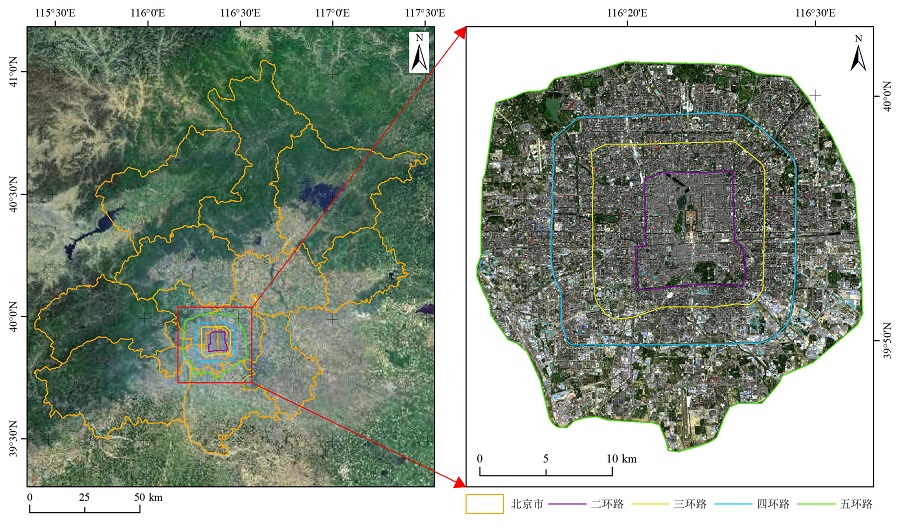
图1 研究区域示意图
Figure 1 Diagram of the studied area
| 局地气候分区 | 类型 名称 | BSF/ % | ISF/ % | PSF/ % | SVF | HRE/ m |
|---|---|---|---|---|---|---|
| LCZ 1 | 紧凑型高层建筑 | 40-60 | 40-60 | <10 | 0.2-0.4 | >25 |
| LCZ 2 | 紧凑型中层建筑 | 40-70 | 30-50 | <20 | 0.3-0.6 | 10-25 |
| LCZ 3 | 紧凑型低层建筑 | 40-70 | 20-50 | <30 | 0.2-0.6 | 3-10 |
| LCZ 4 | 开阔型高层建筑 | 20-40 | 30-40 | 30-40 | 0.5-0.7 | >25 |
| LCZ 5 | 开阔型中层建筑 | 20-40 | 30-50 | 20-40 | 0.5-0.8 | 10-25 |
| LCZ 6 | 开阔型低层建筑 | 20-40 | 20-50 | 30-60 | 0.6-0.9 | 3-10 |
| LCZ 7 | 简易低层建筑 | 60-90 | <20 | <30 | 0.2-0.5 | 2-4 |
| LCZ 8 | 大型低层建筑 | 30-50 | 40-50 | <20 | >0.7 | 3-10 |
| LCZ 9 | 零散低层建筑 | 10-20 | 60-80 | <20 | >0.8 | 3-10 |
| LCZ 10 | 工业厂房 | 20-30 | 20-40 | 40-50 | 0.6-0.9 | 5-15 |
| LCZ A | 茂密树林 | <10 | <10 | >90 | <0.4 | 3-10 |
| LCZ B | 稀疏树林 | <10 | <10 | >90 | 0.5-0.8 | 3‒15 |
| LCZ C | 灌木丛 | <10 | <10 | >90 | 0.7-0.8 | <2 |
| LCZ D | 低矮树林 | <10 | <10 | >90 | >0.9 | <0.25 |
| LCZ E | 岩石或人工地面 | <10 | >90 | <10 | >0.9 | <0.25 |
| LCZ F | 裸地沙土 | <10 | <10 | >90 | >0.9 | <0.25 |
| LCZ G | 水体 | <10 | <10 | >90 | >0.9 | - |
表1 LCZ分类参数
Table 1 LCZ parameter
| 局地气候分区 | 类型 名称 | BSF/ % | ISF/ % | PSF/ % | SVF | HRE/ m |
|---|---|---|---|---|---|---|
| LCZ 1 | 紧凑型高层建筑 | 40-60 | 40-60 | <10 | 0.2-0.4 | >25 |
| LCZ 2 | 紧凑型中层建筑 | 40-70 | 30-50 | <20 | 0.3-0.6 | 10-25 |
| LCZ 3 | 紧凑型低层建筑 | 40-70 | 20-50 | <30 | 0.2-0.6 | 3-10 |
| LCZ 4 | 开阔型高层建筑 | 20-40 | 30-40 | 30-40 | 0.5-0.7 | >25 |
| LCZ 5 | 开阔型中层建筑 | 20-40 | 30-50 | 20-40 | 0.5-0.8 | 10-25 |
| LCZ 6 | 开阔型低层建筑 | 20-40 | 20-50 | 30-60 | 0.6-0.9 | 3-10 |
| LCZ 7 | 简易低层建筑 | 60-90 | <20 | <30 | 0.2-0.5 | 2-4 |
| LCZ 8 | 大型低层建筑 | 30-50 | 40-50 | <20 | >0.7 | 3-10 |
| LCZ 9 | 零散低层建筑 | 10-20 | 60-80 | <20 | >0.8 | 3-10 |
| LCZ 10 | 工业厂房 | 20-30 | 20-40 | 40-50 | 0.6-0.9 | 5-15 |
| LCZ A | 茂密树林 | <10 | <10 | >90 | <0.4 | 3-10 |
| LCZ B | 稀疏树林 | <10 | <10 | >90 | 0.5-0.8 | 3‒15 |
| LCZ C | 灌木丛 | <10 | <10 | >90 | 0.7-0.8 | <2 |
| LCZ D | 低矮树林 | <10 | <10 | >90 | >0.9 | <0.25 |
| LCZ E | 岩石或人工地面 | <10 | >90 | <10 | >0.9 | <0.25 |
| LCZ F | 裸地沙土 | <10 | <10 | >90 | >0.9 | <0.25 |
| LCZ G | 水体 | <10 | <10 | >90 | >0.9 | - |
| 成像时间(UTC+8) | 气温/℃ | 天气 |
|---|---|---|
| 2020-08-11T10:42 | 34-25 | 晴,西南风2级 |
| 2022-06-18T13:41 | 32-22 | 晴,东南风2级 |
| 2018-08-04T15:29 | 36-27 | 晴,南风1-2级 |
| 2019-09-24T18:02 | 31-15 | 晴,东北风2级 |
| 2019-09-28T22:55 | 30-17 | 晴,西南风1级 |
| 2019-09-25T00:32 | 31-15 | 晴,西南风2级 |
| 2018-09-07T02:07 | 27-18 | 晴,西北风4级 |
| 2019-08-29T04:39 | 31-20 | 晴,西北风3级 |
| 2022-09-02T07:49 | 28-18 | 晴,南风2级 |
表2 ECOSTRESS LST数据选取
Table 2 ECOSTRESS LST data selection
| 成像时间(UTC+8) | 气温/℃ | 天气 |
|---|---|---|
| 2020-08-11T10:42 | 34-25 | 晴,西南风2级 |
| 2022-06-18T13:41 | 32-22 | 晴,东南风2级 |
| 2018-08-04T15:29 | 36-27 | 晴,南风1-2级 |
| 2019-09-24T18:02 | 31-15 | 晴,东北风2级 |
| 2019-09-28T22:55 | 30-17 | 晴,西南风1级 |
| 2019-09-25T00:32 | 31-15 | 晴,西南风2级 |
| 2018-09-07T02:07 | 27-18 | 晴,西北风4级 |
| 2019-08-29T04:39 | 31-20 | 晴,西北风3级 |
| 2022-09-02T07:49 | 28-18 | 晴,南风2级 |
| 时间 | 最大值 | 最小值 | 平均值 | 标准差 |
|---|---|---|---|---|
| 0:32 | 22.37 | 11.03 | 18.48 | 1.44 |
| 2:07 | 23.95 | 13.59 | 18.62 | 0.84 |
| 4:39 | 23.49 | 11.15 | 18.45 | 1.45 |
| 7:49 | 27.23 | 18.17 | 21.36 | 0.84 |
| 10:42 | 51.09 | 28.51 | 38.49 | 2.73 |
| 13:41 | 62.41 | 26.21 | 42.95 | 3.3 |
| 15:29 | 50.37 | 24.29 | 41.49 | 2.33 |
| 18:02 | 29.67 | 18.97 | 25.18 | 1.09 |
| 22:55 | 22.93 | 14.07 | 18.99 | 1.22 |
表3 研究区昼夜LST统计特征 ℃
Table 3 The statistical characteristics of diurnal LST in the studied area
| 时间 | 最大值 | 最小值 | 平均值 | 标准差 |
|---|---|---|---|---|
| 0:32 | 22.37 | 11.03 | 18.48 | 1.44 |
| 2:07 | 23.95 | 13.59 | 18.62 | 0.84 |
| 4:39 | 23.49 | 11.15 | 18.45 | 1.45 |
| 7:49 | 27.23 | 18.17 | 21.36 | 0.84 |
| 10:42 | 51.09 | 28.51 | 38.49 | 2.73 |
| 13:41 | 62.41 | 26.21 | 42.95 | 3.3 |
| 15:29 | 50.37 | 24.29 | 41.49 | 2.33 |
| 18:02 | 29.67 | 18.97 | 25.18 | 1.09 |
| 22:55 | 22.93 | 14.07 | 18.99 | 1.22 |
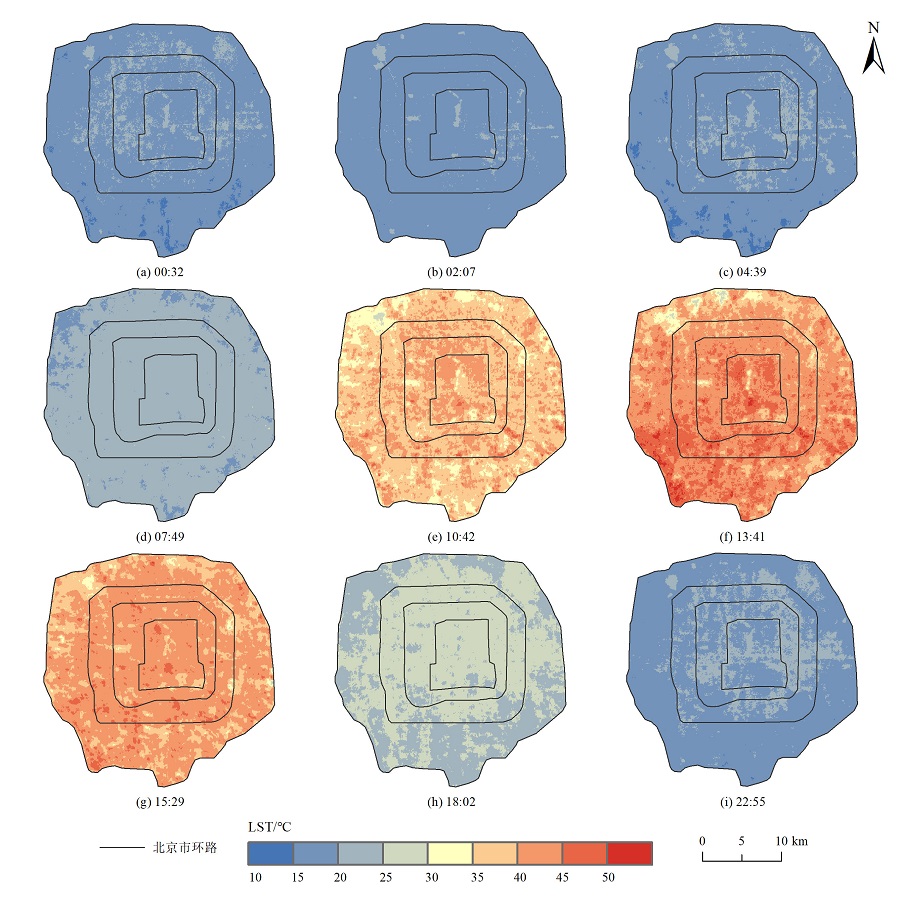
图2 不同时刻LST空间分布示意图
Figure 2 The spatial distribution diagram of LST at different times
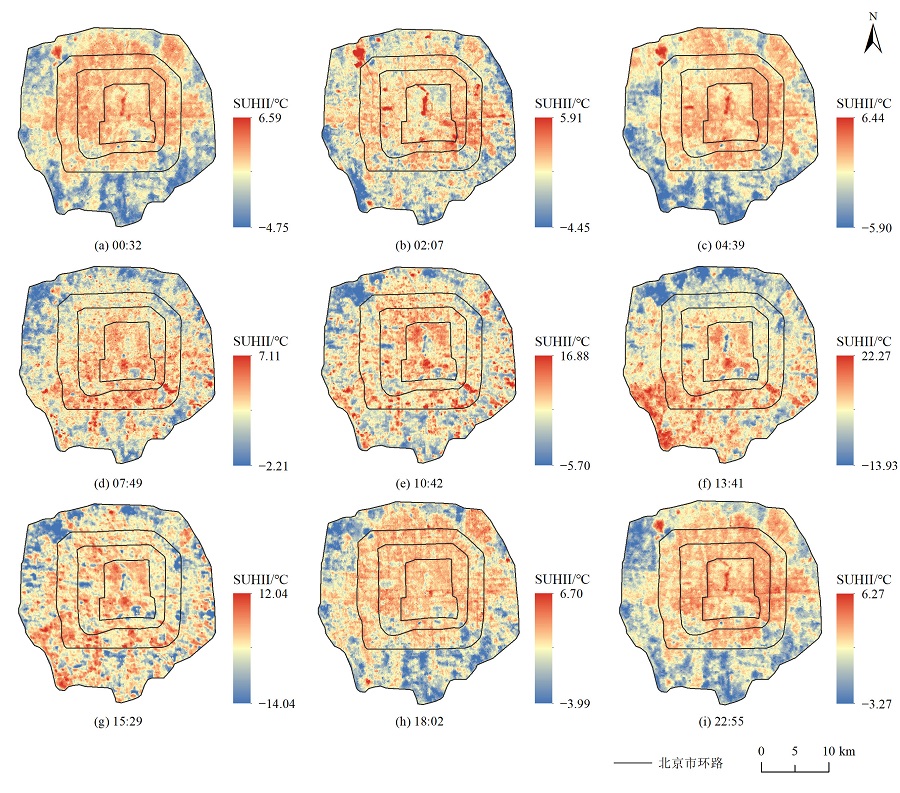
图3 不同时刻SUHII空间分布示意图
Figure 3 The spatial distribution diagram of SUHII at different times
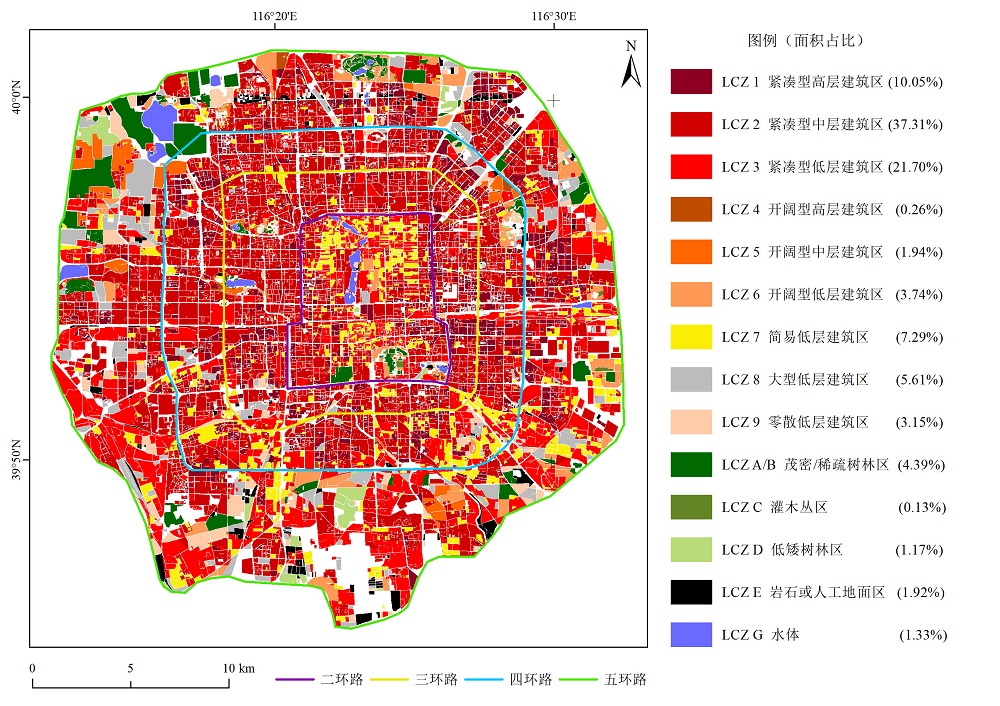
图4 LCZ空间分布示意图
Figure 4 Spatial distribution diagram of LCZ
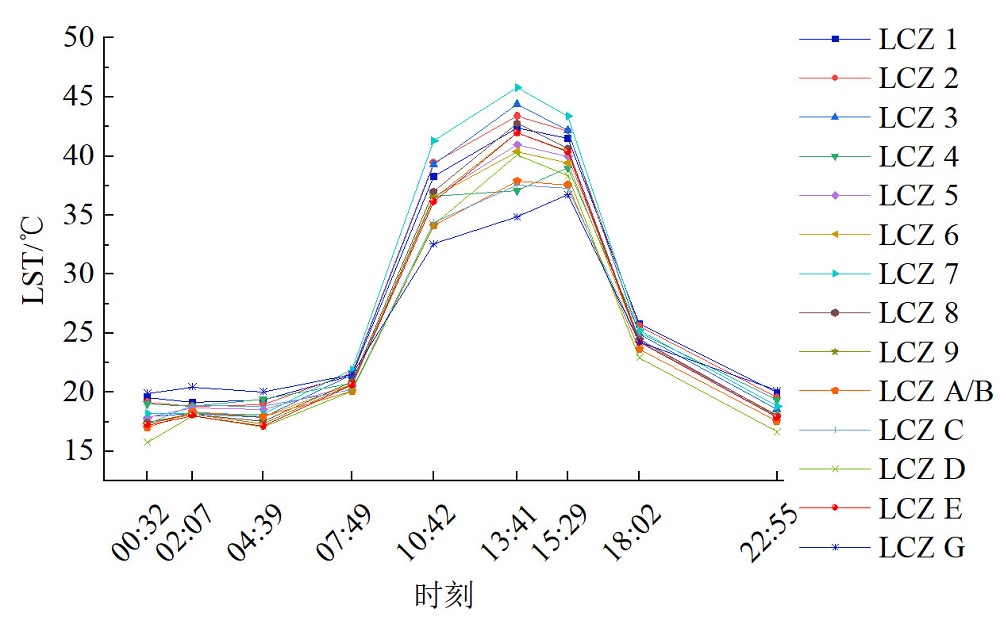
图5 不同LCZ类型的昼夜平均LST变化点线图
Figure 5 The diurnal average LST change point and line chart of different LCZ types
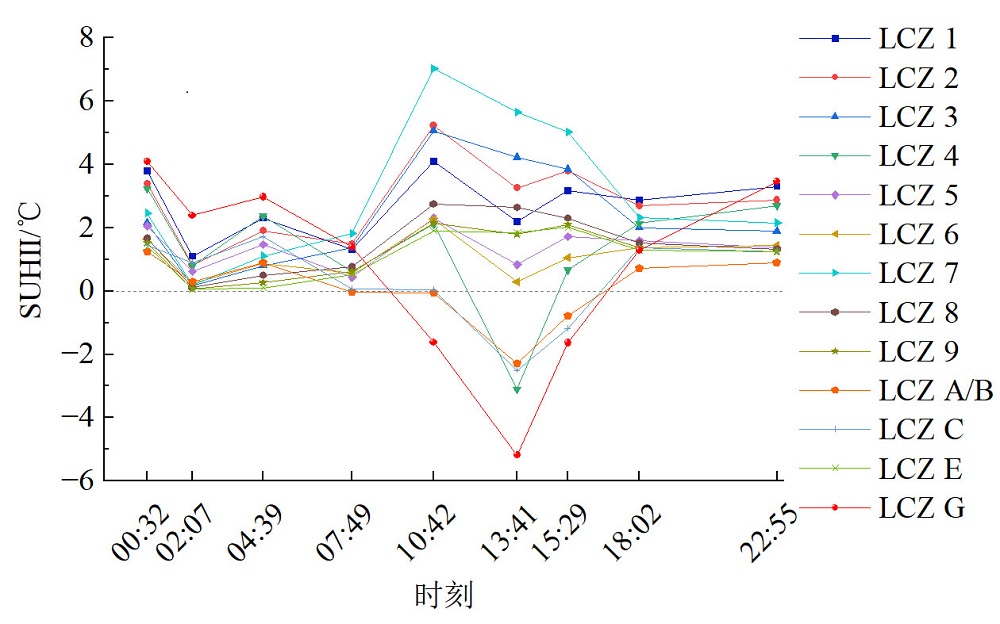
图6 不同LCZ类型的平均SUHII日变化点线图
Figure 6 The average SUHII diurnal variation point and line chart of different LCZ types
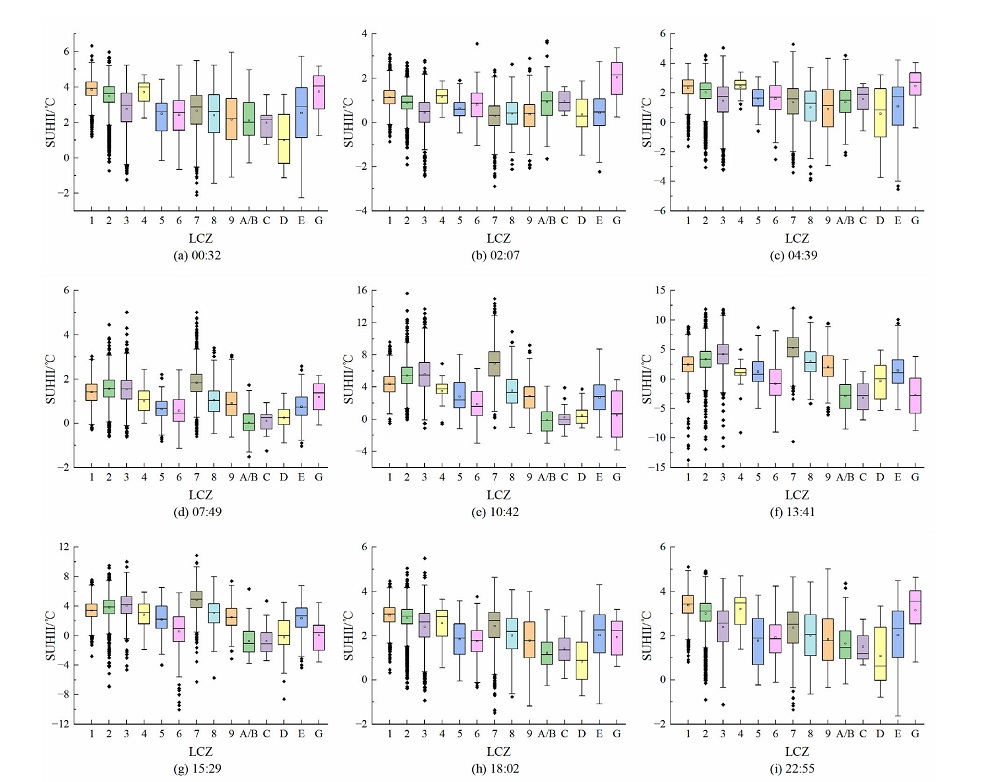
图7 不同LCZ类型在不同时刻的SUHII变化
Figure 7 SUHII changes of different LCZ types at different times
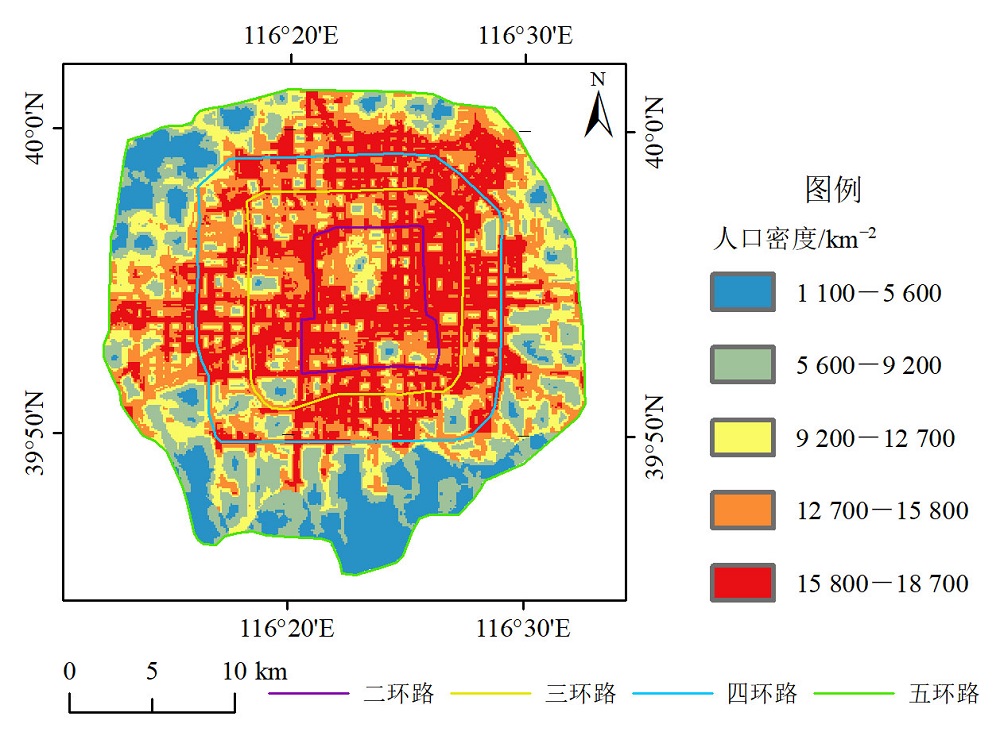
图8 基于World pop数据制作的人口密度空间分布
Figure 8 Spatial distribution map of population density based on World pop data
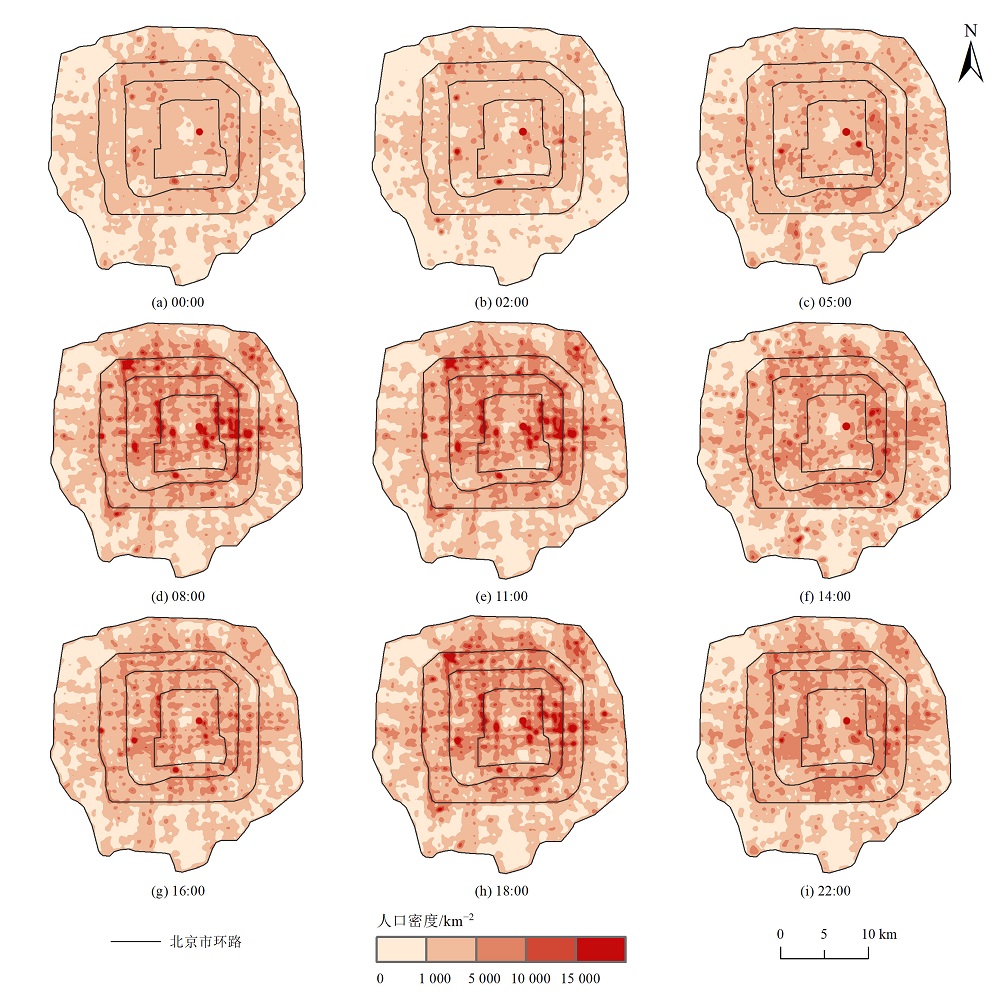
图9 不同时刻人口密度空间分布图
Figure 9 Spatial distribution of population density at different times
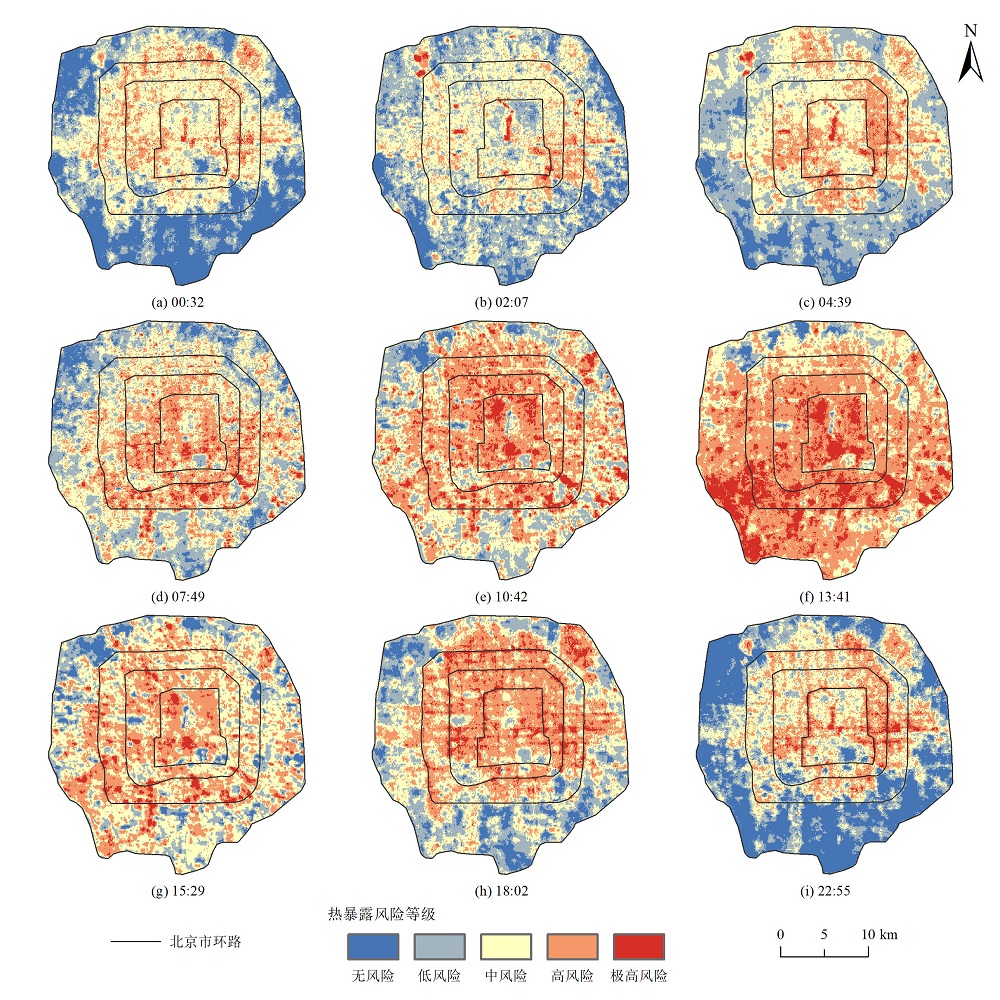
图10 相对人口热暴露强度变化示意图
Figure 10 Diurnal variation diagram of relative population heat exposure intensity
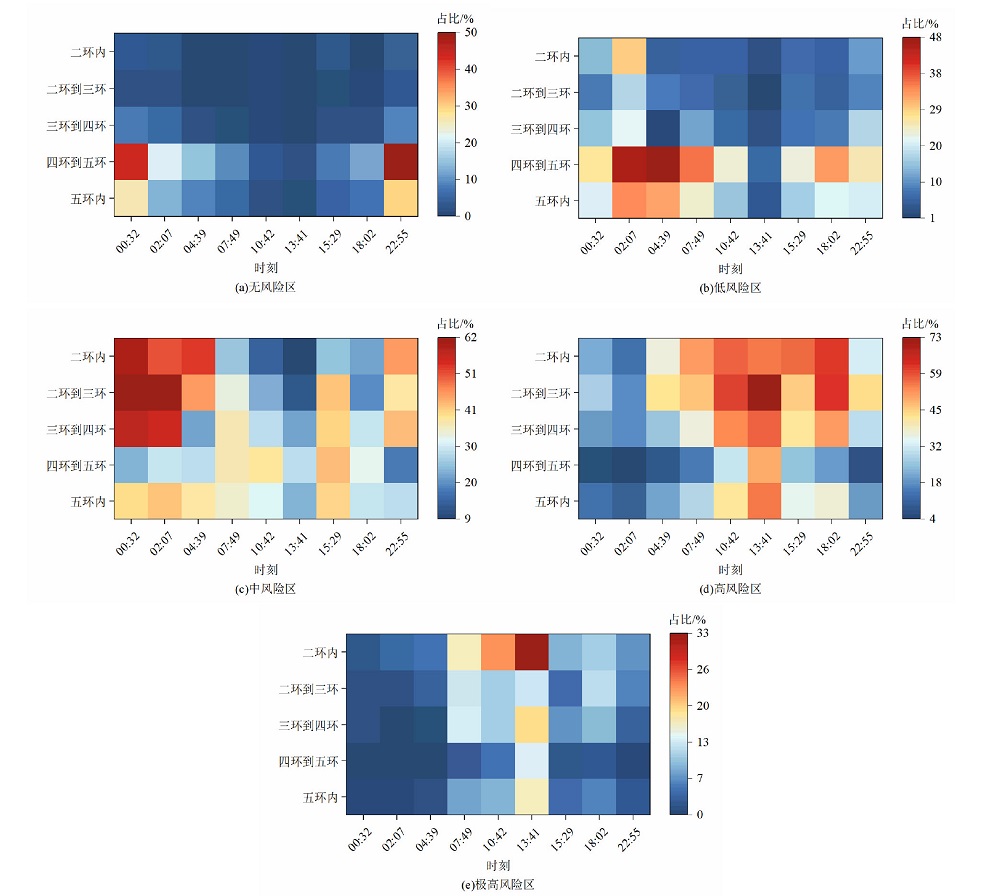
图11 不同等级的人口热暴露风险区在各环路内的面积占比
Figure 11 The area proportion of different population heat exposure risk areas in each loop
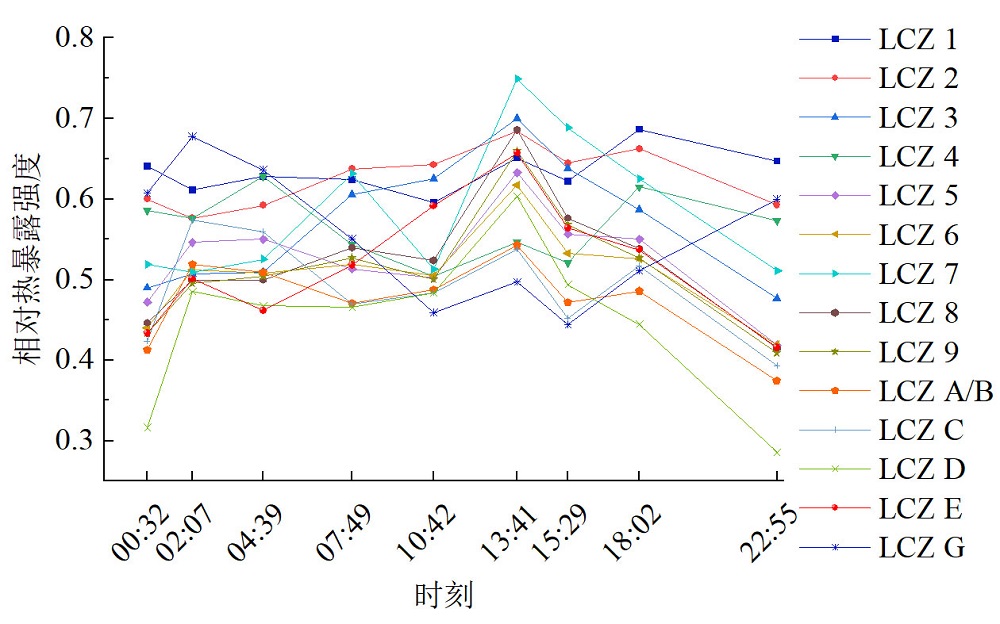
图12 不同LCZ类型的平均相对人口热暴露强度变化点线图
Figure 12 The average relative population heat exposure intensity change point and line chart of different LCZ types
| [1] | BECHTEL B, DEMUZERE M, MILLS G, et al., 2019. SUHI analysis using local climate zones: A comparison of 50 cities[J]. Urban Climate, 28: 100451. |
| [2] | CHANG Y, XIAO J F, LI X X, et al., 2021. Exploring diurnal thermal variations in urban local climate zones with ECOSTRESS land surface temperature data[J]. Remote Sensing of Environment, 263: 112544. |
| [3] | DEMUZERE M, KITTNER J, MARTILLI A, et al., 2022. A global map of local climate zones to support earth system modelling and urban-scale environmental science[J]. Earth System Science Data, 14(8): 3835-3873. |
| [4] | EISENMAN D P, WILHALME H, TSENG C, et al., 2016. Heat death associations with the built environment, social vulnerability and their interactions with rising temperature[J]. Health & Place, 41: 89-99. |
| [5] | HU L Q, WILHELMI O V, UEJIO C, 2019. Assessment of heat exposure in cities: Combining the dynamics of temperature and population[J]. Science of The Total Environment, 655: 1-12. |
| [6] | INGOLE V, SHERIDAN S C, JUVEKAR S, et al., 2022. Mortality risk attributable to high and low ambient temperature in Pune city, India: A time series analysis from 2004 to 2012[J]. Environmental Research, 204(Part C): 112304. |
| [7] | IPCC, 2012. Managing the risks of extreme events and disasters to advance climate change adaptation[R]. Cambridge: Cambridge University Press. |
| [8] | JONES B, O NEILL B C, MCDANIEL L, et al., 2015. Future population exposure to US heat extremes[J]. Nature Climate Change, 5(7): 652-655. |
| [9] | KALISA E, FADLALLAH S, AMANI M, et al., 2018. Temperature and air pollution relationship during heatwaves in Birmingham, UK[J]. Sustainable Cities and Society, 43: 111-120. |
| [10] | QUAN J L, 2019. Enhanced geographic information system-based mapping of local climate zones in Beijing, China[J]. Science China (Technological Sciences), 62(12): 2243-2260. |
| [11] | SIMON J H, KERRY C, JULIA B, et al., 2020. In-flight validation of the ECOSTRESS, Landsats 7 and 8 thermal infrared spectral channels using the Lake Tahoe CA/NV and Salton Sea CA automated validation sites[J]. IEEE Transactions on Geoscience and Remote Sensing, 58(2): 1294-1302. |
| [12] | SANTAMOURIS M, CARTALIS C, SYNNEFA A, et al., 2015. On the impact of urban heat island and global warming on the power demand and electricity consumption of buildings: A review[J]. Energy and Buildings, 98: 119-124. |
| [13] | STEWART I D, OKE T R, 2012. Local climate zones for urban temperature studies[J]. Bulletin of the American Meteorological Society, 93(12): 1879-1900. |
| [14] | TAYLOR J, WILKINSON P, DAVIES M, et al., 2015. Mapping the effects of urban heat island, housing, and age on excess heat-related mortality in London[J]. Urban Climate, 14(Part 4): 517-528. |
| [15] | YUAN B, ZHOU L, HU F N, et al., 2022. Diurnal dynamics of heat exposure in Xi’an: A perspective from local climate zone[J]. Building and Environment, 222: 109400. |
| [16] | ZHENG Y S, REN C, XU Y, et al., 2018. GIS-based mapping of local climate zone in the high-density city of Hong Kong[J]. Urban Climate, 24: 419-448. |
| [17] | 北京市统计局, 北京市第七次全国人口普查领导小组办公室, 2021. 北京市第七次全国人口普查公报 (第二号)[N]. 北京日报, 2021-5-20( 4). |
| Beijing Municipal Bureau of Statistics, Beijing Municipal Leading Group Office for the Seventh National Population Census, 2021. Bulletin of the seventh national population census of Beijing (No. 2)[N]. Beijing Daily, 2021-5-20( 4). | |
| [18] | 冯雷, 李旭东, 2016. 高温热浪对人类健康影响的研究进展[J]. 环境与健康杂志, 33(2): 182-188. |
| FENG L, LI X D, 2016. Effects of heat waves on human health: A review of recent study[J]. Journal of Environment and Health, 33(2): 182-188. | |
| [19] |
葛亚宁, 徐新良, 李静, 等, 2016. 北京城市建筑密度分布对热岛效应的影响研究[J]. 地球信息科学学报, 18(12): 1698-1706.
DOI |
| GE Y N, XU X L, LI J, et al., 2016. Study on the influence of urban building density on the heat island effect in Beijing[J]. Journal of Geo-information Science, 18(12): 1698-1706. | |
| [20] | 耿树丰, 任嘉义, 杨俊, 等, 2022. 局地气候区视角下的城市热环境研究[J]. 生态学报, 42(6): 2221-2227. |
| GENG S F, REN J Y, YANG J, et al., 2022. Exploration of urban thermal environment based on local climate zone[J]. Acta Ecologica Sinica, 42(6): 2221-2227. | |
| [21] | 郭城, 2023. 城市热环境昼夜变化的多尺度分析——以广州市中心城区为例[D]. 广州: 广州大学: 35-36. |
| GUO C, 2023. Multi-scale analysis of diurnal variation of urban thermal environment: A case study of central city of Guangzhou[D]. Guangzhou: Guangzhou University: 35-36. | |
| [22] | 黄群芳, 2023. 北京夏季高温变化特征及对城市热岛强度的影响[J]. 气象科技, 51(1): 66-74. |
| HUANG Q F, 2023. Characteristics and amplified effect of summer high temperature on urban heat islands in Beijing[J]. Meteorological Science and Technology, 51(1): 66-74. | |
| [23] | 黄晓军, 祁明月, 赵凯旭, 等, 2021. 高温影响下西安市人口脆弱性评估及其空间分异[J]. 地理研究, 40(6): 1684-1700. |
| HUANG X J, QI M Y, ZHAO K X, et al., 2021. Assessment of population vulnerability to heat stress and spatial differentiation in Xi’an[J]. Geographical Research, 40(6): 1684-1700. | |
| [24] | 蒋玉欣, 毛蒋兴, 2022. 南宁市老城区街道的空间活力及时空特征分析——基于百度热力图数据[J]. 北部湾大学学报, 37(4): 69-76. |
| JIANG Y X, MAO J X, 2022. Analysis of spatial vitality and spatial-temporal characteristics of streets in the old urban area of Nanning: Based on Baidu heat map data[J]. Journal of Beibu Gulf University, 37(4): 69-76. | |
| [25] |
金星星, 祁新华, 陆玉麒, 等, 2018. 福建省高温热浪风险评估与空间分异研究[J]. 地球信息科学学报, 20(12): 1820-1829.
DOI |
| JIN X X, QI X H, LU Y Q, et al., 2018. Evaluation and spatial differentiation of heat waves risk of Fujian Province[J]. Journal of Geo-information Science, 20(12): 1820-1829. | |
| [26] | 李媛媛, 2024. “城市-街区”不同尺度下建筑布局对城市热环境影响关系研究[D]. 北京: 北京建筑大学: 10-11. |
| LI Y Y, 2024. A study on the influence of building layout on urban thermal environment under different scales of “urban-street”[D]. Beijing: Beijing University of Civil Engineering and Architecture: 10-11. | |
| [27] |
林中立, 徐涵秋, 2017. 基于LCZ的城市热岛强度研究[J]. 地球信息科学学报, 19(5): 713-722.
DOI |
| LIN Z L, XU H Q, 2017. A study of urban heat island intensity based on “local climate zones”[J]. Journal of Geo-information Science, 19(5): 713-722. | |
| [28] | 马永欢, 鹿琳琳, 肖达, 等, 2022. 基于局地气候分区的城市热环境分析——以北京市为例[J]. 北京师范大学学报(自然科学版), 58(6): 901-909. |
| MA Y H, LU L L, XIAO D, et al., 2022. Urban thermal environment analysis by local climate zone in Beijing[J]. Journal of Beijing Normal University (Natural Science), 58(6): 901-909. | |
| [29] |
单宝艳, 张巧, 任启新, 等, 2022. 基于局地气候分区的济南市热环境空间分异及其影响因素[J]. 地球信息科学学报, 24(4): 711-722.
DOI |
| SHAN B Y, ZHANG Q, REN Q X, et al., 2022. Spatial differentiation of urban thermal environment and its influencing factors based on local climate zones in Jinan[J]. Journal of Geo-information Science, 24(4): 711-722. | |
| [30] | 吴锦成, 朱烨, 刘懿, 等, 2022. 中国热浪时空变化特征分析[J]. 水文, 42(3): 72-77. |
| WU J C, ZHU Y, LIU Y, et al., 2022. Spatio-temporal characteristics of heat waves in China[J]. Journal of China Hydrology, 42(3): 72-77. | |
| [31] |
杨梅焕, 姚明昊, 王涛, 等, 2023. 基于局地气候区的西安市城市热环境变化及其影响因素分析[J]. 生态环境学报, 32(9): 1644-1653.
DOI |
| YANG M H, YAO M H, WANG T, et al., 2023. Analysis of urban thermal environment change and its influencing factors in Xi’an based on local climate zone[J]. Ecology and Environmental Sciences, 32(9): 1644-1653. | |
| [32] |
张伟伟, 贾若愚, 田明, 等, 2024. 利用ECOSTRESS探究LCZ类间和类内城市热环境日动态变化[J]. 地球信息科学学报, 26(3): 679-692.
DOI |
| ZHANG W W, JIA R Y, TIAN M, et al., 2024. Exploring diurnal dynamic variations of inter- and intra-LCZ urban thermal environment with ECOSTRESS[J]. Journal of Geo-information Science, 26(3): 679-692. |
| [1] | 郑箐舟, 何军, 李深智, 邓承之, 吴志鹏, 黄萧霖, 吴瑕. 重庆地区城郊人体舒适度变化特征差异及其影响因素分析[J]. 生态环境学报, 2023, 32(6): 1089-1097. |
| 阅读次数 | ||||||
|
全文 |
|
|||||
|
摘要 |
|
|||||