生态环境学报 ›› 2025, Vol. 34 ›› Issue (11): 1749-1759.DOI: 10.16258/j.cnki.1674-5906.2025.11.008
杨雨灵1,2,3( ), 赵娜1,2,3, 吴明1,2,4, 焦亚音1,2,3, 赵玉广1,2,3
收稿日期:2025-04-09
出版日期:2025-11-18
发布日期:2025-11-05
作者简介:杨雨灵(1989年生),女,工程师,研究方向为大气污染数值模拟。E-mail: 469877954@qq.com
基金资助:
YANG Yuling1,2,3(), ZHAO Na1,2,3, WU Ming1,2,4, JIAO Yayin1,2,3, ZHAO Yuguang1,2,3
Received:2025-04-09
Online:2025-11-18
Published:2025-11-05
摘要:
生物源挥发性有机化合物(BVOCs)的排放对区域大气环境质量、生态系统功能和气候变化具有显著影响。为探究河北省BVOCs排放特征,基于WRF中尺度气象模型获取精细化气象数据,结合ArcGIS软件处理MODIS卫星的MCD12Q1和MCD15A2数据,提取植被功能类型(PFT)和叶面积指数(LAI),构建了空间分辨率为3 km的河北省生物源排放清单。 结果表明,2023年河北省BVOCs总排放量为537.6×10³ t,其中异戊二烯占比24.6%(132.5×10³ t),单萜烯占比25.2%(135.6×10³ t)。空间分布呈现明显的地形依赖性:太行山和燕山山脉排放强度最高,河北东南部次之,张家口最低。排放量前三位的城市依次为承德(148.9×10³ t)、保定(68.0×10³ t)和张家口(58.6×10³ t)。月际时间序列显示,河北省11地市及雄安新区均呈现单峰型排放特征,峰值集中在7、8月。其中,张家口、承德、秦皇岛、唐山在7月达排放极值,沧州、雄安新区、衡水、邢台则在8月达到峰值。该研究通过多源数据融合与模型模拟,揭示了河北省BVOCs排放的时空特征,为区域大气污染防治及生态环境管理提供了重要科学依据。
中图分类号:
杨雨灵, 赵娜, 吴明, 焦亚音, 赵玉广. 河北省BVOCs排放清单建立及排放特征分析[J]. 生态环境学报, 2025, 34(11): 1749-1759.
YANG Yuling, ZHAO Na, WU Ming, JIAO Yayin, ZHAO Yuguang. Analysis of the Biogenic Volatile Organic Compounds (BVOCs) Emission Inventory and Emission Characteristics in Hebei Province[J]. Ecology and Environmental Sciences, 2025, 34(11): 1749-1759.
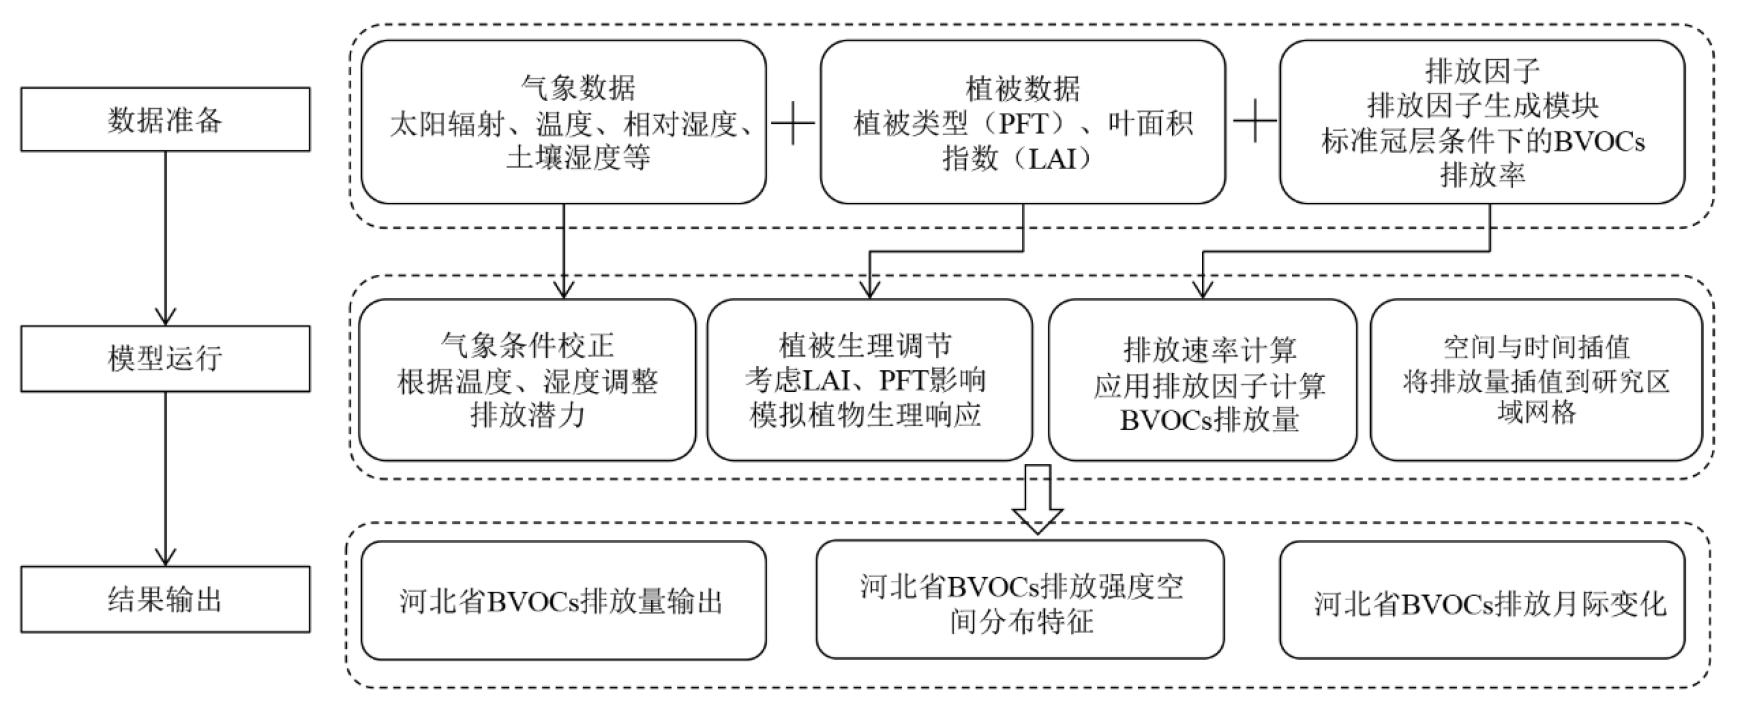
图1 技术路线图
Figure 1 Technical roadmap
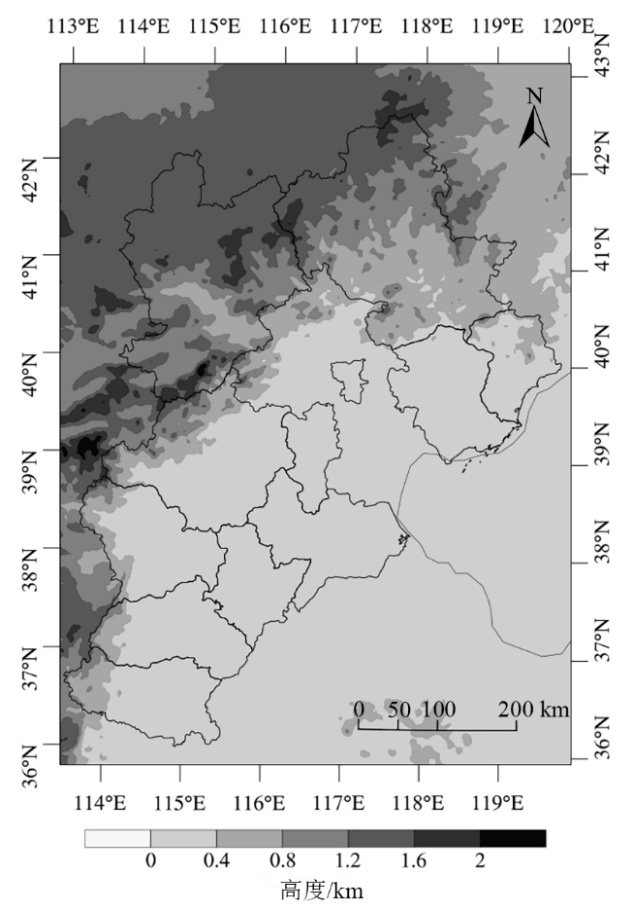
图2 WRF模型最内层模拟区域
Figure 2 Domain 03 of the WRF

图3 2023年河北省植被分布
Figure 3 Vegetation distribution in Hebei Province, 2023

图4 2023年1-12月河北省LAI分布图
Figure 4 Distribution of leaf area index (LAI) in Hebei Province from January to December, 2023
| MEGAN3.2化学物种大类 | 数量 | MEGAN2.1化学物种大类 | 数量 |
|---|---|---|---|
| 异戊二烯 | 1 | 异戊二烯 | 1 |
| 232-MBO | 1 | 232-MBO | 1 |
| 单萜-蒎烯型 | 2 | 月桂烯 | 1 |
| 单萜-罗勒烯型 | 4 | 桧烯 | 1 |
| 单萜-蒈烯型 | 6 | 柠檬烯 | 1 |
| 单萜-柠檬烯型 | 9 | 3-蒈烯 | 1 |
| C10芳烃:如对-异丙基苯 | 4 | 反式-β-罗勒烯 | 1 |
| 倍半萜:石竹烯型 | 25 | α-蒎烯 | 1 |
| 倍半萜:长叶烯型 | 14 | β-蒎烯 | 1 |
| C2-C4烃类 | 9 | 其他单萜 | 34 |
| C8-C13含氧类 | 24 | β-石竹烯 | 1 |
| 氧化产物 | 6 | α-金合欢烯 | 1 |
| 有机酸:如甲酸 | 3 | 其他倍半萜 | 30 |
| 甲醇 | 1 | 甲醇 | 1 |
| 丙酮 | 1 | 丙酮 | 1 |
| 一氧化碳 | 1 | 一氧化碳 | 1 |
| 无机氮 | 3 | 无机氮 | 3 |
| 胁迫挥发性有机化合物 | 54 | 胁迫挥发性有机化合物 | 15 |
| 其他挥发性有机化合物 | 30 | 其他挥发性有机化合物 | 49 |
| 乙醇和乙醛 | 2 | C1-C2含氧挥发性有机化合物 | 5 |
| 合计 | 200 | 合计 | 150 |
表1 MEGAN v3.2与MEGAN v2.1包含的化学物种差异
Table1 Difference of chemical species between MEGAN v3.2 and MEGAN v2.1
| MEGAN3.2化学物种大类 | 数量 | MEGAN2.1化学物种大类 | 数量 |
|---|---|---|---|
| 异戊二烯 | 1 | 异戊二烯 | 1 |
| 232-MBO | 1 | 232-MBO | 1 |
| 单萜-蒎烯型 | 2 | 月桂烯 | 1 |
| 单萜-罗勒烯型 | 4 | 桧烯 | 1 |
| 单萜-蒈烯型 | 6 | 柠檬烯 | 1 |
| 单萜-柠檬烯型 | 9 | 3-蒈烯 | 1 |
| C10芳烃:如对-异丙基苯 | 4 | 反式-β-罗勒烯 | 1 |
| 倍半萜:石竹烯型 | 25 | α-蒎烯 | 1 |
| 倍半萜:长叶烯型 | 14 | β-蒎烯 | 1 |
| C2-C4烃类 | 9 | 其他单萜 | 34 |
| C8-C13含氧类 | 24 | β-石竹烯 | 1 |
| 氧化产物 | 6 | α-金合欢烯 | 1 |
| 有机酸:如甲酸 | 3 | 其他倍半萜 | 30 |
| 甲醇 | 1 | 甲醇 | 1 |
| 丙酮 | 1 | 丙酮 | 1 |
| 一氧化碳 | 1 | 一氧化碳 | 1 |
| 无机氮 | 3 | 无机氮 | 3 |
| 胁迫挥发性有机化合物 | 54 | 胁迫挥发性有机化合物 | 15 |
| 其他挥发性有机化合物 | 30 | 其他挥发性有机化合物 | 49 |
| 乙醇和乙醛 | 2 | C1-C2含氧挥发性有机化合物 | 5 |
| 合计 | 200 | 合计 | 150 |
| 植被类型 | 排放因子/(μg·g−1·h−1) | ||||
|---|---|---|---|---|---|
| 异戊二烯 | 单萜烯 | 甲醇 | 丙酮 | 一氧化碳 | |
| 温带常绿针叶树 | 0.8 | 1.89 | 0.4 | 1.2 | 0.1 |
| 北方常绿针叶树 | 4 | 1.69 | 0.4 | 1.2 | 0.1 |
| 北方落叶针叶树 | 0.003 | 1.59 | 0.4 | 1.2 | 0.1 |
| 热带常绿阔叶树 | 10 | 1.07 | 0.4 | 1.2 | 0.1 |
| 温带常绿阔叶树 | 12 | 1.07 | 0.4 | 1.2 | 0.1 |
| 热带落叶阔叶树 | 8 | 1.07 | 0.4 | 1.2 | 0.1 |
| 温带落叶阔叶树 | 12 | 1.07 | 0.4 | 1.2 | 0.1 |
| 北方落叶阔叶树 | 14 | 1.07 | 0.4 | 1.2 | 0.1 |
| 温带常绿阔叶灌木 | 4 | 1.19 | 0.4 | 1.2 | 0.1 |
| 温带落叶阔叶灌木 | 6 | 1.19 | 0.4 | 1.2 | 0.1 |
| 北方落叶阔叶灌木 | 8 | 1.19 | 0.4 | 1.2 | 0.1 |
| 北极C3草 | 2 | 0.74 | 0.1 | 1.0 | 0.1 |
| 冷季型C3草 | 1 | 0.74 | 0.1 | 1.0 | 0.1 |
| 暖季型C4草 | 0.3 | 0.85 | 0.1 | 1.0 | 0.1 |
| 农作物 | 0.05 | 0.78 | 0.1 | 1.0 | 0.1 |
表2 常见植被类型的标准排放因子
Table 2 Standard emission factors of common vegetation types
| 植被类型 | 排放因子/(μg·g−1·h−1) | ||||
|---|---|---|---|---|---|
| 异戊二烯 | 单萜烯 | 甲醇 | 丙酮 | 一氧化碳 | |
| 温带常绿针叶树 | 0.8 | 1.89 | 0.4 | 1.2 | 0.1 |
| 北方常绿针叶树 | 4 | 1.69 | 0.4 | 1.2 | 0.1 |
| 北方落叶针叶树 | 0.003 | 1.59 | 0.4 | 1.2 | 0.1 |
| 热带常绿阔叶树 | 10 | 1.07 | 0.4 | 1.2 | 0.1 |
| 温带常绿阔叶树 | 12 | 1.07 | 0.4 | 1.2 | 0.1 |
| 热带落叶阔叶树 | 8 | 1.07 | 0.4 | 1.2 | 0.1 |
| 温带落叶阔叶树 | 12 | 1.07 | 0.4 | 1.2 | 0.1 |
| 北方落叶阔叶树 | 14 | 1.07 | 0.4 | 1.2 | 0.1 |
| 温带常绿阔叶灌木 | 4 | 1.19 | 0.4 | 1.2 | 0.1 |
| 温带落叶阔叶灌木 | 6 | 1.19 | 0.4 | 1.2 | 0.1 |
| 北方落叶阔叶灌木 | 8 | 1.19 | 0.4 | 1.2 | 0.1 |
| 北极C3草 | 2 | 0.74 | 0.1 | 1.0 | 0.1 |
| 冷季型C3草 | 1 | 0.74 | 0.1 | 1.0 | 0.1 |
| 暖季型C4草 | 0.3 | 0.85 | 0.1 | 1.0 | 0.1 |
| 农作物 | 0.05 | 0.78 | 0.1 | 1.0 | 0.1 |
| 研究区域 | 研究时段 | 河北BVOCs排放量/(103 t) | 研究方法 | 参考文献 |
|---|---|---|---|---|
| 京津冀 | 2017年 | 350.4 | MEGAN v2.1 | 夏春林等, |
| 京津冀 | 2018年 | 637.1 | 蓄积量产量换算、遥感解译数据、MEGAN v2.1 | 李奥哲等, |
| 京津冀 | 2000-2020年 | 591.1 | 遥感解译数据 | 亓浩雲等, |
| 全国 | 未知 | 471.1 | 蓄积量产量换算 | Klinger et al.,2002 |
| 全国 | 1981-2003年 | 587.3 | MEGAN v2.1 | Li et al.,2014 |
| 全国 | 2006年 | 220.0 | MEGAN | Li et al.,2012 |
| 中国东部 | 2008-2010年 | 315.2 | MEGAN v2.04 | 宋媛媛等, |
| 全国 | 2013年 | 848.0 | MEGAN v2.1 | Li et al.,2016 |
| 全国 | 2020年 | 155.6 | MEGAN v3.2 | 白广坤等, |
| 河北省 | 2023年 | 537.6 | MEGAN v3.2 | 本研究 |
表3 不同研究中河北省BVOCs排放量对比
Table 3 Comparison of BVOCs emissions in Hebei Province in different studies
| 研究区域 | 研究时段 | 河北BVOCs排放量/(103 t) | 研究方法 | 参考文献 |
|---|---|---|---|---|
| 京津冀 | 2017年 | 350.4 | MEGAN v2.1 | 夏春林等, |
| 京津冀 | 2018年 | 637.1 | 蓄积量产量换算、遥感解译数据、MEGAN v2.1 | 李奥哲等, |
| 京津冀 | 2000-2020年 | 591.1 | 遥感解译数据 | 亓浩雲等, |
| 全国 | 未知 | 471.1 | 蓄积量产量换算 | Klinger et al.,2002 |
| 全国 | 1981-2003年 | 587.3 | MEGAN v2.1 | Li et al.,2014 |
| 全国 | 2006年 | 220.0 | MEGAN | Li et al.,2012 |
| 中国东部 | 2008-2010年 | 315.2 | MEGAN v2.04 | 宋媛媛等, |
| 全国 | 2013年 | 848.0 | MEGAN v2.1 | Li et al.,2016 |
| 全国 | 2020年 | 155.6 | MEGAN v3.2 | 白广坤等, |
| 河北省 | 2023年 | 537.6 | MEGAN v3.2 | 本研究 |

图5 2023年京津冀地区BVOCs(a)、异戊二烯(b)、单萜烯(c)排放强度空间分布
Figure 5 Spatial distribution of BVOCs (a), isoprene (b), and monoterpene (c) emission intensity in the Jing-Jin-Ji region in 2023
| 物种 | 城市 | |||||||||||
|---|---|---|---|---|---|---|---|---|---|---|---|---|
| 张家口 | 承德 | 秦皇岛 | 唐山 | 廊坊 | 沧州 | 雄安新区 | 保定 | 石家庄 | 衡水 | 邢台 | 邯郸 | |
| BVOCs | 58.6 | 148.9 | 32.1 | 40.4 | 15.2 | 30.5 | 4.6 | 68.0 | 48.1 | 22.8 | 36.6 | 31.7 |
| 异戊二烯 | 13.0 | 53.9 | 9.8 | 8.8 | 1.2 | 2.5 | 0.4 | 17.3 | 12.0 | 1.7 | 6.2 | 5.6 |
| 单萜烯 | 14.6 | 38.2 | 8.3 | 10.2 | 3.5 | 7.1 | 1.1 | 17.5 | 12.4 | 5.4 | 9.3 | 8.0 |
表4 2023年全省11地市及雄安新区BVOCs、异戊二烯、单萜烯的排放量
Table 4 BVOCs, isoprene, and monoterpene emissions in 11 cities of the Hebei province and Xiong’an New Area in 2023 103 t
| 物种 | 城市 | |||||||||||
|---|---|---|---|---|---|---|---|---|---|---|---|---|
| 张家口 | 承德 | 秦皇岛 | 唐山 | 廊坊 | 沧州 | 雄安新区 | 保定 | 石家庄 | 衡水 | 邢台 | 邯郸 | |
| BVOCs | 58.6 | 148.9 | 32.1 | 40.4 | 15.2 | 30.5 | 4.6 | 68.0 | 48.1 | 22.8 | 36.6 | 31.7 |
| 异戊二烯 | 13.0 | 53.9 | 9.8 | 8.8 | 1.2 | 2.5 | 0.4 | 17.3 | 12.0 | 1.7 | 6.2 | 5.6 |
| 单萜烯 | 14.6 | 38.2 | 8.3 | 10.2 | 3.5 | 7.1 | 1.1 | 17.5 | 12.4 | 5.4 | 9.3 | 8.0 |
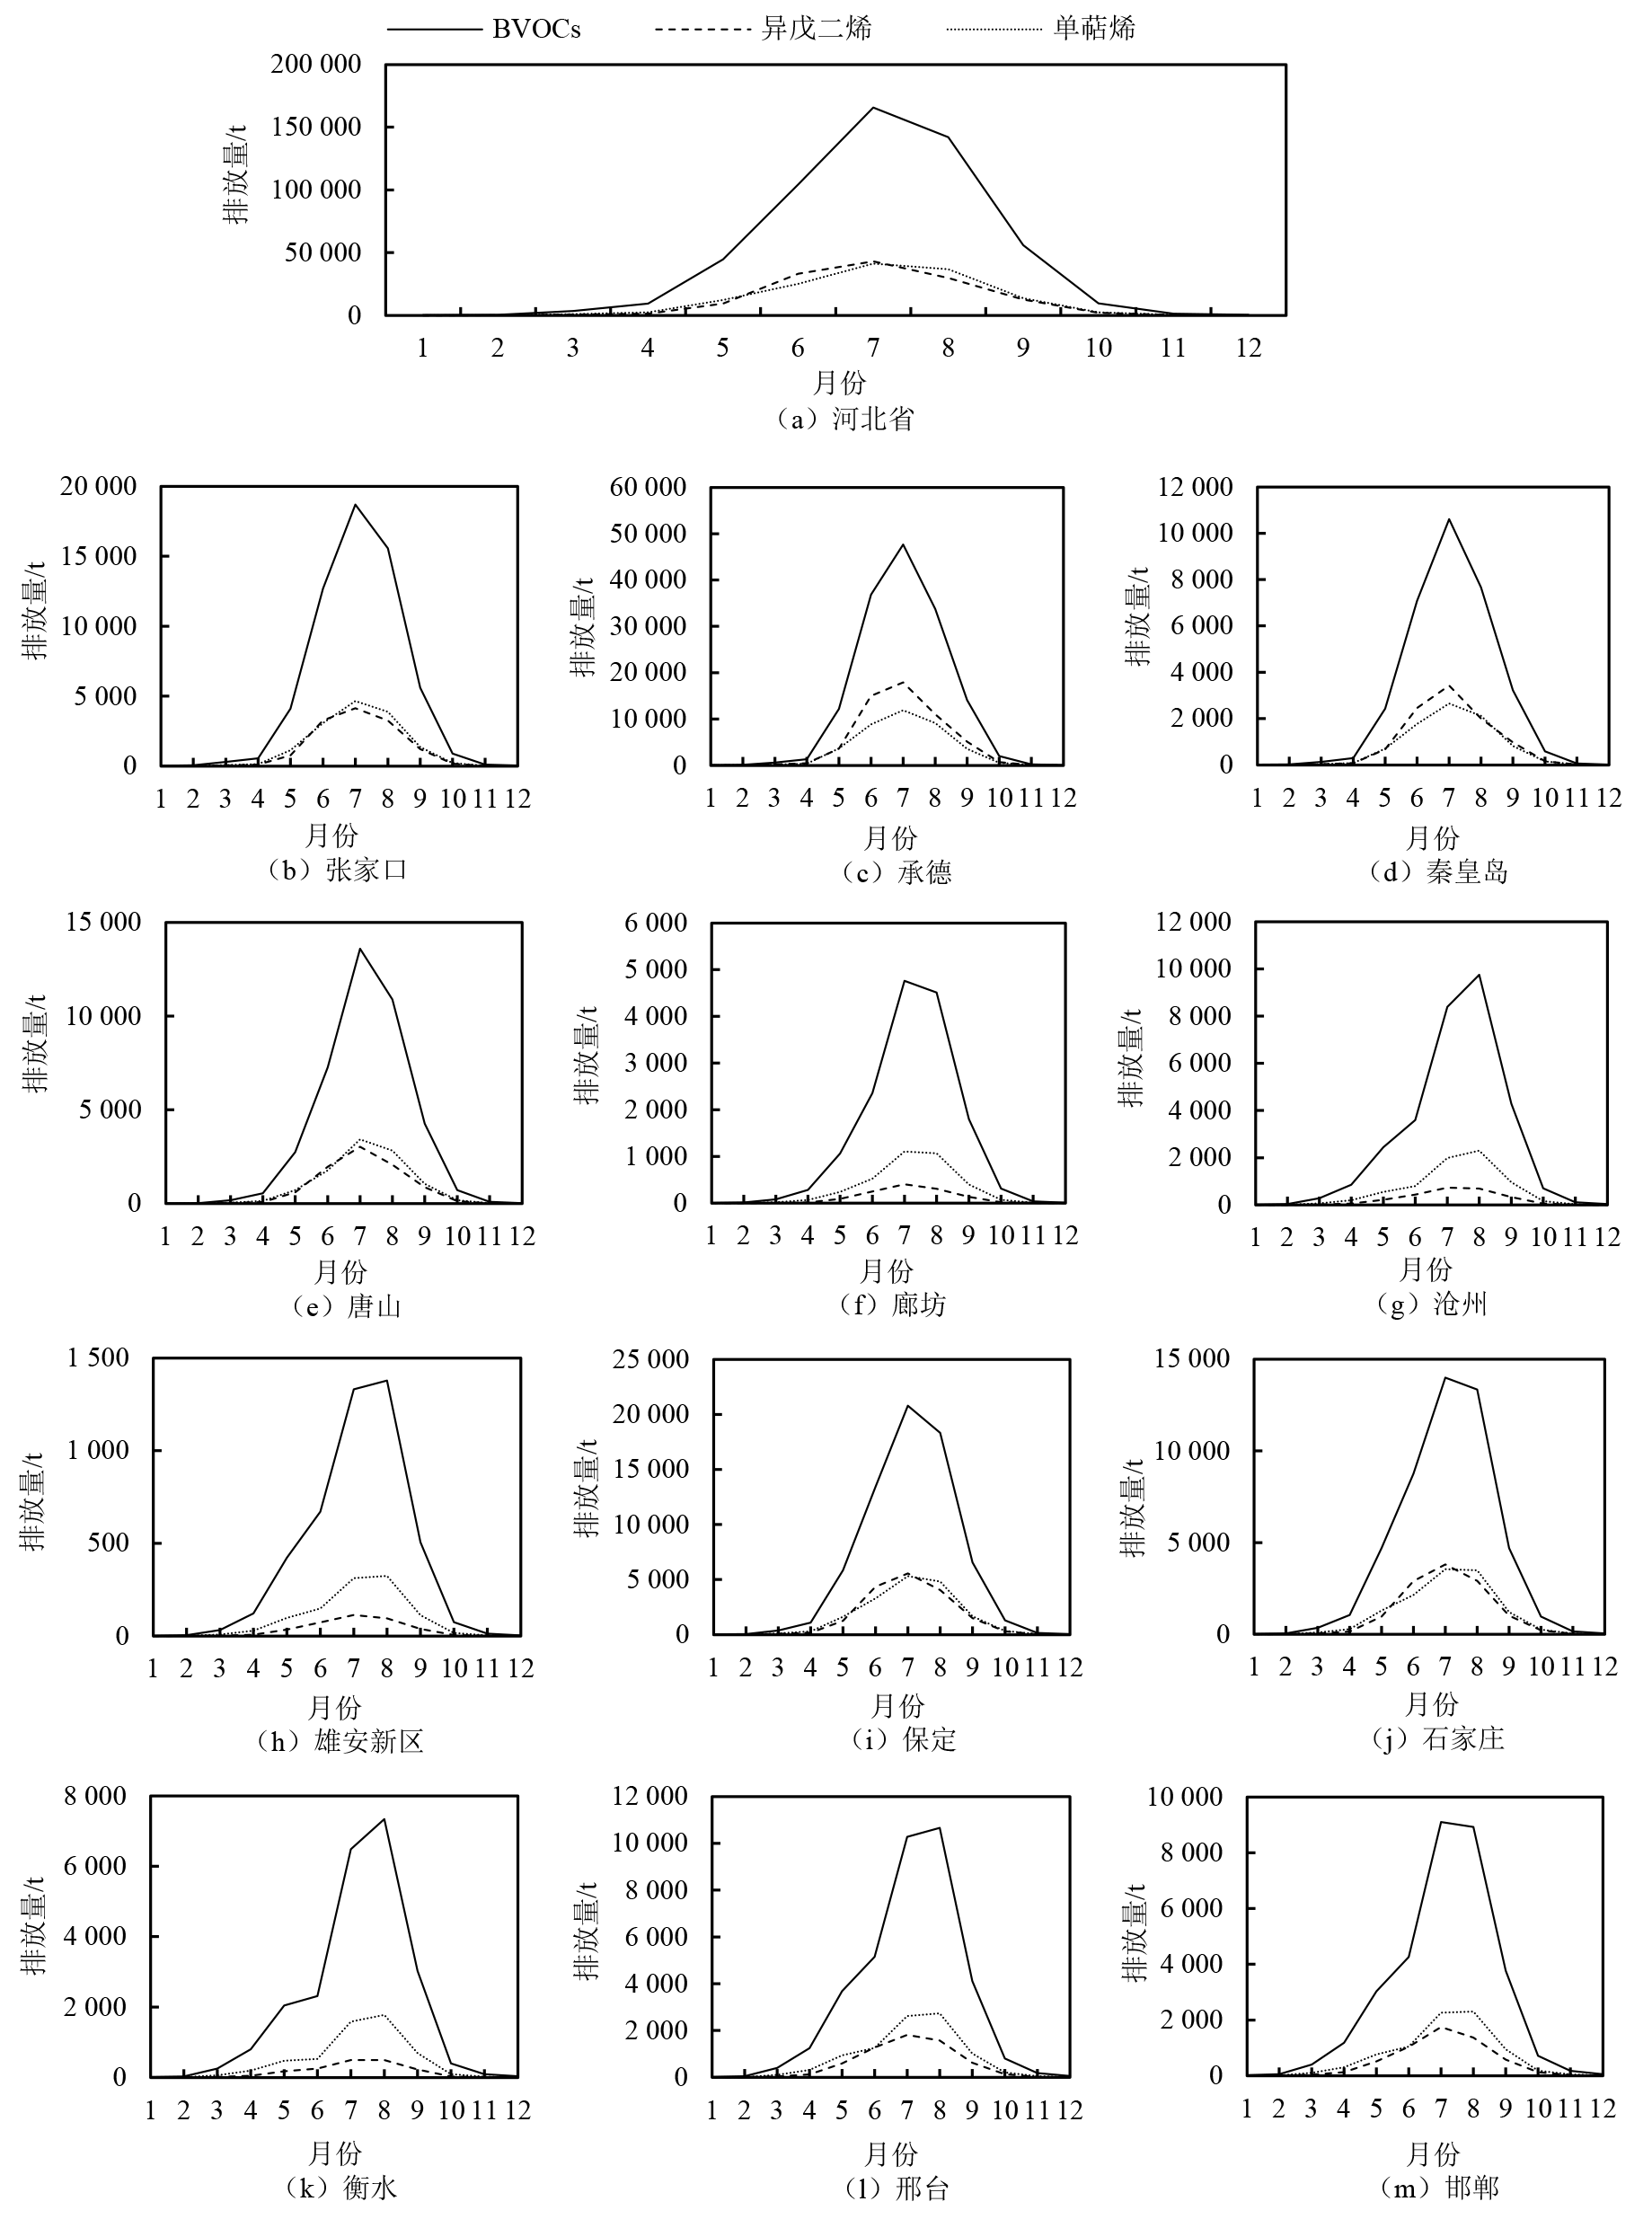
图6 河北省、11地市及雄安新区BVOCs、异戊二烯、单萜烯排放量逐月变化
Figure 6 Monthly emission of BVOCs, isoprene, and monoterpene in Hebei Province, 11 cities and Xiong’an New Area
| [1] | ARNETH A, SCHURGERS G, LATHIÈRE J, et al., 2011. Global terrestrial isoprene emission models: Sensitivity to variability in climate and vegetation[J]. Atmospheric Chemistry and Physics, 11(15): 8037-8052. |
| [2] |
ATKINSON R, AREY J, 1998. Atmospheric chemistry of biogenic organic compounds[J]. Accounts of Chemical Research, 31(9): 574-583.
DOI URL |
| [3] | Clean Air Asia, 2018. Breakthroughs: China’s path to clean air 2013-2017[R]. 2018-2-3 http://allaboutair.cn/uploads/soft/181114/Breakthroughs_ChinasPathtoCleanAir2013-2017.pdf. |
| [4] | FINLAYSON-PITTS B J, PITTS J N, 2000. Chemistry of the Upper and Lower Atmosphere:Theory, Experiments, and Applications[M]. San Diego: Academic Press: 1-868. |
| [5] |
GUENTHER A, HEWITT N, ERICKSON D, et al., 1995. A global model of natural volatile organic compound emissions[J]. Journal of Geophysical Research, 100(D5): 8873-8892.
DOI URL |
| [6] | GUENTHER A, KARL T, HARLEY P, et al., 2012. Estimates of global terrestrial isoprene emissions using MEGAN (Model of Emissions of Gases and Aerosols from Nature)[J]. Atmospheric Chemistry and Physics, 12(24): 1181-1210. |
| [7] | GUENTHER A, SHAH T, HUANG L, et al., 2017. A Next Generation Modeling System for Estimating Texas Biogenic VOC Emissions[R]. AQRP Project 16-011, Final report. Texas: Texas University. |
| [8] |
KESSELMEIER J, STAUDT M, 1999. Biogenic volatile organic compounds (VOC): An overview on emission, physiology and ecology[J]. Journal of Atmospheric Chemistry, 33: 23-88.
DOI |
| [9] | KLINGER L F, LI Q J, GUENTHER A B, et al., 2002. Assessment of volatile organic compound emissions form ecosystems of China[J]. Geophysical Research, 107(D21): 1-21. |
| [10] | LI J, LI L Y, WU R R, et al., 2016. Inventory of highly resolved temporal and spatial volatile organic compounds emission in China[C]// Proceedings of the 24th International Conference on Modelling, Monitoring and Management of Air Pollution. Greece: 79-86. |
| [11] |
LI L Y, XIE S D, 2014. Historical variations of biogenic volatile organic compound emission inventories in China, 1981-2003[J]. Atmospheric Environment, 95: 185-196.
DOI URL |
| [12] | LI M, HUANG X, LI J, et al., 2012. Estimation of biogenic volatile organic compound (BVOC) emissions from the terrestrial ecosystem in China using real-time remote sensing data[J]. Atmospheric Chemistry and Physics, 12: 6551-6592. |
| [13] | LIU Y, CIURARU R, ABIS L, et al., 2024. Emissions of biogenic volatile organic compounds from agricultural lands and the impact of land-use and other management practices: A review[EB/OL]. EGUsphere, 1-35 [2025-05-13]. https://doi.org/10.5194/egusphere-2024-530, 2024. |
| [14] | WANG H, WU Q Z, GUENTER A, et al., 2021. A long-term estimation of biogenic volatile organic compound (BVOC) emission in China from 2001-2016: The roles of land cover change and climate variability[J]. Atmospheric Chemistry & Physics, 21(6): 4825-4848. |
| [15] | WANG H, LIU X H, WU C L, et al., 2024. Regional to global distributions, trends, and drivers of biogenic volatile organic compound emission from 2001 to 2020[J]. Atmospheric Chemistry & Physics, 24(5): 3309-3328. |
| [16] |
WANG P F, GUO H, HU J L, et al., 2019. Responses of PM2.5 and O3 concentrations to changes of meteorology and emissions in China[J]. Science of The Total Environment, 662: 297-306.
DOI URL |
| [17] |
WANG R P, WANG X Q, CHENG S Y, et al., 2022. Emission characteristics and reactivity of volatile organic compounds from typical high-energy-consuming industries in North China[J]. Science of the Total Environment, 809: 151134.
DOI URL |
| [18] |
WU K, YANG X Y, CHEN D A, et al., 2020. Estimation of biogenic VOC emissions and their corresponding impact on ozone and secondary organic aerosol formation in China[J]. Atmospheric Research, 231: 104656.
DOI URL |
| [19] | 白广坤, 孔范龙, 李志才, 等, 2025. 中国天然源挥发性有机物排放特征及对大气二次污染物生成的影响[J/OL]. 生态学杂志, 1-10 [2025-05-13]. |
| BAI G K, KONG F L, LI Z C, et al., 2025. Characteristic of biogenic volatile organic compound (BVOC) emissions and their impacts on the formation of atmospheric secondary pollutants in China[J/OL]. Chinese Journal of Ecology, 1-10 [2025-05-13]. | |
| [20] |
陈奇乐, 谢梦姣, 李瑾璞, 等, 2020. 河北省植被NDVI变化及其对气象要素的响应[J]. 林业与生态科学, 35(1): 17-24.
DOI |
| CHEN Q L, XIE M J, LI J P, et al., 2020. Changes of vegetation NDVI and its response to meteorological elements in Hebei province[J]. Forestry and Ecological Sciences, 35(1): 17-24. | |
| [21] | 丁斌, 苑荣,主编, 2022. 中国农业年鉴[M]. 北京: 中国农业出版社:36. |
| DING B, YUAN R (Eds.), 2022. China Agricultural Yearbook[M]. Beijing: China Agricultural Press:36. | |
| [22] | 董赵鑫, 丁点, 姜越琪, 等, 2023. PM2.5和臭氧对前体物减排和气象变化的响应及其政策启示[J]. 环境科学研究, 36(2): 223-236. |
| DONG Z X, DING D, JIANG Y Q, et al., 2023. Responses of PM2.5 and ozone to precursors reduction and meteorological changes and its policy implications[J]. Research of Environmental Sciences, 36(2): 223-236. | |
| [23] | 高超, 张学磊, 修艾军, 等, 2019. 中国生物源挥发性有机物 (BVOCs) 时空排放特征研究[J]. 环境科学学报, 39(12): 4140-4151. |
| GAO C, ZHANG X L, XIU A J, et al., 2019. Spatiotemporal distribution of biogenic volatile organic compounds emissions in China[J]. Acta Scientiae Circumstantiae, 39(12): 4140-4151. | |
| [24] | 黄国锋, 沈劲, 陈多宏, 等, 2025. 广东省天然源VOCs排放特征及臭氧污染影响[J]. 环境科学学报, 45(4): 322-330. |
| HUANG G F, SHEN J, CHEN D H, et al., 2025. Biogenic VOCs emission characteristics and its impact on ozone pollution in Guangdong Province[J]. Acta Scientiae Circumstantiae, 45(4): 322-330. | |
| [25] | 李奥哲, 段文娇, 亓浩雲, 等, 2023. 基于多模型和多源数据的京津冀地区BVOCs排放清单[J]. 中国环境科学, 43(10): 5052-5061. |
| LI A Z, DUAN W J, QI H Y, et al., 2023. Emission inventory of BVOCs in Beijing-Tianjin-Hebei region based on multiple models and multiple source data[J]. China Environmental Science, 43(10): 5052-5061. | |
| [26] | 刘岩, 李莉, 安静宇, 等, 2018. 长江三角洲2014年天然源BVOCs排放、组成及时空分布[J]. 环境科学, 39(2): 608-617. |
| LIU Y, LI L, AN J Y, et al., 2018. Emissions, chemical composition, and spatial and temporal allocation of the BVOCs in the Yangtze River Delta Region in 2014[J]. Environmental Science, 39(2): 608-617. | |
| [27] | 亓浩雲, 王晓琦, 程水源, 等, 2022. 2000-2020年京津冀BVOCs排放量估算及时空分布特征[J]. 中国环境科学, 42(4): 1501-1509. |
| QI H Y, WANG X Q, CHENG S Y, et al., 2022. Estimation of BVOCs emissions and its temporal and spatial distribution characteristics in Beijing-Tianjin-Hebei Region from 2000 to 2020[J]. China Environmental Science, 42(4): 1501-1509. | |
| [28] |
桑宇星, 刘刚, 江聪, 等, 2020. 近30 a中国叶面积指数变化趋势的不确定性评估[J]. 遥感技术与应用, 35(5): 1028-1036.
DOI |
| SANG Y X, LIU G, JIANG C, et al., 2020. Uncertainty assessment of the trend of China’s leaf areaindex in the past 30 years[J]. Remote Sensing Technology and Application, 35(5): 1028-1036. | |
| [29] | 生态环境部, 2019. 中国空气质量改善报告 (2013-2018年)[R]. http://www.gov.cn/xinwen/2019-06/06/content_5397950.htm, 2019-1-5. |
| Ministry of Ecology and Environment, 2019. Report on the Improvement of Air Quality in China (2013-2018)[R]. http://www.gov.cn/xinwen/2019-06/06/content_5397950.htm, 2019-1-5. | |
| [30] | 宋媛媛, 张艳燕, 王勤耕, 等, 2012. 基于遥感资料的中国东部地区植被VOCs排放强度研究[J]. 环境科学学报, 32(9): 2216-2227. |
| SONG Y Y, ZHANG Y Y, WANG Q G, et al., 2012. Estimation of biogenic VOCs emissions in eastern China based on remote sensing data[J]. Acta Scientiae Circumstantiae, 32(9): 2216-2227. | |
| [31] | 谭峥铮, 卢召艳, 石广明, 等, 2021. 湖南省天然源挥发性有机物排放时空特征研究[J]. 环境科学学报, 41(5): 1774-1783. |
| TAN Z Z, LU Z Y, SHI G M, et al., 2021. The characteristics of biogenic volatile organic compounds emissions of Hunan province[J]. Acta Scientiae Circumstantiae, 41(5): 1774-1783. | |
| [32] | 夏春林, 肖琳, 2019. 京津冀天然源挥发性有机物排放研究[J]. 环境科学学报, 39(8): 2680-2689. |
| XIA C L, XIAO L, 2019. Study on the emission of natural volatile organic compounds in Beijing-Tianjin-Hebei Region[J]. Acta Scientiae Circumstantiae, 39(8): 2680-2689. | |
| [33] | 张桂芹, 樊联欢, 韩立钊, 等, 2024. 济南市典型区夏季VOCs分布特征及臭氧生成机制[J]. 环境化学, 43(1): 297-310. |
| ZHANG G Q, FAN L H, HAN L Z, et al., 2024. Distribution characteristics of VOCs and ozone formation mechanism in a typical area of Ji’nan city in summer[J]. Environmental Chemistry, 43(1): 297-310. | |
| [34] | 张明明, 邵旻, 陈培林, 等, 2023. 长三角地区VOCs排放特征及其对大气O3和SOA的潜在影响[J]. 中国环境科学, 43(6): 2694-2702. |
| ZHANG M M, SHAO M, CHEN P L, et al., 2023. Emission characteristics of VOCs in the Yangtze River Delta Region and its potential impacts on atmospheric O3 and SOA[J]. China Environmental Science, 43(6): 2694-2702. | |
| [35] | 郑君瑜, 郑卓云, 王兆礼, 等, 2009. 珠江三角洲天然源VOCs排放量估算及时空分布特征[J]. 中国环境科学, 29(4): 345-350. |
| ZHENG J Y, ZHENG Z Y, WANG Z L, et al., 2009. Biogenic VOCs emission inventory and its temporal and spatial characteristics in the Pearl River Delta area[J]. China Environmental Science, 29(4): 345-350. |
| [1] | 祁珣, 冯鑫鑫, 陈颖军, 冯艳丽, 陈田, 李军, 张干. 轻型汽油卡车尾气颗粒物中氨和有机胺的排放特征及影响因素[J]. 生态环境学报, 2025, 34(7): 997-1006. |
| [2] | 赵忠宝, 李婧, 刘小丹, 柏祥, 刘昊野, 徐晓娜, 耿世刚, 鲁少波. 河北省森林生态产品价值评估及其空间分布驱动因素研究[J]. 生态环境学报, 2025, 34(2): 321-332. |
| [3] | 万五星, 张帅, 李洁, 孙旭, 管祖光, 于小红, 杨永宏, 王效科. 河北省城市空气臭氧污染及其对植物伤害的区域差异[J]. 生态环境学报, 2021, 30(11): 2185-2194. |
| 阅读次数 | ||||||
|
全文 |
|
|||||
|
摘要 |
|
|||||