生态环境学报 ›› 2025, Vol. 34 ›› Issue (3): 345-357.DOI: 10.16258/j.cnki.1674-5906.2025.03.002
宋双双1( ), 秦世姣2, 孙彭成3, 付兴涛1,*()
收稿日期:2024-09-10
出版日期:2025-03-18
发布日期:2025-03-24
通讯作者:
*付兴涛。E-mail: fuxingtao@tyut.edu.cn作者简介:宋双双(2001年生),女,硕士研究生,主要研究方向为水土保持与土壤侵蚀。E-mail: 2280226646@qq.com
基金资助:
SONG Shuangshuang1(), QIN Shijiao2, Sun Pengcheng3, FU Xingtao1,*()
Received:2024-09-10
Online:2025-03-18
Published:2025-03-24
摘要:
净生态系统生产力(Net Ecosystem Productivity,NEP)是定量评估陆地生态系统碳汇功能的重要指标。为了探究汾河流域植被碳汇量的时空分布规律并预测未来30年汾河流域植被碳汇量。基于数字高程模型(DEM)数据、归一化植被指数(NDVI)数据、土地利用数据和气象数据,运用改进的CASA模型定量估算了汾河流域1999-2023年的植被碳汇量,用灰色GM(1, 1)模型预测了2024-2053年汾河流域植被碳汇量。结果显示,1)植被年均NEP随时间呈明显上升趋势,年均增长率为8.05%,其中,秋季和夏季多年平均NEP较大,分别为C 45.33 g∙m−2∙a−1和44.23 g∙m−2∙a−1,而春季和冬季较小,分别为C 21.41 g∙m−2∙a−1和19.70 g∙m−2∙a−1。2)植被NEP在空间上整体分布特点为“中部低,两翼高”。植被碳汇量发生显著时空迁移,2006年高碳汇区南移至汾河流域南部,较2005年平均增长近C 100 g∙m−2∙a−1。2019-2023年高碳汇区同样向南迁移,较2018年增加C 46.05 g∙m−2∙a−1。3)未来30年汾河流域植被碳汇量将持续增长,年均增长率为2.68%。预计到2032年将达到C 200 g∙m−2∙a−1,2048年有望达到C 300 g∙m−2∙a−1。汾河流域目前及未来30年植被碳汇量总体呈上升趋势,研究结果为该区域生态环境保护、碳减排政策制定和可持续发展规划提供科学依据。
中图分类号:
宋双双, 秦世姣, 孙彭成, 付兴涛. 基于多源遥感数据的汾河流域植被碳汇量估算及预测[J]. 生态环境学报, 2025, 34(3): 345-357.
SONG Shuangshuang, QIN Shijiao, Sun Pengcheng, FU Xingtao. Estimation and Prediction of Vegetation Carbon Sinks in Fenhe River Basin Based on Multi-source Remote Sensing Data[J]. Ecology and Environment, 2025, 34(3): 345-357.

图1 汾河流域概况 中国地图审图号:GS(2023)2763号,自然资源部监制。底图边界无修改
Figure 1 Overview of Fenhe River basin
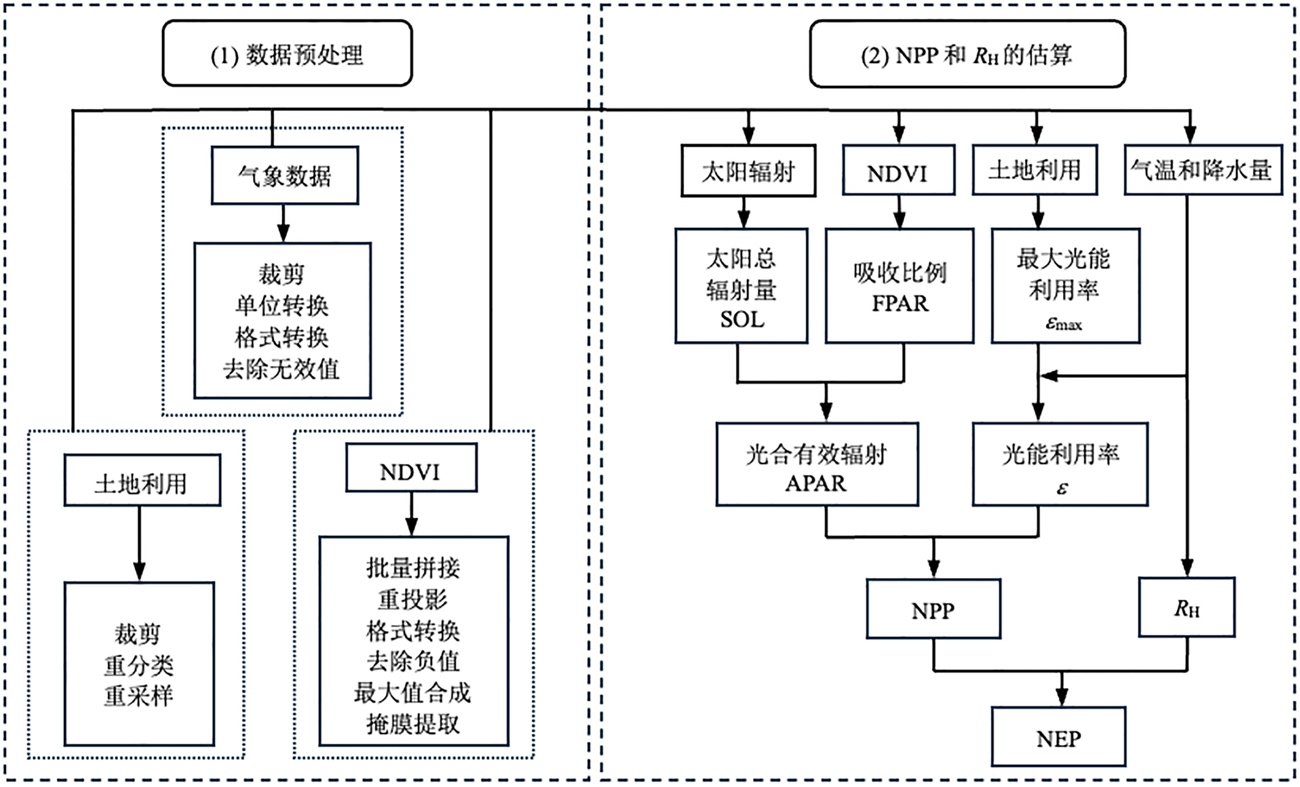
图2 NEP估算总体框架
Figure 2 General framework for NEP estimates
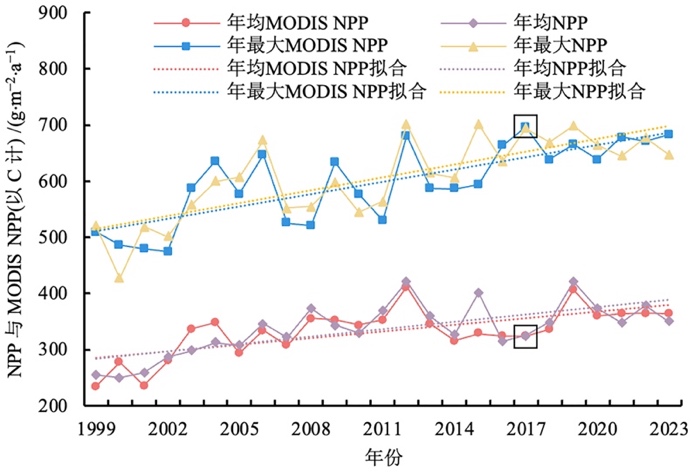
图3 1999-2023年汾河流域NPP与MODIS NPP年均值和年最大值的对比分析
Figure 3 Comparative analysis of annual mean and annual maximum of NPP and MODIS NPP in Fenhe River Basin, 1999?2023
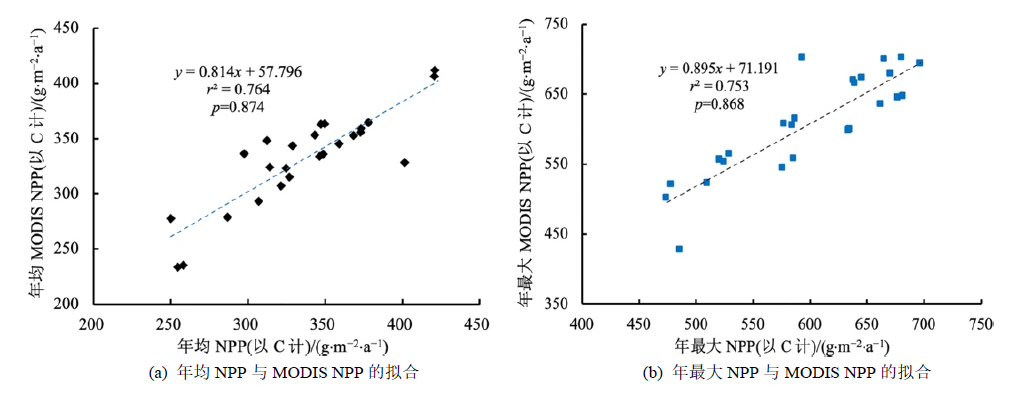
图4 CASA模型估算的植被年均和年最大NPP与MODIS NPP值的拟合
Figure 4 Fitting of annual mean and annual maximum NPP of vegetation estimated by CASA model to MODIS NPP values
| 年份 | 估算值X(0)(k) (以C计)/ (g·m−2·a−1) | 预测值 (g·m−2·a−1) | 残差q(k) (以C计)/ (g·m−2·a−1) | 相对残差e(k)/ % |
|---|---|---|---|---|
| 1999 | 62.27 | 62.27 | 0.00 | 0.00 |
| 2000 | 56.90 | 85.91 | 29.01 | 50.98 |
| 2001 | 73.81 | 88.21 | 14.40 | 19.51 |
| 2002 | 53.72 | 90.58 | 36.86 | 68.62 |
| 2003 | 72.00 | 93.00 | 21.01 | 29.18 |
| 2004 | 97.21 | 95.49 | 1.72 | 1.77 |
| 2005 | 88.37 | 98.05 | 9.68 | 10.96 |
| 2006 | 147.85 | 100.67 | 47.18 | 31.91 |
| 2007 | 94.41 | 103.37 | 8.96 | 9.49 |
| 2008 | 133.40 | 106.14 | 27.26 | 20.43 |
| 2009 | 104.04 | 108.98 | 4.94 | 4.75 |
| 2010 | 137.80 | 111.90 | 25.90 | 18.80 |
| 2011 | 113.25 | 114.90 | 1.65 | 1.46 |
| 2012 | 165.93 | 117.97 | 47.96 | 28.90 |
| 2013 | 135.67 | 121.13 | 14.54 | 10.72 |
| 2014 | 136.96 | 124.38 | 12.58 | 9.18 |
| 2015 | 125.01 | 127.71 | 2.70 | 2.16 |
| 2016 | 96.62 | 131.13 | 34.51 | 35.72 |
| 2017 | 167.48 | 134.64 | 32.84 | 19.61 |
| 2018 | 99.72 | 138.25 | 38.53 | 38.64 |
| 2019 | 150.25 | 141.95 | 8.30 | 5.52 |
| 2020 | 141.88 | 145.75 | 3.87 | 2.73 |
| 2021 | 148.00 | 149.65 | 1.65 | 1.12 |
| 2022 | 149.26 | 153.66 | 4.40 | 2.95 |
| 2023 | 139.44 | 157.78 | 18.34 | 13.15 |
| 平均值 | 115.65 | 116.14 | 17.95 | 5.78 |
表1 1999-2023年汾河流域植被年均碳汇量的相对残差
Table 1 Relative residuals of annual average carbon sinks of vegetation in Fenhe River basin, 1999-2023
| 年份 | 估算值X(0)(k) (以C计)/ (g·m−2·a−1) | 预测值 (g·m−2·a−1) | 残差q(k) (以C计)/ (g·m−2·a−1) | 相对残差e(k)/ % |
|---|---|---|---|---|
| 1999 | 62.27 | 62.27 | 0.00 | 0.00 |
| 2000 | 56.90 | 85.91 | 29.01 | 50.98 |
| 2001 | 73.81 | 88.21 | 14.40 | 19.51 |
| 2002 | 53.72 | 90.58 | 36.86 | 68.62 |
| 2003 | 72.00 | 93.00 | 21.01 | 29.18 |
| 2004 | 97.21 | 95.49 | 1.72 | 1.77 |
| 2005 | 88.37 | 98.05 | 9.68 | 10.96 |
| 2006 | 147.85 | 100.67 | 47.18 | 31.91 |
| 2007 | 94.41 | 103.37 | 8.96 | 9.49 |
| 2008 | 133.40 | 106.14 | 27.26 | 20.43 |
| 2009 | 104.04 | 108.98 | 4.94 | 4.75 |
| 2010 | 137.80 | 111.90 | 25.90 | 18.80 |
| 2011 | 113.25 | 114.90 | 1.65 | 1.46 |
| 2012 | 165.93 | 117.97 | 47.96 | 28.90 |
| 2013 | 135.67 | 121.13 | 14.54 | 10.72 |
| 2014 | 136.96 | 124.38 | 12.58 | 9.18 |
| 2015 | 125.01 | 127.71 | 2.70 | 2.16 |
| 2016 | 96.62 | 131.13 | 34.51 | 35.72 |
| 2017 | 167.48 | 134.64 | 32.84 | 19.61 |
| 2018 | 99.72 | 138.25 | 38.53 | 38.64 |
| 2019 | 150.25 | 141.95 | 8.30 | 5.52 |
| 2020 | 141.88 | 145.75 | 3.87 | 2.73 |
| 2021 | 148.00 | 149.65 | 1.65 | 1.12 |
| 2022 | 149.26 | 153.66 | 4.40 | 2.95 |
| 2023 | 139.44 | 157.78 | 18.34 | 13.15 |
| 平均值 | 115.65 | 116.14 | 17.95 | 5.78 |
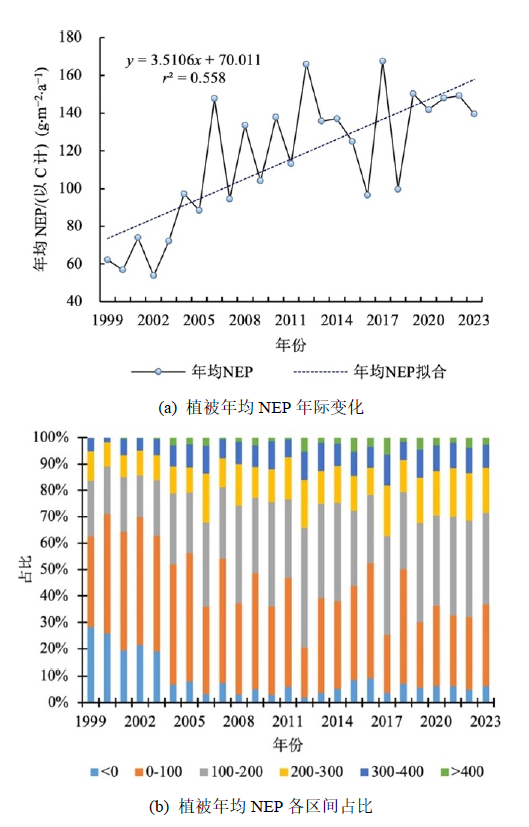
图5 1999-2023年汾河流域植被年均NEP年际变化及各部分占比
Figure 5 Interannual variation in mean annual NEP of vegetation in Fenhe River basin and the share of each component, 1999-2023
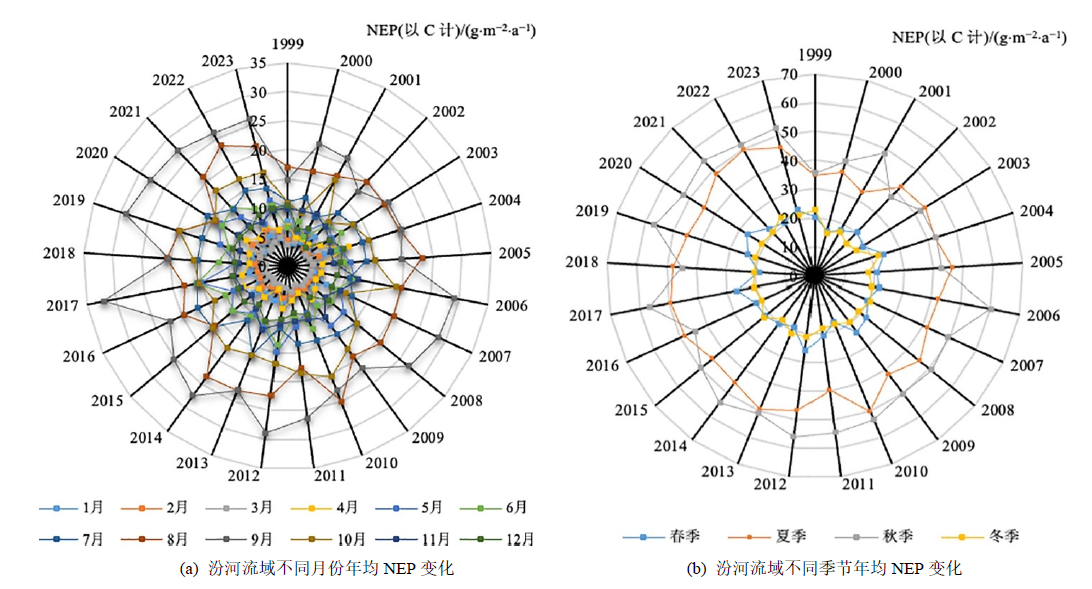
图6 1999-2023年汾河流域不同月份及季节NEP变化
Figure 6 Changes in NEP in different months and seasons in Fenhe River basin, 1999-2023
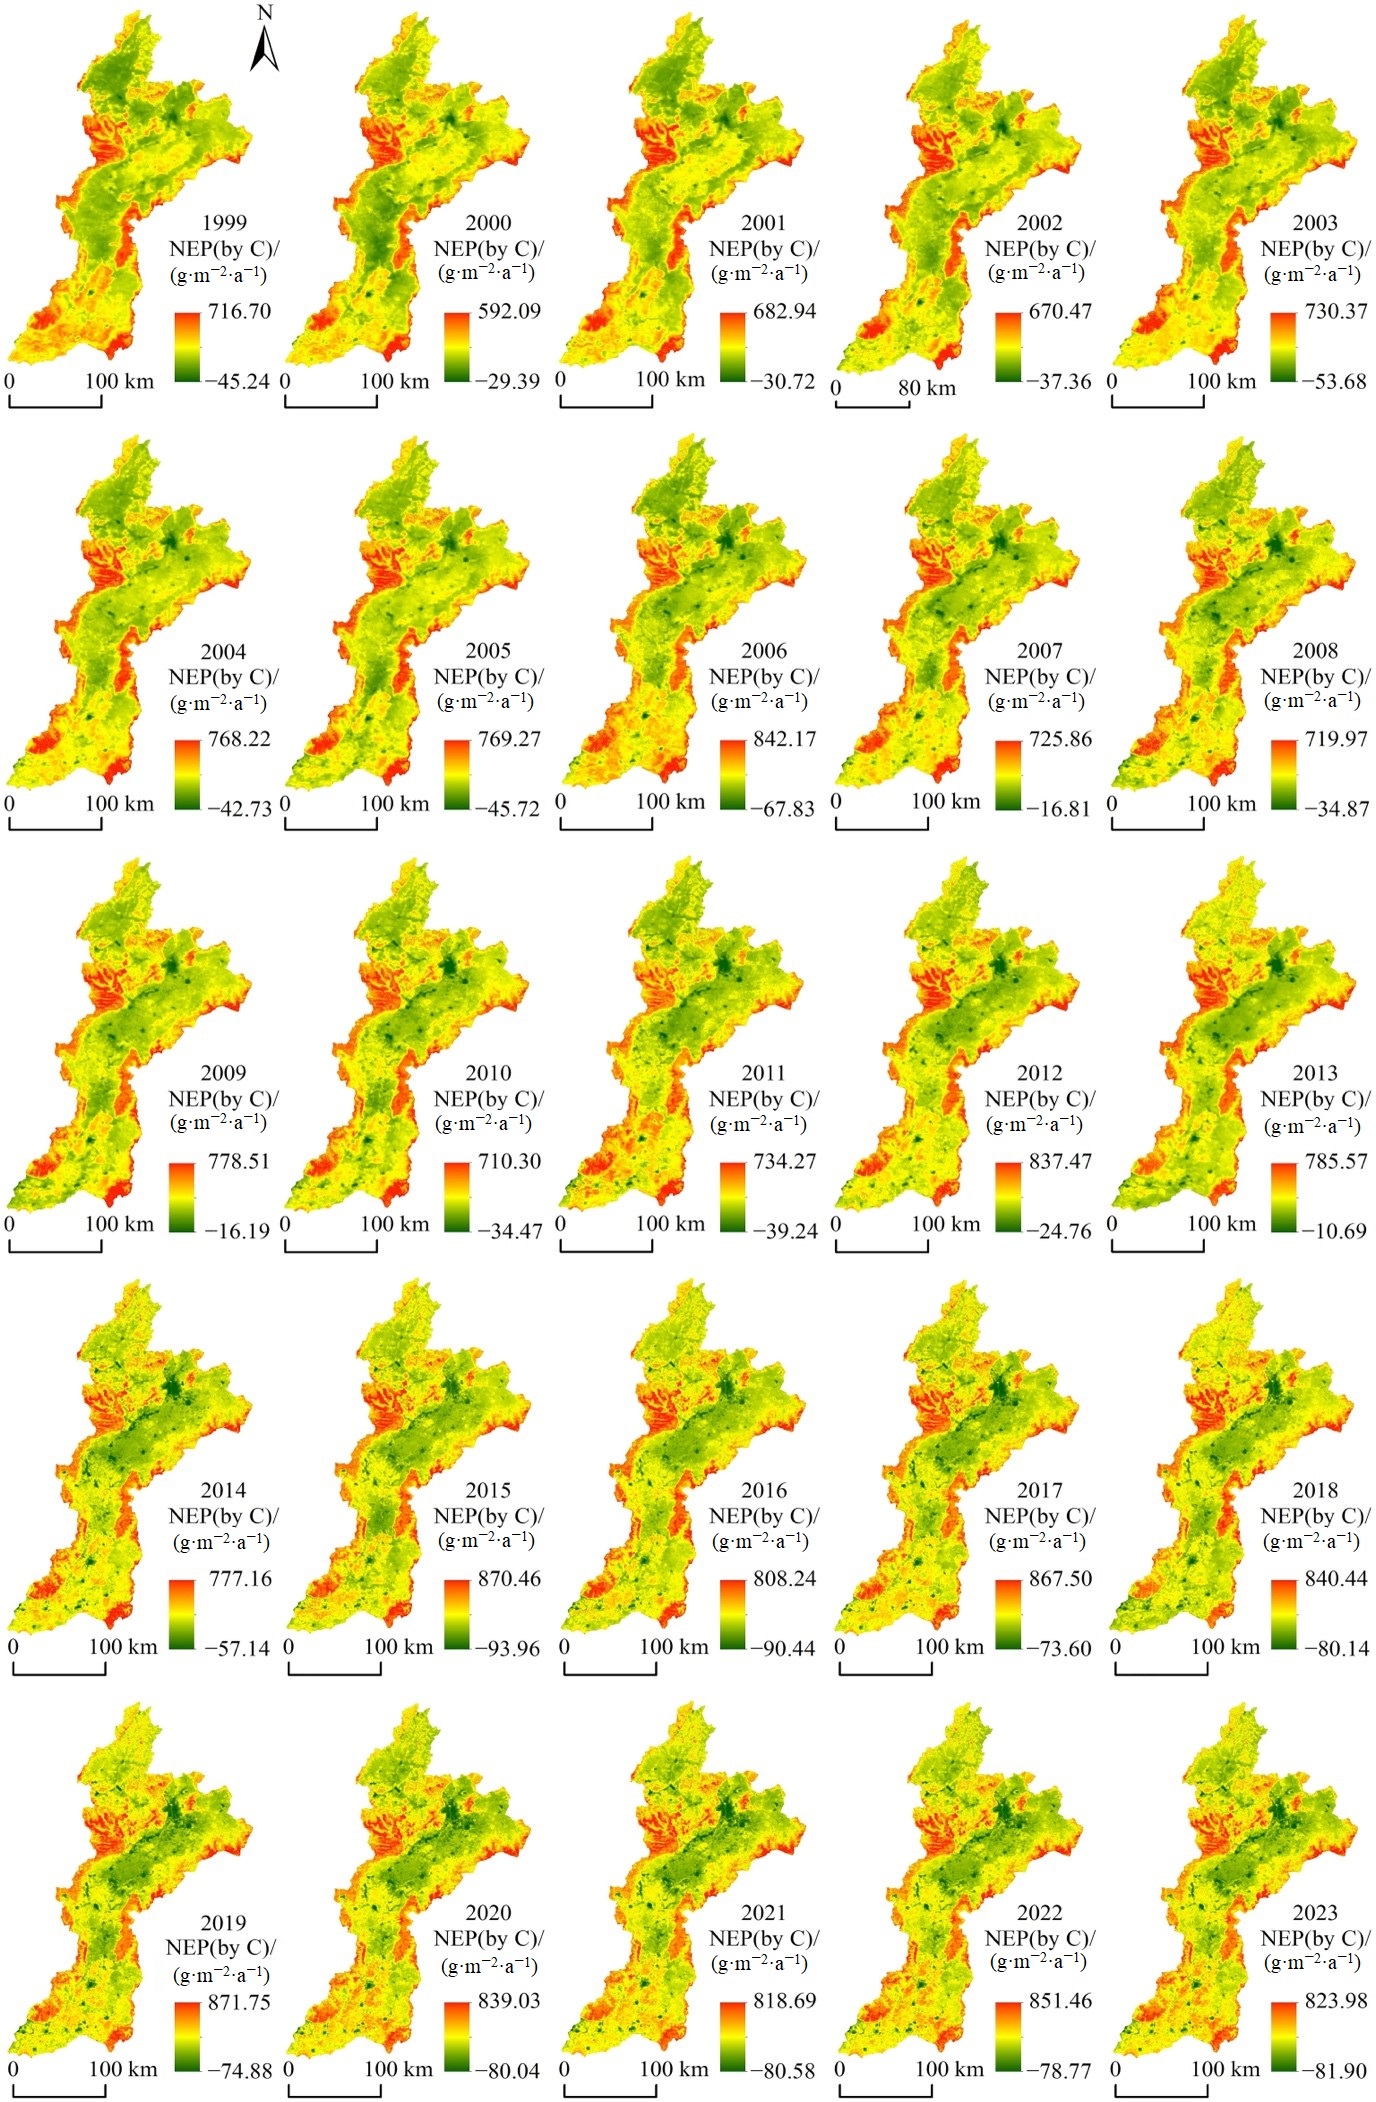
图7 1999-2023年汾河流域植被NEP的空间分布
Figure 7 Spatial distribution of vegetation NEP in Fenhe River basin, 1999-2023
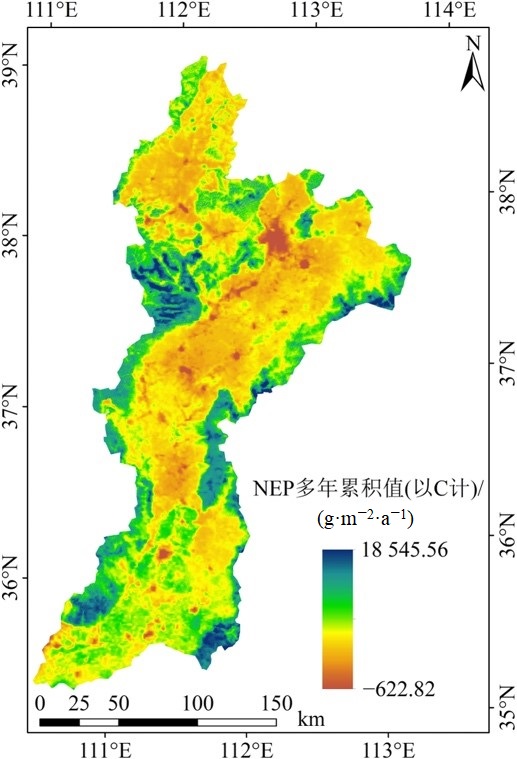
图8 1999-2023年汾河流域植被NEP空间多年累积图
Figure 8 Spatial multi-year cumulative map of vegetation NEP in Fenhe River Basin, 1999-2023
| 年份 | 预测值(以C计)/(g·m−2·a−1) | 年份 | 预测值(以C计)/(g·m−2·a−1) |
|---|---|---|---|
| 2024 | 162.00 | 2039 | 240.81 |
| 2025 | 166.34 | 2040 | 247.26 |
| 2026 | 170.79 | 2041 | 253.88 |
| 2027 | 175.37 | 2042 | 260.68 |
| 2028 | 180.06 | 2043 | 267.67 |
| 2029 | 184.89 | 2044 | 274.83 |
| 2030 | 189.84 | 2045 | 282.19 |
| 2031 | 194.92 | 2046 | 289.75 |
| 2032 | 200.14 | 2047 | 297.51 |
| 2033 | 205.50 | 2048 | 305.48 |
| 2034 | 211.01 | 2049 | 313.66 |
| 2035 | 216.66 | 2050 | 322.06 |
| 2036 | 222.46 | 2051 | 330.68 |
| 2037 | 228.42 | 2052 | 339.54 |
| 2038 | 234.53 | 2053 | 348.63 |
表2 汾河流域2024-2053年植被年均碳汇量预测值
Table 2 Projected annual average carbon sink of vegetation in Fenhe River Basin, 2024-2053
| 年份 | 预测值(以C计)/(g·m−2·a−1) | 年份 | 预测值(以C计)/(g·m−2·a−1) |
|---|---|---|---|
| 2024 | 162.00 | 2039 | 240.81 |
| 2025 | 166.34 | 2040 | 247.26 |
| 2026 | 170.79 | 2041 | 253.88 |
| 2027 | 175.37 | 2042 | 260.68 |
| 2028 | 180.06 | 2043 | 267.67 |
| 2029 | 184.89 | 2044 | 274.83 |
| 2030 | 189.84 | 2045 | 282.19 |
| 2031 | 194.92 | 2046 | 289.75 |
| 2032 | 200.14 | 2047 | 297.51 |
| 2033 | 205.50 | 2048 | 305.48 |
| 2034 | 211.01 | 2049 | 313.66 |
| 2035 | 216.66 | 2050 | 322.06 |
| 2036 | 222.46 | 2051 | 330.68 |
| 2037 | 228.42 | 2052 | 339.54 |
| 2038 | 234.53 | 2053 | 348.63 |
| [1] | GAO D C, FRANK H, ZHANG L, et al., 2018. Small and transient response of winter soil respiration and microbial communities to altered snow depth in a mid-temperate forest[J]. Applied Soil Ecology, 130: 40-49. |
| [2] | GRACE J, 2010. Understanding and managing the global carbon cycle[J]. Journal of Ecology, 92(2): 189-202. |
| [3] | JENTSCH A, KREYLING J, ELMER M, et al., 2011. Climate extremes initiate ecosystem-regulating functions while maintaining productivity[J]. Journal of Ecology, 99(3): 689-702. |
| [4] | LEE B, KIM N, KIM E S, et al., 2020. An artificial intelligence approach to predict gross primary productivity in the forests of South Korea using satellite remote sensing data[J]. Forests, 11(9): 1000. |
| [5] | MAO M, CHIRWA E C, 2006. Application of grey model GM (1, 1) to vehicle fatality risk estimation[J]. Technological Forecasting & Social Change, 73(5): 588-605. |
| [6] | MASELLII F, ARGENTI G, CHIESI M, et al., 2013. Simulation of grassland productivity by the combination of ground and satellite data[J]. Agriculture Ecosystems & Environment, 165: 163-172. |
| [7] | MATSUSHITA B, TAMURA M, 2002. Integrating remotely sensed data with an ecosystem model to estimate net primary productivity in East Asia[J]. Remote Sensing of Environment, 81(1): 58-66. |
| [8] | QIN D, MANNING M, CHEN Z, et al., 2013. The Physical Science Basis. Contribution of Working Group I to the Fourth Assessment Report of the Intergovernmental Panel on Climate Change (IPCC)[J]. Computational Geometry, 18(2): 95-123. |
| [9] | TURNER D P, RITTS W D, COHEN W B, et al., 2006. Evaluation of MODIS NPP and GPP products across multiple biomes-ScienceDirect[J]. Remote Sensing of Environment, 102(3-4): 282-292. |
| [10] | YAN M, TIAN X, LI Z Y, et al., 2016. Simulation of forest carbon fluxes using model incorporation and data assimilation[J]. Remote Sensing, 8(7): 1-16. |
| [11] | YU R Y, YAO Y J, TANG Q X, et al., 2023. Coupling a light use efficiency model with a machine learning-based water constraint for predicting grassland gross primary production[J]. Agricultural and Forest Meteorology, 341: 109634. |
| [12] | ZHANG Z Q, HUO L J, SU Y X, et al., 2024. Estimation of corn net primary productivity and carbon sequestration based on the CASA Model: A case study of the Fen River Basin[J]. Sustainability, 16(7): 2942. |
| [13] | ZHAO F, ZHANG L, XU Z, et al., 2010. Evaluation of methods for estimating the effects of vegetation change and climate variability on streamflow[J]. Water Resources Research, 46(3): 742-750. |
| [14] | 白天豪, 贡恩军, 周娜芳, 等, 2024. 2001-2022年秦巴山区生态碳汇时空格局及驱动力分析[J/OL]. 环境科学, 1-15[2024-05-27]. https://doi.org/10.13227/j.hjkx.202401064. |
| BAI T H, GONG E J, ZHOU N F, et al., 2024. Spatiotemporal patterns and driving forces analysis of ecological carbon sink from 2001 to 2022 in Qinling-Daba Mountains, China[J/OL]. Environmental Science, 1-15 [2024-05-27]. https://doi.org/10.13227/j.hjkx.202401064. | |
| [15] | 白建伟, 2020. 汾河流域近17年植被覆盖度时空特征变化研究[D]. 太原: 山西农业大学. |
| BAI J W, 2020. Full-time master degree dissertation study on temporal and spatial changes of FVC in Fen River basin from 2001 to 2017[D]. Taiyuan: Shanxi Agricultural University. | |
| [16] |
陈科屹, 王建军, 何友均, 等, 2022. 黑龙江大兴安岭重点国有林区森林碳储量及固碳潜力评估[J]. 生态环境学报, 31(9): 1725-1734.
DOI |
| CHEN K Y, WANG J J, HE Y J, et al., 2022. Estimations of forest carbon storage and carbon sequestration potential of key state-owned forest region in Daxing’anling, Heilongjiang Province[J]. Ecology and Environmental Sciences, 31(9): 1725-1734. | |
| [17] | 邓聚龙, 1987. 灰色预测模型GM(1, 1)的三种性质——灰色预测控制的优化结构与优化信息量问题[J]. 华中工学院学报 (5): 3-8. |
| DENG J L, 1987. The three properties of grey prediction model GM(1, 1): Optimization structure and optimization information quantity of grey prediction control[J]. Journal of Huazhong University of Technology (5): 3-8. | |
| [18] | 傅伯杰, 于丹丹, 吕楠, 2017. 中国生物多样性与生态系统服务评估指标体系[J]. 生态学报, 37(2): 341-348. |
| FU B J, YU D D, LÜ N, 2017. An indicator system for biodiversity and ecosystem services evaluation in China[J]. Acta Ecologica Sinica, 37(2): 341-348. | |
| [19] |
付扬军, 师学义, 2023. 基于小流域尺度的县域国土空间生态修复分区——以山西汾河上游为例[J]. 自然资源学报, 38(5): 1225-1239.
DOI |
| FU Y J, SHI X Y, 2023. Ecological restoration zoning of county-level territorial space based on small watershed scale: A case study of the upper Fenhe River in Shanxi[J]. Journal of Natural Resources, 38(5): 1225-1239. | |
| [20] | 葛杰, 刘园, 雒舒琪, 等, 2024. 基于自适应模糊推理系统的汾河流域参考作物蒸散量模拟研究[J]. 灌溉排水学报, 43(1): 69-77. |
| GE J, LIU Y, LUO S Q, et al., 2024. Simulation research of reference crop evapotranspiration based on ANFIS in Fenhe River basin[J]. Journal of Irrigation and Drainage, 43(1): 69-77. | |
| [21] | 焦丽君, 刘瑞民, 王林芳, 等, 2022. 基于SWAT模型的汾河流域生态补水研究[J]. 生态学报, 42(14): 5778-5788. |
| JIAO L J, LIU R M, WANG L F, et al., 2022. Study on ecological water supplement in Fenhe River Basin based on SWAT Model[J]. Acta Ecologica Sinica, 42(14): 5778-5788. | |
| [22] | 金湘军, 2024. 政府工作报告——2024年1月23日在山西省第十四届人民代表大会第二次会议上[J]. 山西省人民政府公报 (2): 3-15. |
| JIN X J, 2024. Government Work Report-January 23, 2024 at the second session of the 14th People’s Congress of Shanxi Province[J]. Official Gazette of Shanxi Provincial People’s Government (2): 3-15. | |
| [23] |
李晖, 李必龙, 葛黎黎, 等, 2023. 2000-2021年汾河流域植被时空演变特征及地形效应[J]. 生态环境学报, 32(3): 439-449.
DOI |
| LI H, LI B L, GE L L, et al., 2013. Temporal and spatial characteristics of vegetation evolution and topographic effects in Fenhe River Basin from 2000 to 2021[J]. Ecology and Environmental Sciences, 32(3): 439-449. | |
| [24] | 李京京, 吕哲敏, 石小平, 等, 2016. 基于地形梯度的汾河流域土地利用时空变化分析[J]. 农业工程学报, 32(7): 230-236. |
| LI J J, LÜ Z M, SHI X P, et al., 2016. Spatiotemporal variations analysis for land use in Fen River Basin based on terrain gradient[J]. Transactions of the Chinese Society of Agricultural Engineering, 32(7): 230-236. | |
| [25] | 李静文, 李振涵, 吴海滨, 等, 2024. 汾河流域水资源承载力评估及生态敏感性分析[J]. 环境工程学报, 18(2): 359-370. |
| LI J W, LI Z H, WU H B, et al., 2024. Assessment of water resources carrying capacity and ecological sensitivity analysis in Fenhe River Basin[J]. Chinese Journal of Environmental Engineering, 18(2): 359-370. | |
| [26] | 刘健, 张泽中, 冯凯, 等, 2024. 内蒙古高原内陆河流域植被净初级生产力时空演变特征及驱动因素[J]. 生态学报, 44(22): 1-13. |
| LIU J, ZHANG Z Z, FENG K, et al., 2024. Spatio-temporal evolution characteristics and driving factors of net primary productivity of vegetation in the Inland River Basin of the Inner Mongolia Plateau[J]. Acta Ecologica Sinica, 44(22): 1-13. | |
| [27] | 刘亮, 关靖云, 穆晨, 等, 2022. 2008-2018年伊犁河流域植被净初级生产力时空分异特征[J]. 生态学报, 42(12): 4861-4871. |
| LIU L, GUAN J Y, MU C, et al., 2022. Spatio-temporal characteristics of vegetation net primary productivity in the Ili River Basin from 2008 to 2018[J]. Acta Ecologica Sinica, 42(12): 4861-4871. | |
| [28] |
刘思峰, 邓聚龙, 2000. GM(1, 1)模型的适用范围[J]. 系统工程理论与实践, 20(5): 121-124.
DOI |
| aLIU S F, DENG J L, 2000. Scope of Application of GM (1, 1) Model[J]. System Engineering Theory and Practice, 20(5): 121-124. | |
| [29] | 刘徐师, 2017. 太行山吕梁山森林生态建设技术对策与建议[J]. 山西林业, 7(4): 18-19. |
| LIU X S, 2017. Technical countermeasures and suggestions for forest ecological construction in Taihang Mountains and Lüliang Mountains[J]. Shanxi Forestry, 7(4): 18-19. | |
| [30] | 刘啸添, 周蕾, 石浩, 等, 2018. 基于多种遥感植被指数、叶绿素荧光与CO2通量数据的温带针阔混交林物候特征对比分析[J]. 生态学报, 38(10): 3482-3494. |
| LIU X T, ZHOU L, SHI H, et al., 2018. Comparative analysis of climatic characteristics of temperate mixed conifer forests based on multiple remotely sensed vegetation indices, chlorophyll fluorescence and CO2 flux data[J]. Journal of Ecology, 38(10): 3482-3494. | |
| [31] | 刘应帅, 余瑞, 郑彬彬, 等, 2022. 海南岛森林植被NEP季节性时空变化规律及气候驱动因素分析[J]. 热带生物学报, 13(2): 166-176. |
| LIU Y S, YU R, ZHENG B B, et al., 2022. Analysis of seasonal spatial and temporal variation patterns of forest vegetation NEP and climate drivers in Hainan Island[J]. Journal of Tropical Biology, 13(2): 166-176. | |
| [32] | 吕梁市水利局, 2018. 加大综合治理力度扎实推进生态建设[J]. 山西水土保持科技 (4): 5-6. |
| Water Resources Bureau of Lüliang City, 2018. Strengthening comprehensive management efforts and solidly promoting ecological construction[J]. Shanxi Soil and Water Conservation Technology (4): 5-6. | |
| [33] | 潘竟虎, 文岩, 2015. 中国西北干旱区植被碳汇估算及其时空格局[J]. 生态学报, 35(23): 7718-7728. |
| PAN J H, WEN Y, 2015. Estimation and spatial-temporal characteristics of carbon sink in the arid region of northwest China[J]. Acta Ecologica Sinica, 35(23): 7718-7728. | |
| [34] | 裴志永, 周才平, 欧阳华, 等, 2010. 青藏高原高寒草原区域碳估测[J]. 地理研究, 29(1): 102-110. |
| PEI Z Y, ZHOU C P, OUYANG H, et al., 2010. A carbon budget of alpine steppe area in the Tibetan Plateau[J]. Geographical Research, 29(1): 102-110. | |
| [35] | 水利部山西省人民政府联合印发, 2016. 《汾河流域生态修复规划(2015-2030年)》[J]. 山西水利 (4): 53. |
| The Ministry of Water Resources and the People’s Government of Shanxi Province jointly issued, 2016. the “Fen River Basin Ecological Restoration Plan (2015-2030)”[J]. Shanxi Water Resources (4): 53. | |
| [36] | 田惠文, 毕如田, 朱洪芬, 等, 2019. 汾河流域植被净初级生产力的驱动因素及梯度效应[J]. 生态学杂志, 38(10): 3066-3074. |
| TIAN H W, BI R T, ZHU H F, et al., 2019. Driving factors and gradient effect of net primary productivity in Fenhe River Basin[J]. Chinese Journal of Ecology, 38(10): 3066-3074. | |
| [37] | 田朋飞, 闫丰, 王宗超, 等, 2024. 太行山-燕山碳源/碳汇时空变化及驱动因素分析[J/OL]. 环境科学, 1-21 [2024-10-23]. https://doi.org/10.13227/j.hjkx.202406227. |
| TIAN P F, YAN F, WANG Z C, et al., 2024. Analysis of Driving Factors for Spatiotemporal Changes in Carbon Sources/Sinks in Taihang Mountains and Yanshan Mountains[J/OL]. Environmental Science, 1-21 [2024-10-23]. https://doi.org/10.13227/j.hjkx.202406227. | |
| [38] | 王标, 朱洪芬, 许月凤, 等, 2023. 基于时空分解的汾河流域植被净初级生产力的变异性及驱动因子分析[J]. 山西农业科学, 51(1): 98-109. |
| WANG B, ZHU H F, XU Y F, et al., 2023. Analysis of variability and driving factors of net primary productivity of vegetation in the Fen River Basin based on spatial and temporal decomposition[J]. Shanxi Agricultural Science, 51(1): 98-109. | |
| [39] | 王登, 荐圣淇, 胡彩虹, 2018. 气候变化和人类活动对汾河流域径流情势影响分析[J]. 干旱区地理, 41(1): 25-31. |
| WANG D, JIAN S Q, HU C H, 2018. Impacts of climate change and human activities on runoff in Fenhe River Basin[J]. Arid Land Geography, 41(1): 25-31. | |
| [40] | 徐勇, 黄雯婷, 郭振东, 等, 2023. 2000-2020年我国西南地区植被 NEP 时空变化及其驱动因素的相对贡献[J]. 环境科学研究, 36(3): 557-570. |
| XU Y, HUANG W T, GUO Z D, et al., 2023. Spatio-temporal variation of vegetation net ecosystem productivity and relative contribution of driving forces in Southwest China from 2000 to 2020[J]. Research of Environmental Sciences, 36(3): 557-570. | |
| [41] | 杨顺富, 赵宇鸾, 李秀彬, 等, 2024. 中南半岛喀斯特山区植被NEP的时空变化及驱动因素[J]. 生态学报, 44(22): 1-16. |
| YANG S F, ZHAO Y L, LI X B, et al., 2024. Spatio-temporal variations and driving factors of vegetation NEP in karst mountainous areas of the Indochin aPeninsula[J]. Acta Ecologica Sinica, 44(22): 1-16. | |
| [42] | 张照玺, 2016. 气候变化和人类活动对汾河流域入黄径流影响分析[D]. 郑州: 郑州大学. |
| ZHANG Z X, 2016. Assessments of Impacts of Climate Change and Human Activities on the Runoff from the Fenhe River Basin into the yellow River[D]. Zhengzhou: Zhengzhou University. | |
| [43] | 钟聪, 2015. 山西太原, 大同, 临汾等六大盆地农田生态系统区域生态地球化学评价[D]. 北京: 中国地质大学(北京). |
| ZHONG C, 2015. A regional eco-geochemical assessment in agroecosystem of main basins in Shanxi Province[D]. Beijing: China University of Geosciences (Beijing). | |
| [44] | 朱文泉, 2005. 中国陆地生态系统植被净初级生产力遥感估算及其与气候变化关系的研究[D]. 北京: 北京师范大学. |
| ZHU W Q, 2005. Remote sensing estimation of net primary productivity of vegetation in terrestrial ecosystems in China and its relationship with climate change[D]. Beijing: Beijing Normal University. | |
| [45] | 朱文泉, 潘耀忠, 何浩, 等, 2006. 中国典型植被最大光利用率模拟[J]. 科学通报, 51(6): 700-706. |
| ZHU W Q, PAN Y Z, HE H, et al., 2006. Simulation of maximum light use efficiency for some typical vegetation types in China[J]. Chinese Science Bulletin, 51(6): 700-706. | |
| [46] |
朱文泉, 潘耀忠, 张锦水, 2007. 中国陆地植被净初级生产力遥感估算[J]. 植物生态学报, 31(3): 413-424.
DOI |
| ZHU W Q, PAN Y Z, ZHANG J S, 2007. Estimation of net primary productivity of Chinese terrestrial vegetation based on remote sensing[J]. Journal of Plant Ecology, 31(3): 413-424. | |
| [47] |
朱小聪, 2022. 汾河流域植被生产力时空变异特征分析[J]. 中国农学通报, 38(5): 86-93.
DOI |
|
ZHU X C, 2022. Spatial and temporal variation characteristics of vegetation productivity in Fen River Basin[J]. Chinese Agricultural Science Bulletin, 38(5): 86-93.
DOI |
| [1] | 侯金龙, 马志强, 杨澄, 葛双双, 何迪, 董璠. 京津冀地区植被碳源/汇的时空变化特征及影响因素分析[J]. 生态环境学报, 2024, 33(9): 1329-1338. |
| [2] | 翟涌光, 王晓妮, 郝蕾, 戚文超, 王雅崧, 耿佳玉, 兰穹穹, 王志国. 2001-2020年内蒙古净生态系统生产力格局多时间尺度分析[J]. 生态环境学报, 2024, 33(2): 167-179. |
| [3] | 郝蕾, 翟涌光, 戚文超, 兰穹穹. 2001-2020年内蒙古植被碳源/碳汇时空动态及对气候因子的响应[J]. 生态环境学报, 2023, 32(5): 825-834. |
| [4] | 李晖, 李必龙, 葛黎黎, 韩琛惠, 杨倩, 张岳军. 2000-2021年汾河流域植被时空演变特征及地形效应[J]. 生态环境学报, 2023, 32(3): 439-449. |
| [5] | 田义超, 杨棠, 徐欣. 北部湾典型入海流域植被净初级生产力时空分布特征及其影响因素[J]. 生态环境学报, 2021, 30(5): 938-948. |
| 阅读次数 | ||||||
|
全文 |
|
|||||
|
摘要 |
|
|||||