生态环境学报 ›› 2023, Vol. 32 ›› Issue (8): 1405-1418.DOI: 10.16258/j.cnki.1674-5906.2023.08.006
王金明1( ), 秦晓波1,*(), 万运帆1, 周盛1, 张志伟1,2
收稿日期:2023-04-28
出版日期:2023-08-18
发布日期:2023-11-08
通讯作者:
*秦晓波。E-mail: qinxiaobo@caas.cn作者简介:王金明(1996年生),女,硕士研究生,研究方向为农业温室气体排放与减排。E-mail: wangjinming0305@163.com
基金资助:
WANG Jinming1(), QIN Xiaobo1,*(), WAN Yunfan1, ZHOU Sheng1, ZHANG Zhiwei1,2
Received:2023-04-28
Online:2023-08-18
Published:2023-11-08
摘要:
水稻是中国及全球食物系统的重要组成部分,以食物系统视角研究其生命周期碳足迹对实现水稻食物系统低碳转型和绿色发展具有重要意义。该研究基于中国2018年22个水稻主产省份的统计数据,结合生命周期评估(LCA)法和国际水稻研究所(IRRI)开发的CF-Rice水稻碳足迹计算工具,计算并分析了中国水稻食物系统“从摇篮到销售”的碳足迹及其结构组成、地区差异和水稻类型差异。结果表明:1)以单位产量碳足迹进行比较(以CO2 eq计),晚籼稻 (2.31 kg?kg-1)>中籼稻 (1.32 kg?kg-1)>粳稻 (1.13 kg?kg-1)>早籼稻 (1.08 kg?kg-1);以单位面积碳足迹进行比较(以CO2 eq计),晚籼稻 (9.15×10³ kg?hm-2)>中籼稻 (6.34×10³ kg?hm-2)>粳稻 (5.56×10³ kg?hm-2)>早籼稻 (4.16×10³ kg?hm-2);2)稻田甲烷(CH4)是水稻食物系统碳足迹最主要的组成部分,占36.2%-71.5%,其次是施肥,占8.69%-20.0%,收获环节占8.41%-18.5%,产前环节占4.97%-12.1%,机械作业、仓储、加工、包装和运输环节虽占比较小(均<10%)但也不容忽视;3)早籼稻、中籼稻和晚籼稻没有表现出明显的空间分布规律,而粳稻呈现出自北向南碳足迹增加的趋势,具体表现为:除山东外,东北地区(黑龙江、吉林、辽宁)和华北地区(内蒙古、河北)的粳稻碳足迹低于华东地区(安徽、江苏、浙江)、华中地区(河南、湖北)和西南地区(云南);4)从温室气体的构成来看,CH4对水稻食物系统碳足迹的贡献率最高,达到20.1%-76.4%,其次为二氧化碳(CO2),贡献率为21.1%-72.3%,氧化亚氮(N2O)的贡献率最低,仅有1.76%-10.7%。水稻食物系统碳足迹的地区和类型差异主要与气候条件、种植管理措施和排放因子有关,因此,控制稻田CH4排放,优化水肥管理,减少能源消耗及粮食损失和浪费可有效降低水稻食物系统碳足迹。
中图分类号:
王金明, 秦晓波, 万运帆, 周盛, 张志伟. 中国水稻食物系统碳足迹结构组成和地区差异[J]. 生态环境学报, 2023, 32(8): 1405-1418.
WANG Jinming, QIN Xiaobo, WAN Yunfan, ZHOU Sheng, ZHANG Zhiwei. Structure and Regional Differences of Carbon Footprint of Rice Food System in China[J]. Ecology and Environment, 2023, 32(8): 1405-1418.
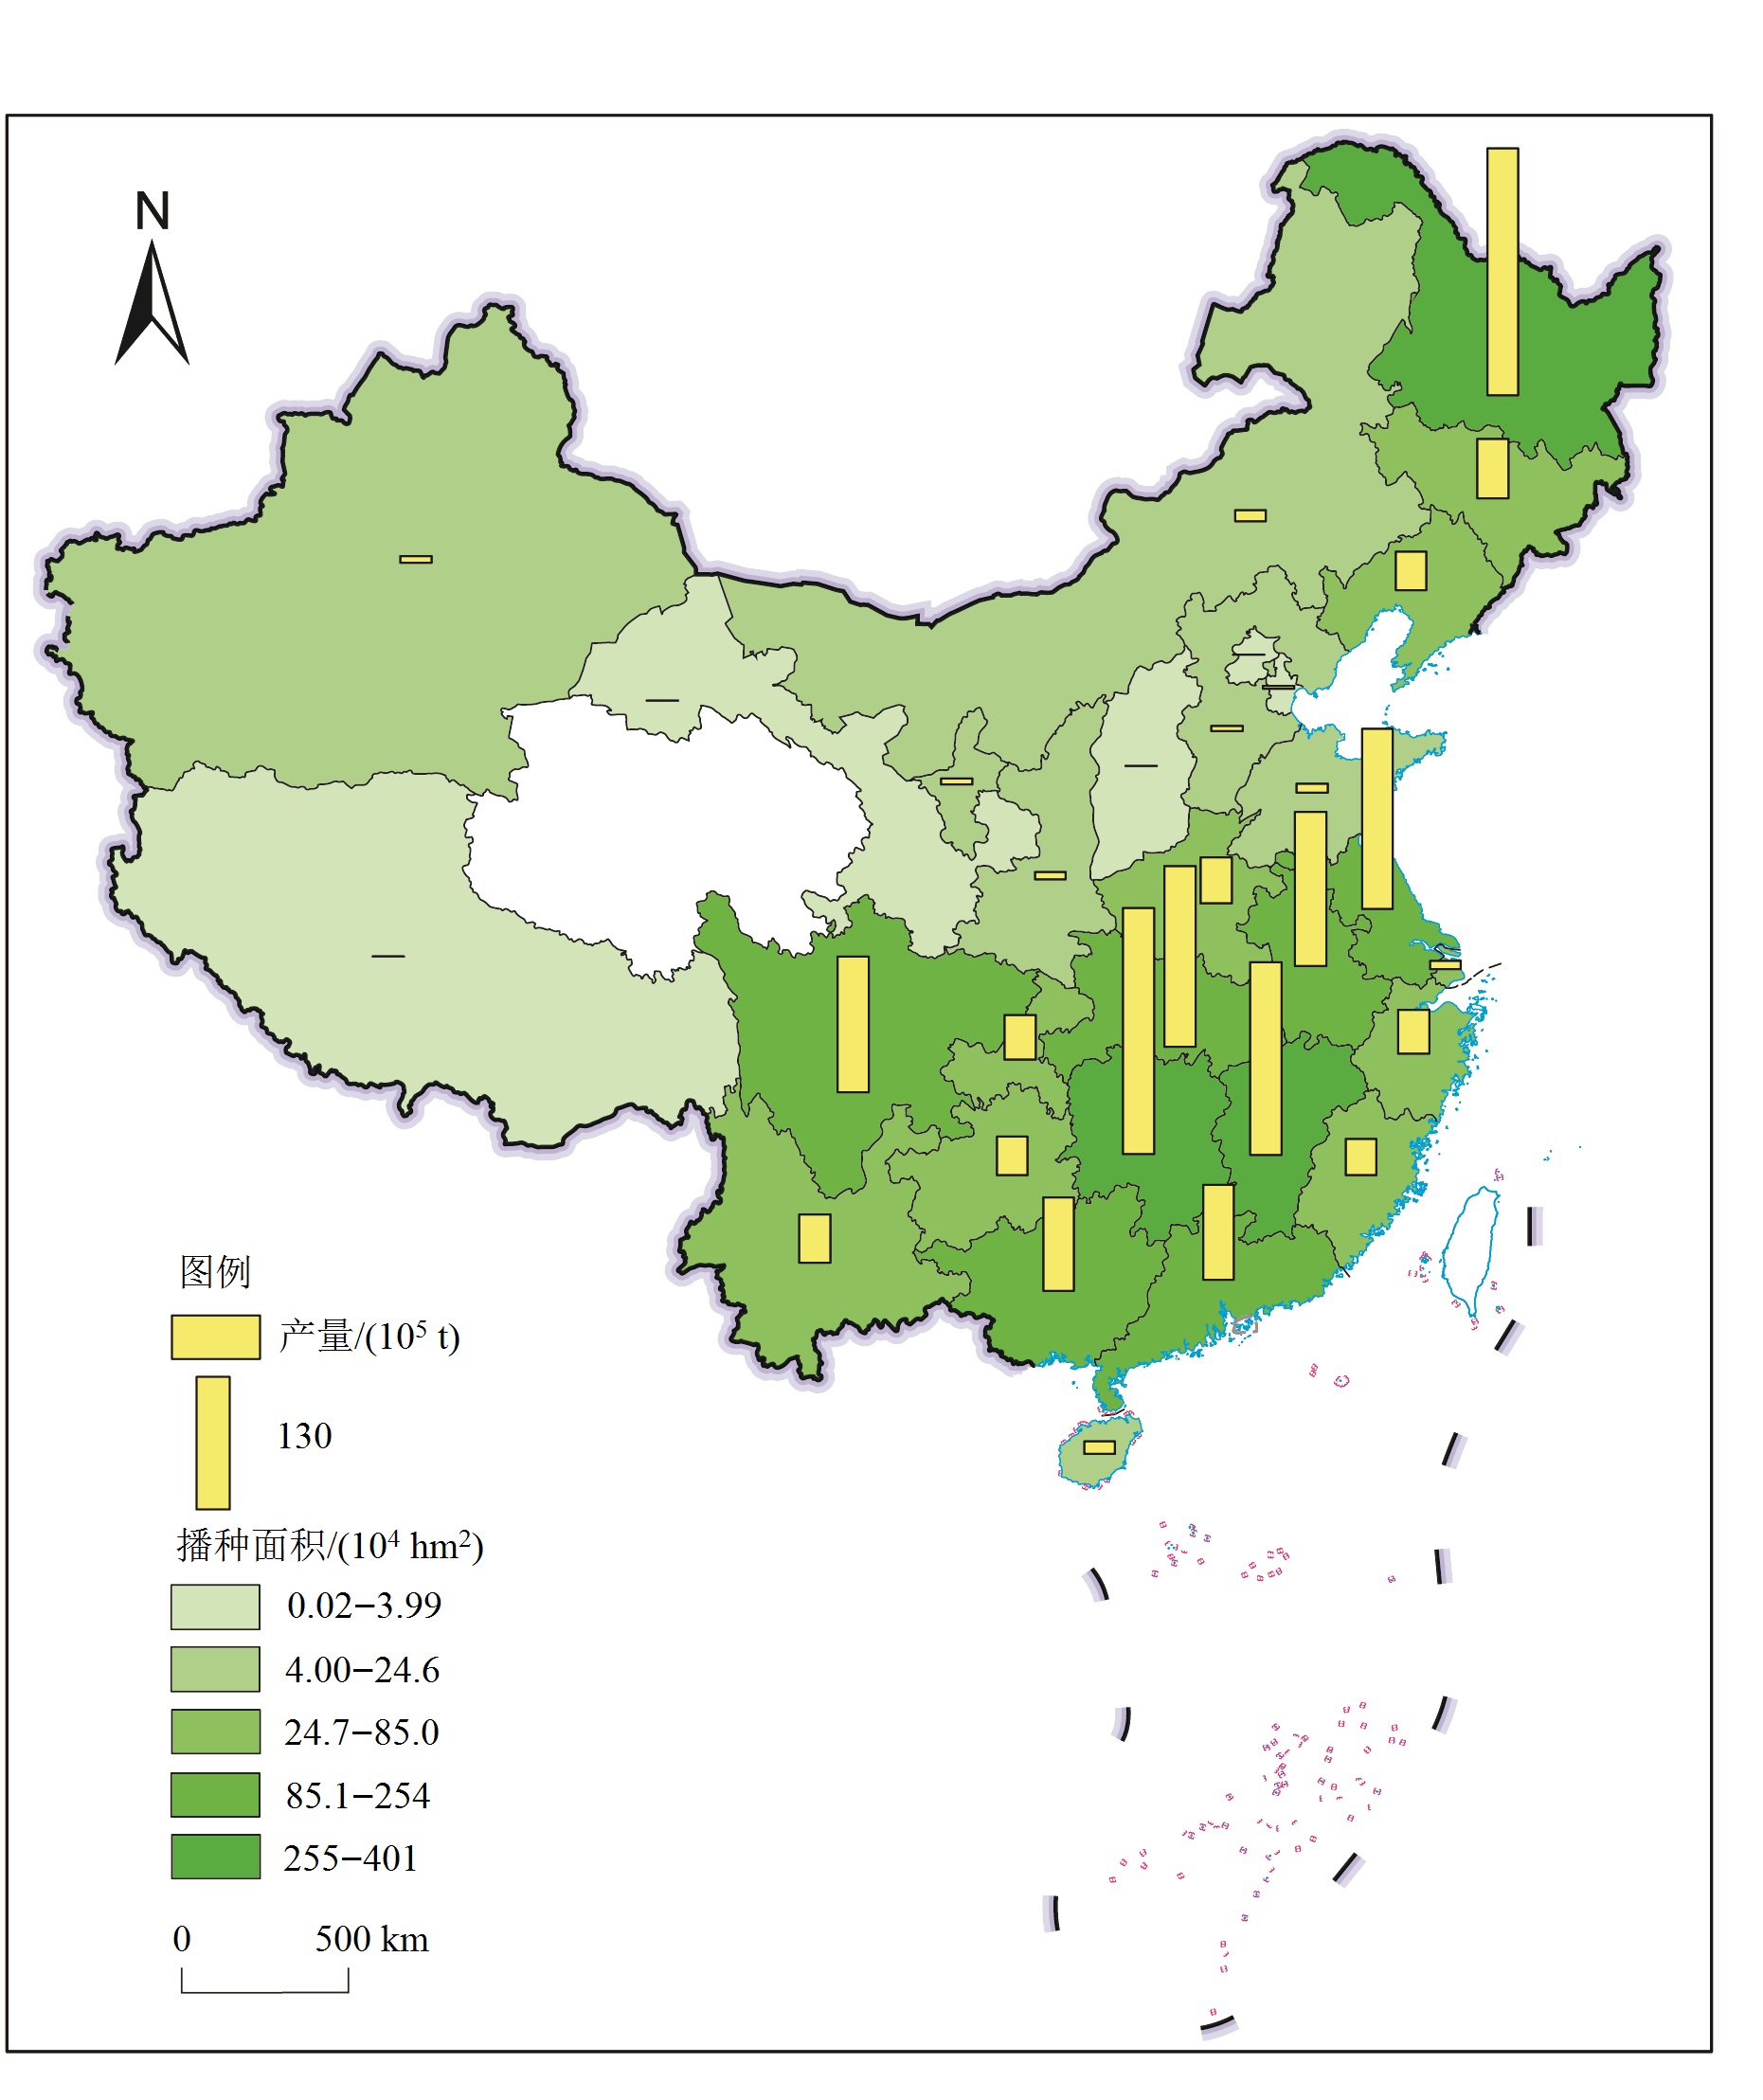
图1 2018年全国各省稻谷种植面积和产量 上图基于中华人民共和国自然资源部下载的审图号为GS(2023)2763号标准地图制作,底图无修改
Figure 1 China’s rice planting area and grain yield in 2018
| 地区 | 排放系数/(kg∙hm-2) | |||
|---|---|---|---|---|
| 早籼稻 | 中籼稻 | 晚籼稻 | 粳稻 | |
| 全国 | 80.2 | 193 | 207 | 131 |
| 河北 | 56.0 | |||
| 内蒙古 | 42.3 | |||
| 辽宁 | 75.3 | |||
| 吉林 | 44.0 | |||
| 黑龙江 | 82.0 | |||
| 江苏 | 159 | 159 | ||
| 浙江 | 154 | 287 | 276 | |
| 安徽 | 128 | 167 | 258 | 167 |
| 福建 | 151 | 408 | 287 | |
| 江西 | 76.5 | 199 | ||
| 山东 | 39.4 | |||
| 河南 | 142 | 142 | ||
| 湖北 | 124 | 189 | 253 | 189 |
| 湖南 | 76.4 | 226 | 199 | |
| 广东 | 78.0 | 214 | ||
| 广西 | 83.8 | 217 | ||
| 海南 | 50.0 | 181 | ||
| 重庆 | 283 | |||
| 四川 | 237 | |||
| 贵州 | 290 | |||
| 云南 | 91.2 | 91.2 | ||
| 陕西 | 185 | |||
表1 稻田CH4排放系数
Table 1 CH4 emission factort of rice field
| 地区 | 排放系数/(kg∙hm-2) | |||
|---|---|---|---|---|
| 早籼稻 | 中籼稻 | 晚籼稻 | 粳稻 | |
| 全国 | 80.2 | 193 | 207 | 131 |
| 河北 | 56.0 | |||
| 内蒙古 | 42.3 | |||
| 辽宁 | 75.3 | |||
| 吉林 | 44.0 | |||
| 黑龙江 | 82.0 | |||
| 江苏 | 159 | 159 | ||
| 浙江 | 154 | 287 | 276 | |
| 安徽 | 128 | 167 | 258 | 167 |
| 福建 | 151 | 408 | 287 | |
| 江西 | 76.5 | 199 | ||
| 山东 | 39.4 | |||
| 河南 | 142 | 142 | ||
| 湖北 | 124 | 189 | 253 | 189 |
| 湖南 | 76.4 | 226 | 199 | |
| 广东 | 78.0 | 214 | ||
| 广西 | 83.8 | 217 | ||
| 海南 | 50.0 | 181 | ||
| 重庆 | 283 | |||
| 四川 | 237 | |||
| 贵州 | 290 | |||
| 云南 | 91.2 | 91.2 | ||
| 陕西 | 185 | |||
| 排放源 | 碳排放系数 | 啊啊啊啊 |
|---|---|---|
| 泡田 | 331 kg∙hm-2 | International Rice Research Institute, |
| 种子 | 1.84 kg∙hm-2 | 王兴等, |
| 农药 | 66.3 kg∙hm-2 | International Rice Research Institute, |
| 氮肥 | 5.68 g∙kg-1 | |
| 灌溉耗电 | 97.0 kg∙hm-2 | |
| 农机耗能 | 230 kg∙hm-2 | |
| 仓储耗电 | 11.0 kg∙t-1 | |
| 加工耗电 | 23.0 kg∙t-1 | |
| 包装耗电 | 2.00 kg∙t-1 | |
| 拖拉机耗能 | 0.257 g∙kg-1∙km-1 |
表2 其他排放源碳排放系数
Table 2 Carbon emission factors of other sources
| 排放源 | 碳排放系数 | 啊啊啊啊 |
|---|---|---|
| 泡田 | 331 kg∙hm-2 | International Rice Research Institute, |
| 种子 | 1.84 kg∙hm-2 | 王兴等, |
| 农药 | 66.3 kg∙hm-2 | International Rice Research Institute, |
| 氮肥 | 5.68 g∙kg-1 | |
| 灌溉耗电 | 97.0 kg∙hm-2 | |
| 农机耗能 | 230 kg∙hm-2 | |
| 仓储耗电 | 11.0 kg∙t-1 | |
| 加工耗电 | 23.0 kg∙t-1 | |
| 包装耗电 | 2.00 kg∙t-1 | |
| 拖拉机耗能 | 0.257 g∙kg-1∙km-1 |

图2 水稻食物系统生命周期图
Figure 2 Life cycle diagram of rice food system
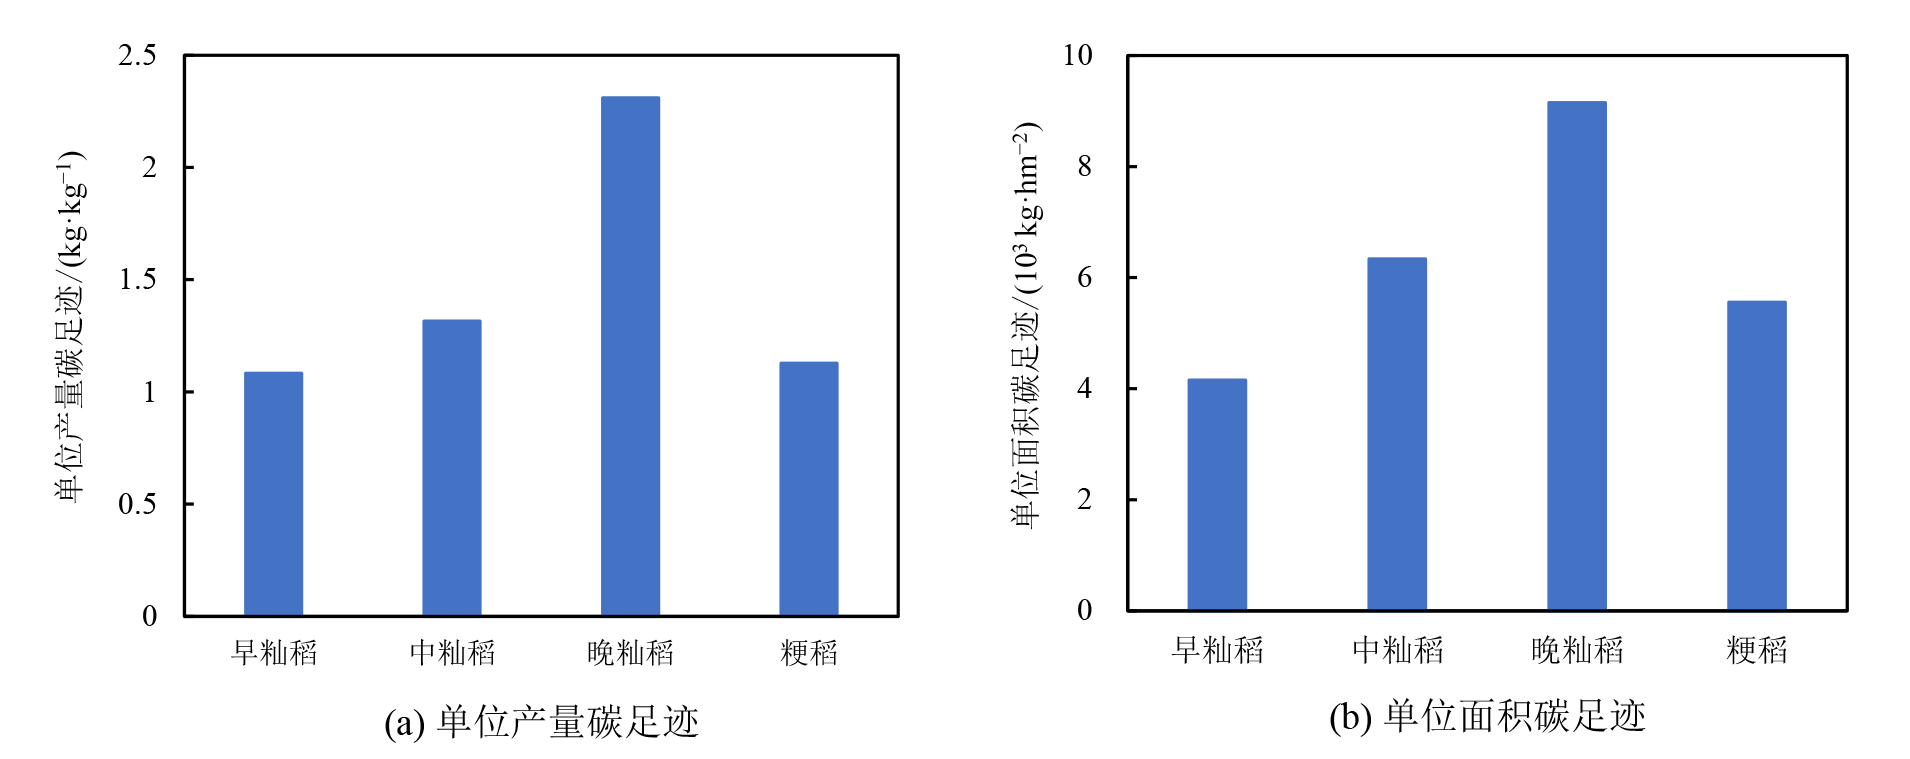
图3 全国各类水稻碳足迹
Figure 3 Carbon footprint of all kinds of rice in China
| 环节 | 方式 | 项目 | 数值 | 参考文献 |
|---|---|---|---|---|
| 水稻种植 | 稻谷水分含量/% | 14.5 | 国家发展和改革委员会, | |
| 灌溉/多次排水周期 | 水分管理方式的影响系数 (N/A) | 0.550 | International Rice Research Institute, | |
| 短时通气<1个月 | 稻田通气方式的影响系数 (N/A) | 1.00 | ||
| 短期<1个月: 晚籼稻 | 秸秆还田的尺度因子 (N/A) | 1.00 | ||
| 长期>1个月: 早籼稻、中籼稻、粳稻 | 0.190 | |||
| 农家肥 | 有机肥料修正的尺度因子 (N/A) | 0.210 | ||
| 收获和收获后 | 收获时的稻谷损失率 | 0.013 | International Rice Research Institute, | |
| 晒干 | 晒干过程的稻谷损失率 | 0.040 | ||
| 粮仓储存6个月 | 仓储过程的稻谷损失率 | 0.075 | ||
| 基础技术 (柴油或汽油)/白米 | 精制过程的稻谷损失率 | 0.080 | ||
| 基础技术 (柴油或汽油)/白米 | 副产品 (谷壳/米糠) 率 | 0.200/0.100 | ||
| 拖拉机 | 运输距离/km | 50.0 | ||
| 早籼稻 | 价格/(¥∙t-1) | 2480 | 国家发展和改革委员会, | |
| 中籼稻/晚籼稻 | 2580 | |||
| 粳稻 | 2620 |
表3 CF-Rice数据设置
Table 3 CF-Rice data Settings
| 环节 | 方式 | 项目 | 数值 | 参考文献 |
|---|---|---|---|---|
| 水稻种植 | 稻谷水分含量/% | 14.5 | 国家发展和改革委员会, | |
| 灌溉/多次排水周期 | 水分管理方式的影响系数 (N/A) | 0.550 | International Rice Research Institute, | |
| 短时通气<1个月 | 稻田通气方式的影响系数 (N/A) | 1.00 | ||
| 短期<1个月: 晚籼稻 | 秸秆还田的尺度因子 (N/A) | 1.00 | ||
| 长期>1个月: 早籼稻、中籼稻、粳稻 | 0.190 | |||
| 农家肥 | 有机肥料修正的尺度因子 (N/A) | 0.210 | ||
| 收获和收获后 | 收获时的稻谷损失率 | 0.013 | International Rice Research Institute, | |
| 晒干 | 晒干过程的稻谷损失率 | 0.040 | ||
| 粮仓储存6个月 | 仓储过程的稻谷损失率 | 0.075 | ||
| 基础技术 (柴油或汽油)/白米 | 精制过程的稻谷损失率 | 0.080 | ||
| 基础技术 (柴油或汽油)/白米 | 副产品 (谷壳/米糠) 率 | 0.200/0.100 | ||
| 拖拉机 | 运输距离/km | 50.0 | ||
| 早籼稻 | 价格/(¥∙t-1) | 2480 | 国家发展和改革委员会, | |
| 中籼稻/晚籼稻 | 2580 | |||
| 粳稻 | 2620 |
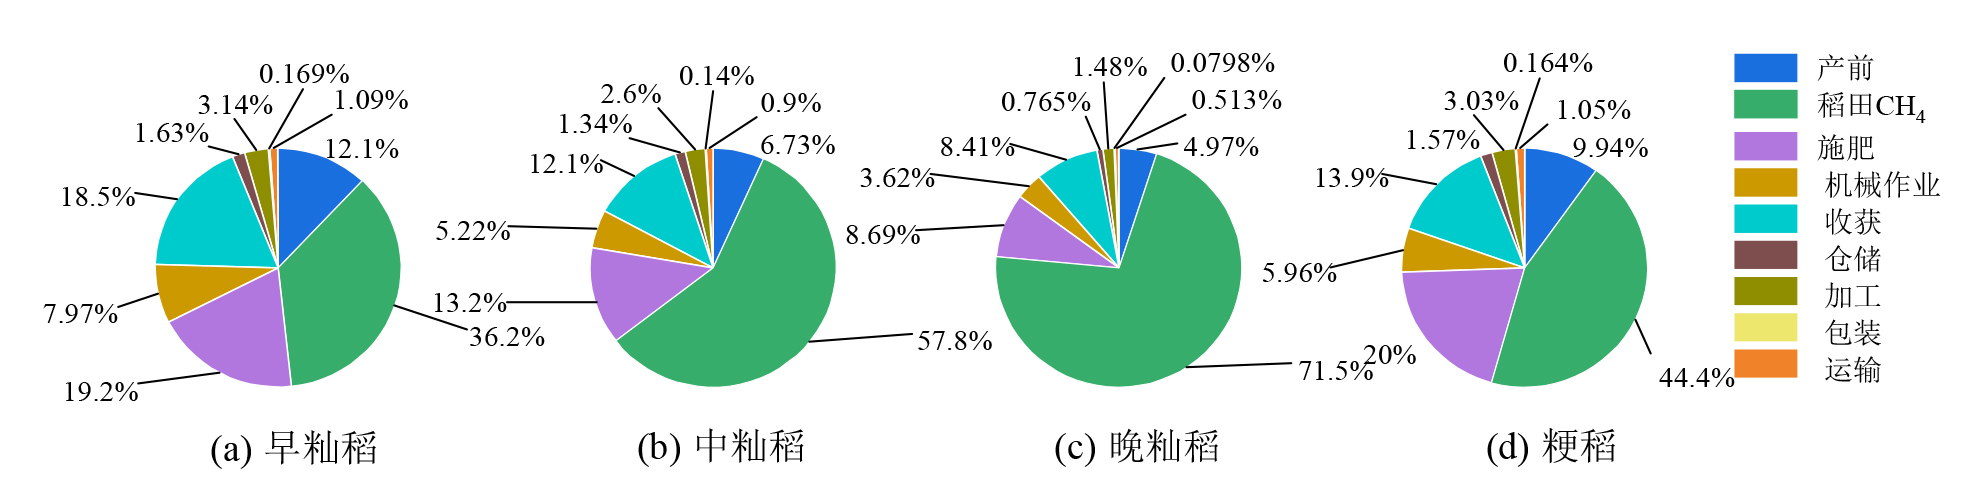
图4 全国各类水稻碳足迹结构组成
Figure 4 Carbon footprint structure of different kinds of rice in China
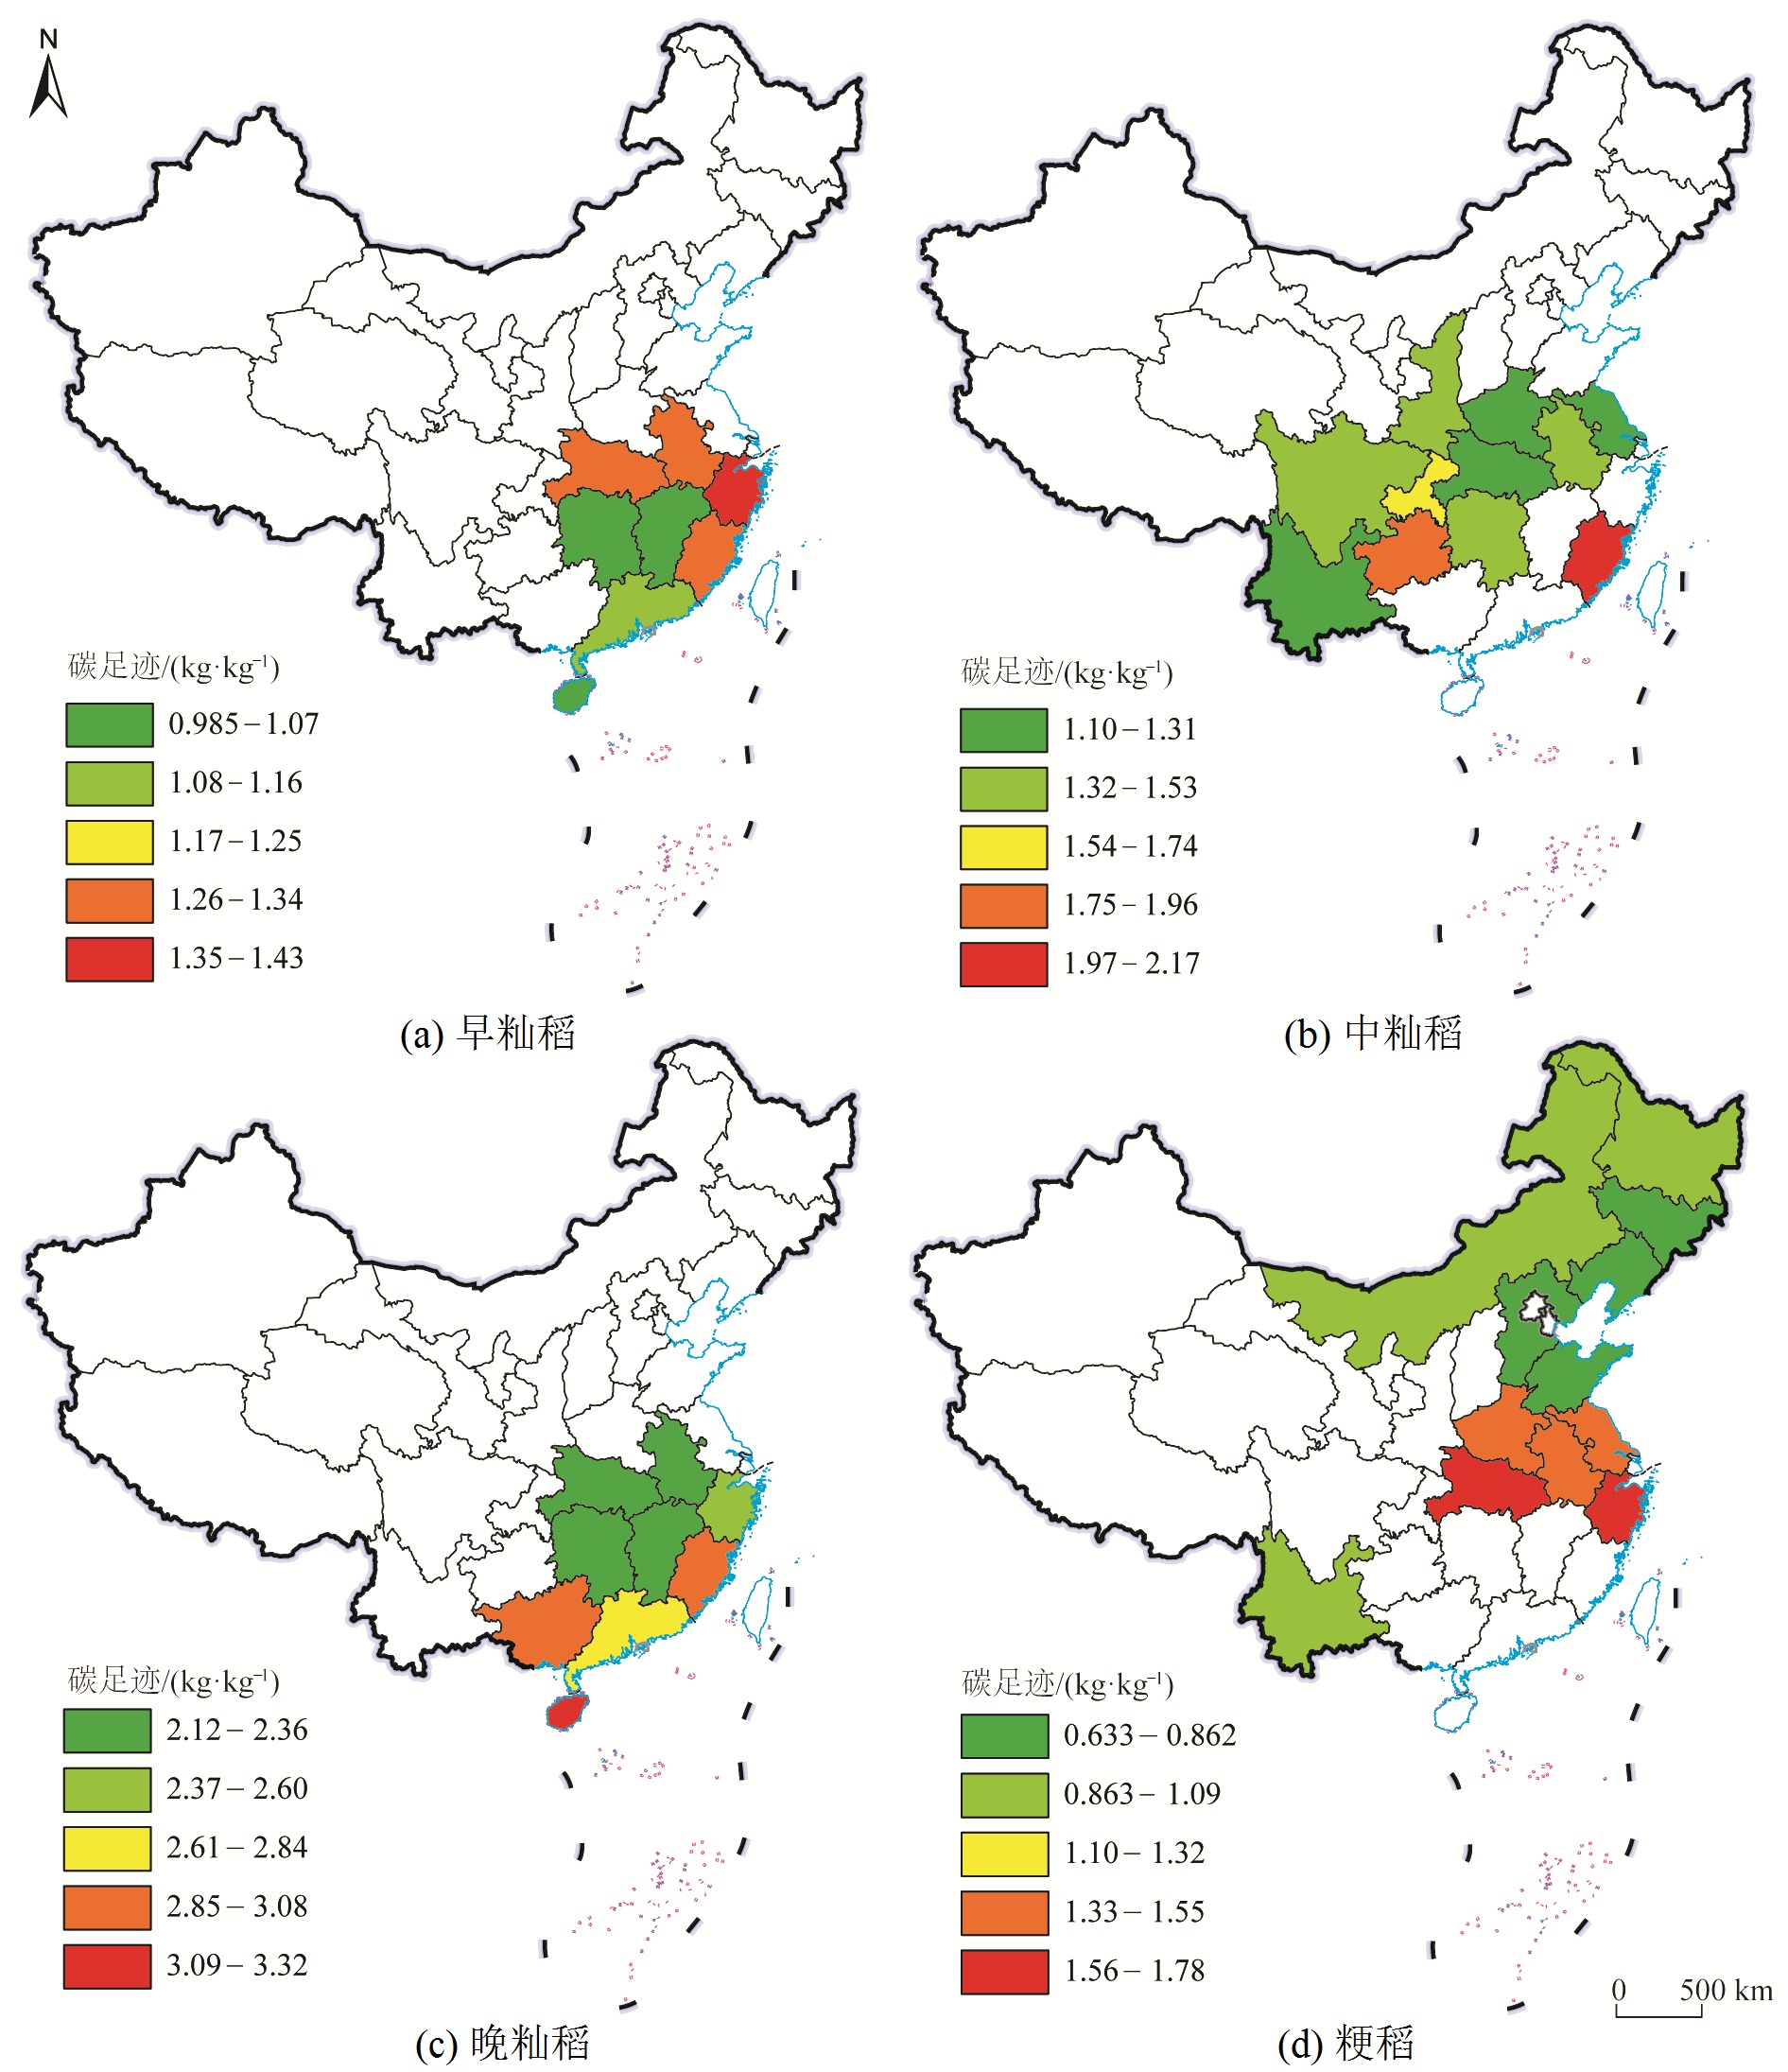
图5 全国水稻单位产量碳足迹空间分布图上图基于中华人民共和国自然资源部下载的审图号为GS(2023)2763号标准地图制作,底图无修改
Figure 5 Spatial distribution map of rice carbon footprint (per unit rice yield) in China
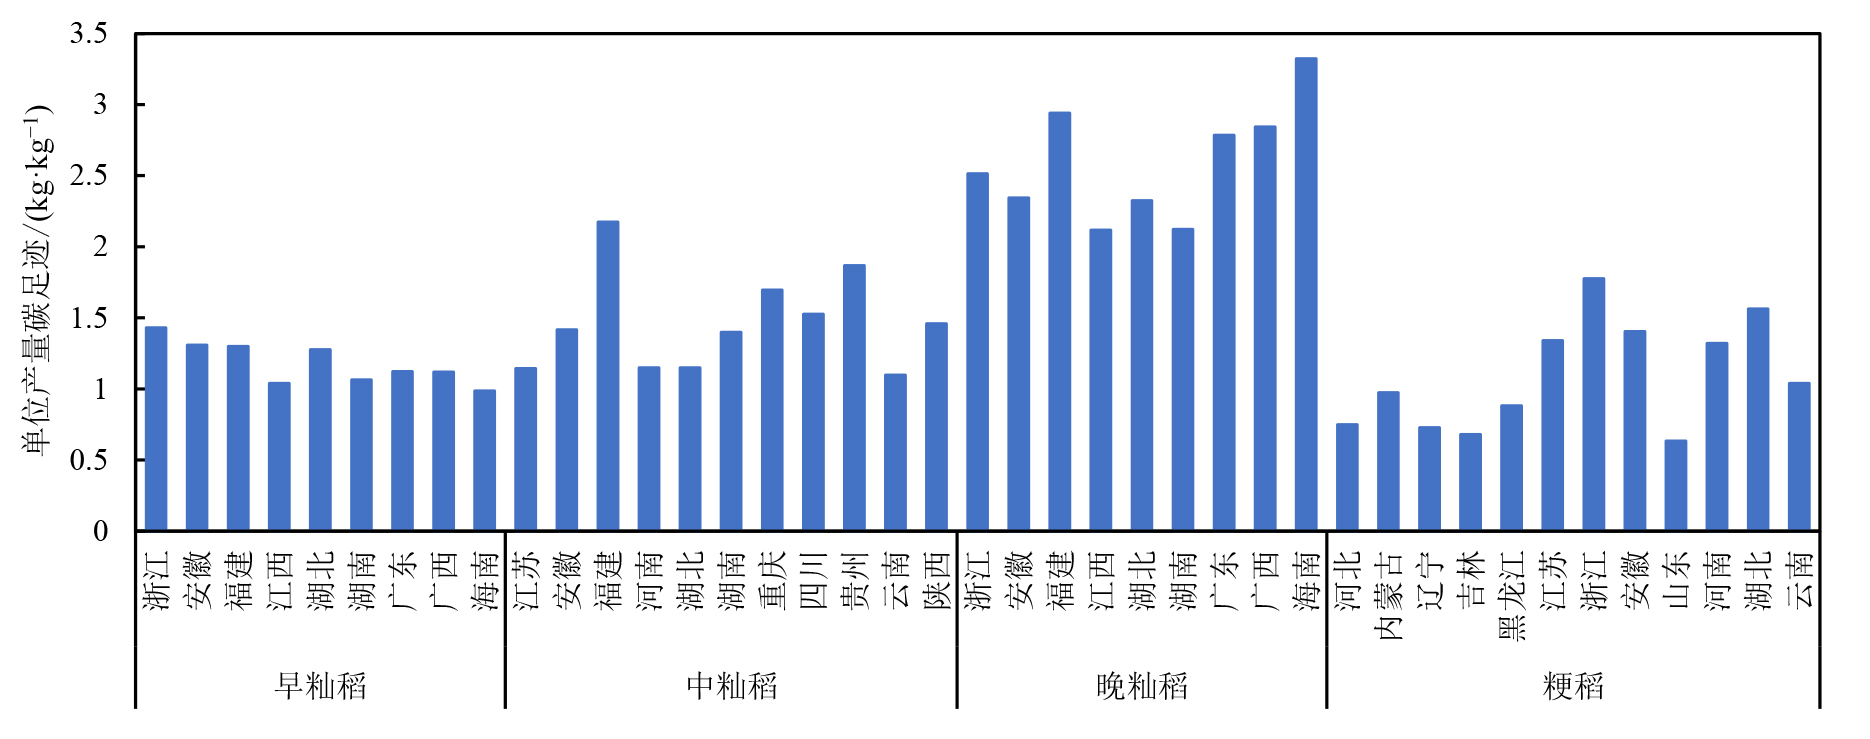
图6 各省水稻单位产量碳足迹
Figure 6 Carbon footprint per unit yield of rice in each province
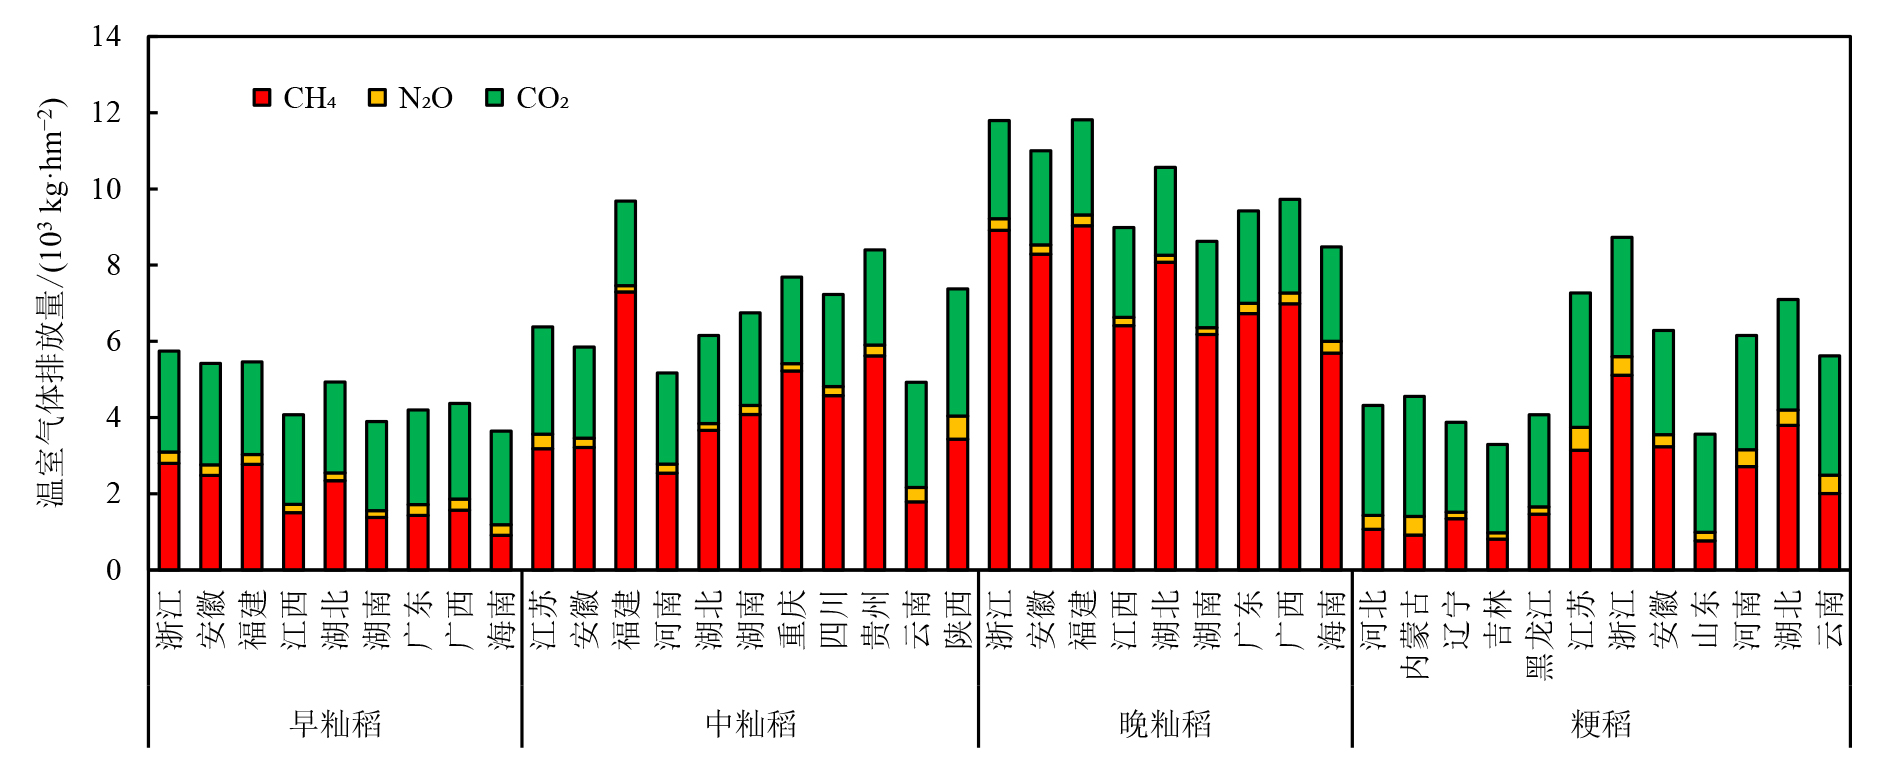
图7 各省碳足迹温室气体排放结构
Figure 7 Provincial greenhouse gas emission structure
| 变量 | 敏感性系数 | |||
|---|---|---|---|---|
| 早籼稻 | 中籼稻 | 晚籼稻 | 粳稻 | |
| 产量 | -0.895 | -0.905 | -0.925 | -0.897 |
| 生育期 | 0.363 | 0.575 | 0.720 | 0.443 |
| 种子用量 | 0.025 | 0.005 | 0.006 | 0.028 |
| 稻田CH4排放量 | 0.362 | 0.577 | 0.715 | 0.443 |
| 农家肥用量 | 0.017 | 0.034 | 0.015 | 0.022 |
| 氮肥用量 | 0.192 | 0.131 | 0.087 | 0.200 |
| 运输距离 | 0.011 | 0.009 | 0.005 | 0.011 |
| 稻米价格 | 0.078 | 0.075 | 0.075 | 0.074 |
表4 水稻碳足迹对食物系统不同参数的敏感性
Table 4 Sensitivity of rice carbon footprint to different steps in the food system
| 变量 | 敏感性系数 | |||
|---|---|---|---|---|
| 早籼稻 | 中籼稻 | 晚籼稻 | 粳稻 | |
| 产量 | -0.895 | -0.905 | -0.925 | -0.897 |
| 生育期 | 0.363 | 0.575 | 0.720 | 0.443 |
| 种子用量 | 0.025 | 0.005 | 0.006 | 0.028 |
| 稻田CH4排放量 | 0.362 | 0.577 | 0.715 | 0.443 |
| 农家肥用量 | 0.017 | 0.034 | 0.015 | 0.022 |
| 氮肥用量 | 0.192 | 0.131 | 0.087 | 0.200 |
| 运输距离 | 0.011 | 0.009 | 0.005 | 0.011 |
| 稻米价格 | 0.078 | 0.075 | 0.075 | 0.074 |
| 国家 | 单位面积碳足迹/(103 kg∙hm-2) | 单位产量碳足迹/(kg∙kg-1) | 稻田CH4排放占比/% | 施肥占比/% | 参考文献 |
|---|---|---|---|---|---|
| 意大利 | 2.90 | 68 | 9 | Blengini et al., | |
| 美国 | 1.47 | 69 | 19 | Brodt et al., | |
| 日本 | 1.46 | 75 | 7 | Hokazono et al., | |
| 泰国 | 4.92 | 0.93 | Arunrat et al., | ||
| 印度 | 2.44 | 0.23-2.06 | 60 | 29 | Nayak et al., |
| 中国 | 6.00±0.10 | 0.8±0.02 | Yan et al., | ||
| 4.87±0.42 | 0.51-0.75 | Fan et al., | |||
| 1.24 | Tian et al., | ||||
| 1.77 | Xia et al., | ||||
| 7.28±0.08 | 1.06±0.03 | Xu et al., | |||
| 6.30±1.82 | 1.46±0.50 | 53 | 15 | 本研究 |
表5 不同国家水稻食物系统碳足迹
Table 5 Carbon footprint of rice food systems in different countries
| 国家 | 单位面积碳足迹/(103 kg∙hm-2) | 单位产量碳足迹/(kg∙kg-1) | 稻田CH4排放占比/% | 施肥占比/% | 参考文献 |
|---|---|---|---|---|---|
| 意大利 | 2.90 | 68 | 9 | Blengini et al., | |
| 美国 | 1.47 | 69 | 19 | Brodt et al., | |
| 日本 | 1.46 | 75 | 7 | Hokazono et al., | |
| 泰国 | 4.92 | 0.93 | Arunrat et al., | ||
| 印度 | 2.44 | 0.23-2.06 | 60 | 29 | Nayak et al., |
| 中国 | 6.00±0.10 | 0.8±0.02 | Yan et al., | ||
| 4.87±0.42 | 0.51-0.75 | Fan et al., | |||
| 1.24 | Tian et al., | ||||
| 1.77 | Xia et al., | ||||
| 7.28±0.08 | 1.06±0.03 | Xu et al., | |||
| 6.30±1.82 | 1.46±0.50 | 53 | 15 | 本研究 |
| [1] |
ARDENTE F, BECCALI G, CELLURA M, et al., 2005. Life cycle assessment of a solar thermal collector: sensitivity analysis, energy and environmental balances[J]. Renewable Energy, 30(2): 109-130.
DOI URL |
| [2] |
ARUNRAT N, SEREENONCHAI S, CHAOWIWAT W, et al., 2022. Carbon, nitrogen and water footprints of organic rice and conventional rice production over 4 years of cultivation: a case study in the lower north of Thailand[J]. Agronomy, 12(2): 280.
DOI URL |
| [3] |
BLENGINI G A, BUSTO M, 2009. The life cycle of rice: LCA of alternative agri-food chain management systems in Vercelli (Italy)[J]. Journal of Environmental Management, 90(3): 1512-1522.
DOI PMID |
| [4] |
BRODT S, KENDALL A, MOHAMMADI Y, et al., 2014. Life cycle greenhouse gas emissions in California rice production[J]. Field Crops Research, 169: 89-98.
DOI URL |
| [5] |
BROWN M A, SOUTHWORTH F, SARZYNSKI A, 2009. The geography of metropolitan carbon footprints[J]. Policy and Society, 27(4): 285-304.
DOI URL |
| [6] | International Rice Research Institute, 2022. CF-Rice[EB/OL]. [2023-04-28]. https://ghgmitigation.irri.org/knowledge-products/mrv-toolbox/cf-rice. |
| [7] |
CHEN X P, CUI Z L, FAN M S, et al., 2014. Producing more grain with lower environmental costs[J]. Nature, 514(7523): 486-489.
DOI |
| [8] |
CHEN Z L, LI D B, SHAO K H, et al., 1993. Features of CH4emission from rice paddy fields in Beijing and Nanjing[J]. Chemosphere, 26(1-4): 239-245.
DOI URL |
| [9] |
CUCURACHI S, SCHERER L, GUINéE J, et al., 2019. Life cycle assessment of food systems[J]. One Earth, 1(3): 292-297.
DOI URL |
| [10] |
FAN J, GUO D, HAN L, et al., 2022. Spatiotemporal dynamics of carbon footprint of main crop production in China[J]. International Journal of Environmental Research and Public Health, 19(21): 13896.
DOI URL |
| [11] | FAO, 2011. Global Food Losses and Food Waste: Extent, Causes and Prevention[R/OL]. Rome[2023-04-28]. https://www.fao.org/3/mb060e/mb060e00.pdf. |
| [12] | FAO, 2013. Food Wastage Footprint: Impacts on Natural Resources—Summary Report.[R/OL]. Rome[2023-04-28]. https://www.fao.org/3/i3347e/i3347e.pdf. |
| [13] | US FDA, 2019. How to Cut Food Waste and Maintain Food Safety[R/OL]. [2023-04-28]. https://www.fda.gov/food/consumers/how-cut-food-waste-and-maintain-food-safety. |
| [14] |
GIURCO D, PETRIE J G, 2007. Strategies for reducing the carbon footprint of copper: New technologies, more recycling or demand management?[J]. Minerals Engineering, 20(9): 842-853.
DOI URL |
| [15] |
HOKAZONO S, HAYASHI K, 2012. Variability in environmental impacts during conversion from conventional to organic farming: a comparison among three rice production systems in Japan[J]. Journal of Cleaner Production, 28: 101-112.
DOI URL |
| [16] |
HOU H J, PENG S Z, XU J Z, et al., 2012. Seasonal variations of CH4 and N2O emissions in response to water management of paddy fields located in southeast China[J]. Chemosphere, 89(7): 884-892.
DOI URL |
| [17] |
HUANG Y, TANG Y H, 2010. An estimate of greenhouse gas (N2O and CO2) mitigation potential under various scenarios of nitrogen use efficiency in Chinese croplands[J]. Global Change Biology, 16(11): 2958-2970.
DOI URL |
| [18] | IPCC, 2013. Climate Change 2013: The Physical Science Basis.[R/OL]. Cambridge University Press[2023-04-28].https://www.ipcc.ch/report/ar5/wg1/. |
| [19] |
JIANG Z H, ZHONG Y M, YANG J P, et al., 2019. Effect of nitrogen fertilizer rates on carbon footprint and ecosystem service of carbon sequestration in rice production[J]. Science of The Total Environment, 670: 210-217.
DOI URL |
| [20] |
LI Y P, WU W, YANG J X, et al., 2022. Exploring the environmental impact of crop production in China using a comprehensive footprint approach[J]. Science of The Total Environment, 824: 153898.
DOI URL |
| [21] |
MINX J C, LAMB W F, ANDREW R M, et al., 2021. A comprehensive and synthetic dataset for global, regional, and national greenhouse gas emissions by sector 1970-2018 with an extension to 2019[J]. Earth System Science Data, 13(11): 5213-5252.
DOI URL |
| [22] |
NAYAK A K, TRIPATHI R, DEBNATH M, et al., 2022. Carbon and water footprint of rice, wheat & maize crop productions in India[J]. Pedosphere, 33(3): 448-462.
DOI URL |
| [23] |
QIN X, LI Y E, WANG H, et al., 2016. Long-term effect of biochar application on yield-scaled greenhouse gas emissions in a rice paddy cropping system: A four-year case study in south China[J]. Science of The Total Environment, 569-570: 1390-1401.
DOI URL |
| [24] | QIN X, LU Y, WAN Y, et al., 2023. Rice straw application improves yield marginally and increases carbon footprint of double cropping paddy rice (Oryza sativa L.)[J]. Field Crops Research, 291: 1-10. |
| [25] | TIAN P P, LI D, LU H W, et al., 2021. Trends, distribution, and impact factors of carbon footprints of main grains production in China[J]. Journal of Cleaner Production, 278(Part 1): 1-9. |
| [26] |
TUBIELLO F N, KARL K, FLAMMINI A, et al., 2022. Pre- and post-production processes increasingly dominate greenhouse gas emissions from agri-food systems[J]. Earth System Science Data, 14(4): 1795-1809.
DOI URL |
| [27] | VAN HUNG N, MIGO M V, QUILLOY R, et al., 2020. Life cycle assessment applied in rice production and residue management[M]. Sustainable Rice Straw Management, Chapter 10: 161-174. |
| [28] |
WASSMANN R, VAN-HUNG N, YEN B T, et al., 2021. Carbon footprint calculator customized for rice products: concept and characterization of rice value chains in Southeast Asia[J]. Sustainability, 14(1): 315.
DOI URL |
| [29] |
XIA L L, TI C P, LI B L, et al., 2016. Greenhouse gas emissions and reactive nitrogen releases during the life-cycles of staple food production in China and their mitigation potential[J]. Science of The Total Environment, 556: 116-125.
DOI URL |
| [30] |
XU X M, LAN Y, 2017. Spatial and temporal patterns of carbon footprints of grain crops in China[J]. Journal of Cleaner Production, 146: 218-227.
DOI URL |
| [31] |
XUE L, LIU X J, LU S J, et al., 2021. China’s food loss and waste embodies increasing environmental impacts[J]. Nature Food, 2(7): 519-528.
DOI |
| [32] |
YAN M, CHENG K, LUO T, et al., 2015a. Carbon footprint of grain crop production in China - based on farm survey data[J]. Journal of Cleaner Production, 104: 130-138.
DOI URL |
| [33] |
YAN M, LUO T, BIAN R J, et al., 2015b. A comparative study on carbon footprint of rice production between household and aggregated farms from Jiangxi, China[J]. Environmental Monitoring and Assessment, 187(6): 332.
DOI URL |
| [34] | YAN X, AKIYAMA H, YAGI K, et al., 2009. Global estimations of the inventory and mitigation potential of methane emissions from rice cultivation conducted using the 2006 Intergovernmental Panel on Climate Change Guidelines[J]. Global Biogeochemical Cycles, 23(2): 1-15. |
| [35] |
ZHANG D, SHEN J B, ZHANG F S, et al., 2017. Carbon footprint of grain production in China[J]. Scientific Reports, 7(1): 4126.
DOI PMID |
| [36] |
ZHANG W, YU Y Q, LI T T, et al., 2014. Net greenhouse gas balance in China's croplands over the last three decades and its mitigation potential[J]. Environmental Science & Technology, 48(5): 2589-2597.
DOI URL |
| [37] | 曹黎明, 李茂柏, 王新其, 等, 2014. 基于生命周期评价的上海市水稻生产的碳足迹[J]. 生态学报, 34(2): 491-499. |
| CAO L M, LI M B, WANG X Q, et al., 2014. Life cycle assessment of carbon footprint for rice production in Shanghai[J]. Acta Ecologica Sinica, 34(2): 491-499. | |
| [38] | 耿雷跃, 张薇, 邹拓, 等, 2018. 河北水稻地方种质品质多样性分析[J]. 作物杂志 (1): 49-55. |
| GENG L Y, ZHANG W, ZOU T, et al., 2018. Analysis on quality traits diversity of rice landraces in Hebei[J]. Crops (1): 49-55. | |
| [39] | 国家发展和改革委员会, 2011. 省级温室气体清单编制指南 (试行)[R/OL]. 北京[2023-04-28].http://www.gxdtrc.cn/h-nd-217.html. |
| National Development and Reform Commission, 2011. Guidelines for the preparation of provincial GHG inventories (trial)[R/OL]. Beijing, [2023-04-28].http://www.gxdtrc.cn/h-nd-217.html. | |
| [40] | 国家发展和改革委员会, 2018. 国家公布2018年稻谷最低收购价格[EB/OL]. [2023-04-28].https://www.ndrc.gov.cn/fggz/jgbg/ywgz/201802/t20180222_1207610.html. |
| National Development and Reform Commission, 2018. The State announces the minimum purchase price of rice in 2018[EB/OL]. [2023-04-28].https://www.ndrc.gov.cn/fggz/jgbg/ywgz/201802/t20180222_1207610.html. | |
| [41] | 国家发展和改革委员会价格司, 2019. 全国农产品成本收益资料汇编[M]. 北京: 中国统计出版社:9-20. |
| Department of Price, National Development and Reform Commission, 2019. Compilation of cost-benefit data of national agricultural products[M]. Beijing: China Statistics Press:9-20. | |
| [42] | 国家统计局, 2019. 中国统计年鉴[M]. 北京: 中国统计出版社:385-391. |
| National Bureau of Statistics, 2019. China Statistical Yearbook[M]. Beijing: China Statistics Press:385-391. | |
| [43] | 国务院, 2021. 中华人民共和国国民经济和社会发展第十四个五年规划和2035年远景目标纲要[R/OL]. [2023-04-28].http://www.gov.cn/xinwen/2021-03/13/content_5592681.htm. |
| State Council, 2021. The 14th Five-Year Plan for National Economic and Social Development of the People's Republic of China and the Outline of Long-term Goals to 2035.[2023-04-28].http://www.gov.cn/xinwen/2021-03/13/content_5592681.htm. | |
| [44] | 韩薇薇, 2017. 生命周期理论视角下的食品碳足迹分析及其应用研究进展——以国外主要肉类食品为例[J]. 食品工业科技, 38(15): 329-334. |
| HAN W W, 2017. Study on carbon footprint analysis of meat products and its application development from the perspective of life cycle theory[J]. Science and Technology of Food Industry, 38(15): 329-334. | |
| [45] | 黄文秀, 2012. 国外产品碳足迹评价的发展[J]. 创新科技 (5): 12-13. |
| HUANG W X, 2012. Development of carbon footprint evaluation of foreign products[J]. Innovation Science and Technology (5): 12-13. | |
| [46] | 蒋聪, 段玉云, 杨旭昆, 等, 2020. 云南省高原粳稻主要农艺性状与产量的多重分析[J]. 江苏农业科学, 48(21): 74-83. |
| JIANG C, DUAN Y Y, YANG X K, et al., 2020. Multiple analysis of main agronomic characters and yield of japonica rice in Yunnan Plateau[J]. Jiangsu Agricultural Sciences, 48(21): 74-83. | |
| [47] | 刘翠萍, 伍雪媚, 2021. 水稻秸秆还田对水稻经济性状及产量的影响[J]. 农业技术与装备 (9): 89-90. |
| LIU C P, WU X M, 2021. Effect of rice straw returning to field on economic characters and yield of rice[J]. Agricultural Technology & Equipment (9): 89-90. | |
| [48] | 刘海静, 李璐, 孙少华, 等, 2021. 2020年河南省优质水稻新品种展示报告[J]. 中国种业 (8): 75-78. |
| LIU H J, LI L, SUN S H, et al., 2021. Report on the exhibition of new varieties of high-quality rice in Henan Province in 2020[J]. China Seed Industry (8): 75-78. | |
| [49] | 秦晓波, 李玉娥, HONG W, 等, 2015. 生物质炭添加对华南双季稻田碳排放强度的影响[J]. 农业工程学报, 31(5): 226-234. |
| QIN X B, LI Y E, HONG W, et al., 2015. Impact of biochar amendment on carbon emissions intensity in double rice field in south China[J]. Transactions of the Chinese Society of Agricultural Engineering (Transactions of the CSAE), 31(5): 226-234. | |
| [50] | 秦晓波, 李玉娥, 万运帆, 等, 2014. 耕作方式和稻草还田对双季稻田CH4和N2O排放的影响[J]. 农业工程学报, 30(11): 216-224. |
| QIN X B, LI Y E, WAN Y F, et al., 2014. Effect of tillage and rice residue return on CH4 and N2O emission from double rice field[J]. Transactions of the Chinese Society of Agricultural Engineering (Transactions of the CSAE), 30(11): 216-224. | |
| [51] | 秦晓波, 李玉娥, 万运帆, 等, 2012. 免耕条件下稻草还田方式对温室气体排放强度的影响[J]. 农业工程学报, 28(6): 210-216. |
| QIN X B, LI Y E, WAN Y F, et al., 2012. Effects of straw mulching on greenhouse gas intensity under on-tillage conditions[J]. Transactions of the Chinese Society of Agricultural Engineering (Transactions of the CSAE), 28(6): 210-216. | |
| [52] |
王兴, 赵鑫, 王钰乔, 等, 2017. 中国水稻生产的碳足迹分析[J]. 资源科学, 39(4): 713-722.
DOI |
|
WANG X, ZHAO X, WANG Y Q, et al., 2017. Assessment of the carbon footprint of rice production in China[J]. Resources Science, 39(4): 713-722.
DOI |
|
| [53] | 吴修, 杨连群, 陈峰, 等, 2013. 山东省水稻生产现状及发展对策[J]. 山东农业科学, 45(5): 119-125. |
| WU X, YANG L Q, CHEN F, et al., 2013. Current situation and development countermeasures of rice production in Shandong Province[J]. Shandong Agricultural Sciences, 45(5): 119-125. | |
| [54] | 杨仕华, 程本义, 2003. 2002年南方稻区——国家水稻品种区试优良品种介绍[J]. 中国稻米 (6): 21-25. |
| YANG S H, CHENG B Y, 2003. Introduction of excellent varieties of national rice variety test in southern rice region in 2002[J]. China Rice (6): 21-25. | |
| [55] |
殷敏, 刘少文, 褚光, 等, 2020. 长江下游稻区不同类型双季晚粳稻产量与生育特性差异[J]. 中国农业科学, 53(5): 890-903.
DOI |
|
YIN M, LIU S W, ZHU G, et al., 2020. Differences in yield and growth traits of different japonica varieties in the double cropping late season in the lower reaches of the Yangtze River[J]. Scientia Agricultura Sinica, 53(5): 890-903.
DOI |
|
| [56] | 张向阳, 张玉梅, 冯晓龙, 等, 2022. 中国农业食物系统能源碳排放趋势分析[J]. 中国生态农业学报 (中英文), 30(4): 535-542. |
| ZHANG X Y, ZHANG Y M, FENG X L, et al., 2022. Carbon emissions of agrifood systems from energy consumption in China[J]. Chinese Journal of Eco-Agriculture, 30(4): 535-542. | |
| [57] | 张艳梅, 王敬国, 刘化龙, 等, 2012. 东北粳稻不同生育期耐冷性分析[J]. 东北农业大学学报, 43(4): 43-49. |
| ZHANG Y M, WANG J G, LIU H L, et al., 2012. Analysis of japonica rice cold tolerance at different growing periods in northeast area[J]. Journal of Northeast Agricultural University, 43(4): 43-49. | |
| [58] | 张志伟, 秦晓波, 樊建凌, 等, 2022. 干湿交替灌溉模式在湖南稻区适用性及其甲烷减排潜力评估[J]. 农业工程学报, 38(S1): 232-239. |
| ZHANG Z W, QIN X B, FAN J L, et al., 2022. Applicability and abatement potential assessment of alternate wet and dry CH4 mitigation technology in major rice cropping regions in Hunan Province of China[J]. Transactions of the Chinese Society of Agricultural Engineering (Transactions of the CSAE), 38(S1): 232-239. |
| [1] | 张露, 何雨霏, 陈坦, 杨婷, 张冰, 金军. 2011—2020年汾渭平原农田生态系统碳足迹的时空格局演变[J]. 生态环境学报, 2023, 32(6): 1149-1162. |
| [2] | 姜超强, 李晨, 朱启法, 徐海清, 刘炎红, 沈嘉, 阎轶峰, 余飞, 祖朝龙. 皖南不同种植模式碳汇效应及经济效益评价[J]. 生态环境学报, 2022, 31(7): 1285-1292. |
| [3] | 郝小雨, 王晓军, 高洪生, 毛明艳, 孙磊, 马星竹, 周宝库, 迟凤琴, 李伟群. 松嫩平原不同秸秆还田方式下农田温室气体排放及碳足迹估算[J]. 生态环境学报, 2022, 31(2): 318-325. |
| 阅读次数 | ||||||
|
全文 |
|
|||||
|
摘要 |
|
|||||