生态环境学报 ›› 2023, Vol. 32 ›› Issue (2): 351-360.DOI: 10.16258/j.cnki.1674-5906.2023.02.015
雷社平1( ), 樊艳翔1,*(), 解建仓2
收稿日期:2022-11-25
出版日期:2023-02-18
发布日期:2023-05-11
通讯作者:
*樊艳翔(1999年生),男(傈僳族),硕士研究生,研究方向为环境资源与经济、环境科学。E-mail: 2848323256@qq.com作者简介:雷社平(1963年生),男,副教授,博士,硕士研究生导师,研究方向为环境资源与经济、环境科学。E-mail: leimansh@163.com
基金资助:
LEI ShePing1(), FAN YanXiang1,*(), XIE JianCang2
Received:2022-11-25
Online:2023-02-18
Published:2023-05-11
摘要:
黄土高原地处中国干旱与半干旱地区,水资源稀缺、生态脆弱。随着城市工业的不断发展,其面临着工业发展与水资源消耗、污水排放等多层矛盾,深入探究黄土高原城市工业发展与污水排放的关系以及污水排放的驱动效应具有研究意义。以陕西省为研究对象,使用Tapio脱钩模型对其10个地级市的工业污水排放脱钩状态进行测算分析,并进一步使用LMDI模型对其工业污水排放的驱动效应进行分解。研究发现,(1)各地工业污水排放变化存在一定的差异。2011-2014年除西安、咸阳、宝鸡、汉中出现下降趋势以外,其他地区均呈现增长趋势,而渭南增速最快为79.71%,其次是商洛、安康、榆林、铜川、延安。2014-2017年除榆林以外,其余各地区均是下降态势,且榆林在该时间段增速最快,达118.89%。2017-2020年,除咸阳、铜川呈现增长趋势以外,其余各地区均为负增长,但相对而言铜川地区增速不大,为1.45%;咸阳增速较大,为162.43%。(2)陕南工业发展与污水排放的脱钩状态总体较为理想,关中地区西安市脱钩状态较理想,其余各地区仍有较大的改进空间;陕北地区两市总体而言,脱钩状态不理想,工业发展模式以低效扩张与粗放扩张为主;近年来铜川、咸阳、延安、榆林等4个地区出现向非理想化负脱钩状态演变的情况。(3)陕西省污水排放驱动效应可分解为工业用水结构强度效应、工业用水强度效应、工业规模效应与人口规模效应4个效应。而总体来看,从地区与时间两个维度对工业污水排放的驱动效应进行分解的测算结果基本一致。
中图分类号:
雷社平, 樊艳翔, 解建仓. 黄土高原城市工业污水排放脱钩分析及驱动效应分解--以陕西省为例[J]. 生态环境学报, 2023, 32(2): 351-360.
LEI ShePing, FAN YanXiang, XIE JianCang. Analysis of Urban Industrial Sewage Discharge Decoupling and Driving Effect Decomposition on the Loess Plateau: A Case Study of Shaanxi Province[J]. Ecology and Environment, 2023, 32(2): 351-360.
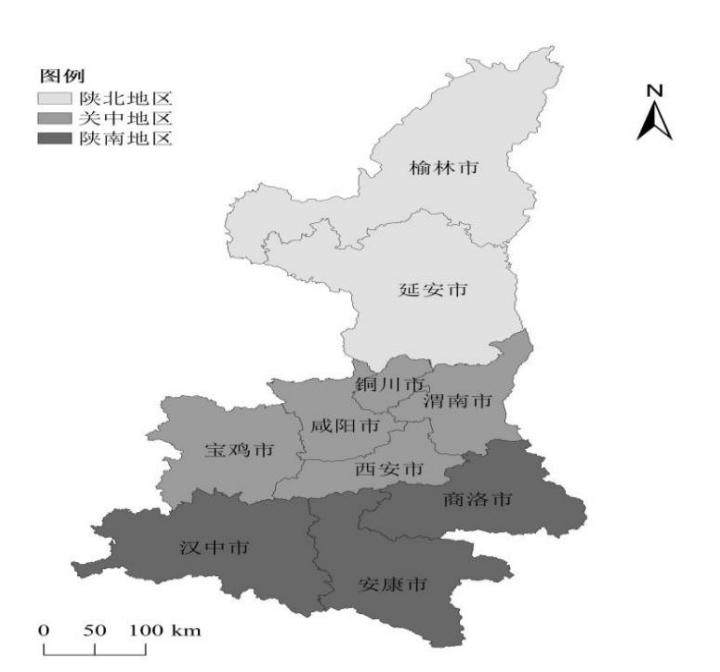
图1 研究区域图
Figure 1 Study area map
| 脱钩状态 | ΔW | ΔE | Q | 发展模式 | 集约程度 |
|---|---|---|---|---|---|
| 强脱钩 | - | + | <0 | 挖潜发展型 | 最集约 |
| 弱脱钩 | + | + | 0≤Q<0.8 | 集约扩张型 | 较集约 |
| 扩张连结 | + | + | 0.8≤Q≤1.2 | 低效扩张型 | 较粗放 |
| 扩张负脱钩 | + | + | >1.2 | ||
| 弱脱钩 | + | + | 0≤Q<0.8 | 发展迟滞型 | 特殊型 |
| 衰退脱钩 | - | - | >1.2 | ||
| 衰退连结 | - | - | 0.8≤Q≤1.2 | ||
| 弱负脱钩 | - | - | 0≤Q<0.8 | ||
| 强负脱钩 | + | - | <0 | 粗放扩张型 | 最粗放 |
表1 脱钩状态评价
Table 1 Decoupling status evaluation table
| 脱钩状态 | ΔW | ΔE | Q | 发展模式 | 集约程度 |
|---|---|---|---|---|---|
| 强脱钩 | - | + | <0 | 挖潜发展型 | 最集约 |
| 弱脱钩 | + | + | 0≤Q<0.8 | 集约扩张型 | 较集约 |
| 扩张连结 | + | + | 0.8≤Q≤1.2 | 低效扩张型 | 较粗放 |
| 扩张负脱钩 | + | + | >1.2 | ||
| 弱脱钩 | + | + | 0≤Q<0.8 | 发展迟滞型 | 特殊型 |
| 衰退脱钩 | - | - | >1.2 | ||
| 衰退连结 | - | - | 0.8≤Q≤1.2 | ||
| 弱负脱钩 | - | - | 0≤Q<0.8 | ||
| 强负脱钩 | + | - | <0 | 粗放扩张型 | 最粗放 |
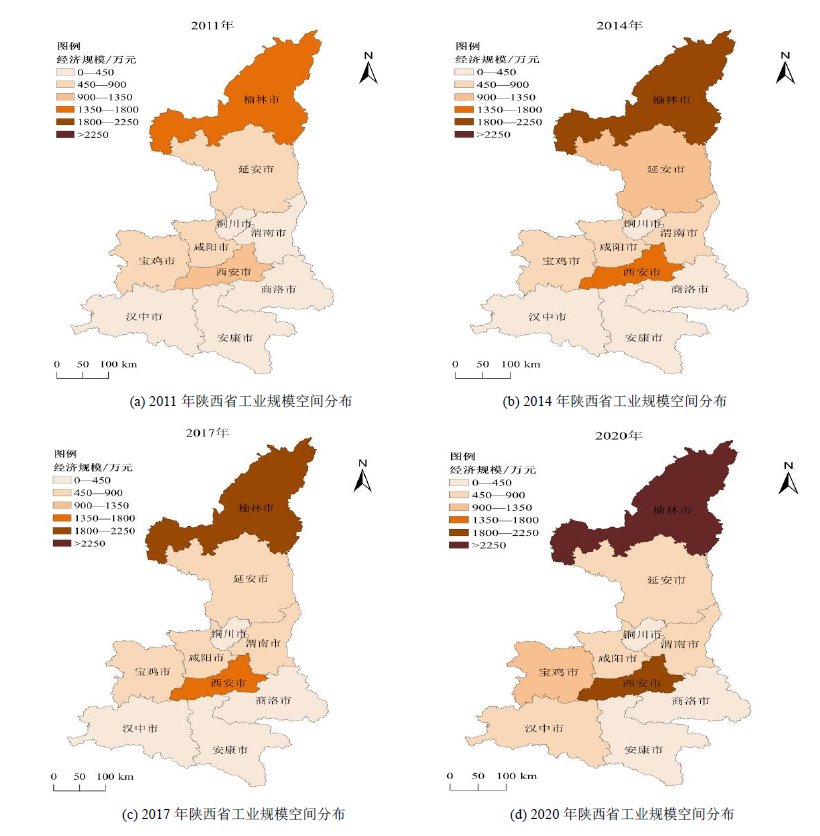
图2 陕西省工业规模时空演进图
Figure 2 Spatiotemporal evolution of industrial scale in Shaanxi Province
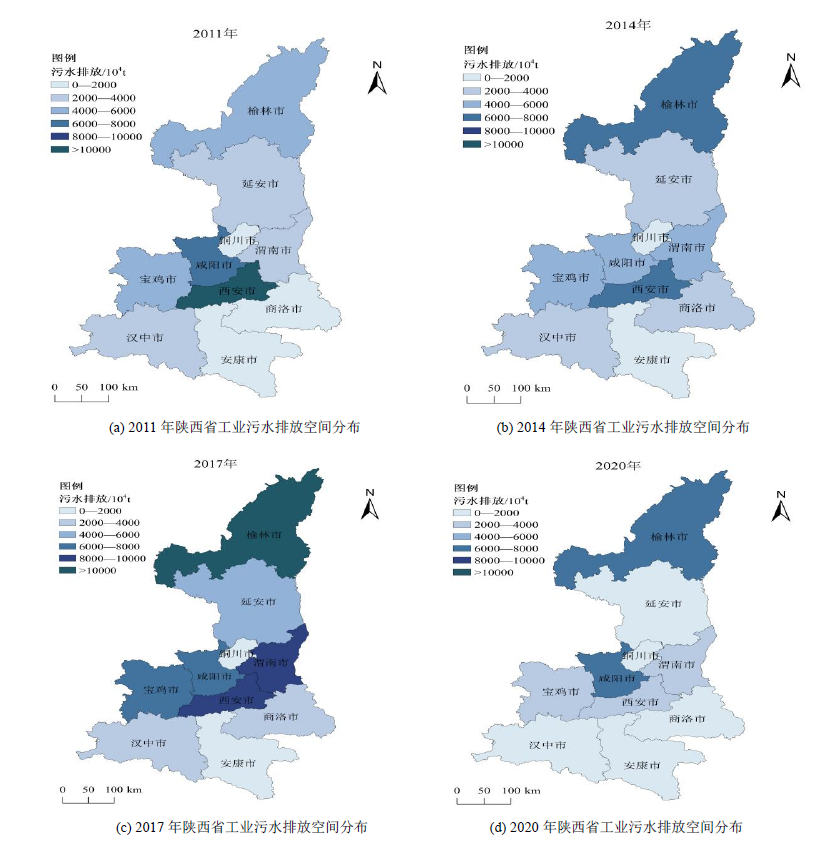
图3 陕西省工业污水排放时空演进图
Figure 3 Temporal and spatial evolution of industrial sewage discharge in Shaanxi Province
| 地区 | 年份 | ||||||||
|---|---|---|---|---|---|---|---|---|---|
| 2011-2012 | 2012-2013 | 2013-2014 | 2014-2015 | 2015-2016 | 2016-2017 | 2017-2018 | 2018-2019 | 2019-2020 | |
| 西安市 | 强脱钩 | 强脱钩 | 强脱钩 | 衰退脱钩 | 强脱钩 | 弱脱钩 | 强脱钩 | 强脱钩 | 强脱钩 |
| 铜川市 | 扩张负脱钩 | 强脱钩 | 衰退连结 | 弱负脱钩 | 衰退连结 | 强脱钩 | 扩张负脱钩 | 扩张负脱钩 | 强负脱钩 |
| 宝鸡市 | 弱脱钩 | 强脱钩 | 扩张连结 | 扩张负脱钩 | 强脱钩 | 强脱钩 | 强脱钩 | 扩张负脱钩 | 强负脱钩 |
| 咸阳市 | 强脱钩 | 强脱钩 | 强脱钩 | 扩张负脱钩 | 强脱钩 | 衰退脱钩 | 扩张负脱钩 | 强负脱钩 | 强负脱钩 |
| 渭南市 | 弱脱钩 | 扩张负脱钩 | 扩张负脱钩 | 强负脱钩 | 衰退脱钩 | 强脱钩 | 弱脱钩 | 强脱钩 | 衰退脱钩 |
| 延安市 | 扩张负脱钩 | 强脱钩 | 强脱钩 | 强负脱钩 | 强负脱钩 | 强脱钩 | 强脱钩 | 扩张负脱钩 | 强负脱钩 |
| 汉中市 | 强脱钩 | 弱脱钩 | 弱脱钩 | 衰退脱钩 | 强脱钩 | 强脱钩 | 强脱钩 | 强脱钩 | 衰退脱钩 |
| 榆林市 | 强脱钩 | 扩张负脱钩 | 扩张负脱钩 | 强负脱钩 | 强脱钩 | 扩张负脱钩 | 强脱钩 | 扩张负脱钩 | 强负脱钩 |
| 安康市 | 弱脱钩 | 弱脱钩 | 弱脱钩 | 弱脱钩 | 强脱钩 | 强脱钩 | 弱脱钩 | 强脱钩 | 衰退脱钩 |
| 商洛市 | 扩张连结 | 弱脱钩 | 扩张连结 | 强脱钩 | 强脱钩 | 强脱钩 | 扩张连结 | 强脱钩 | 衰退脱钩 |
表2 陕西省工业发展与污水排放的脱钩关系评价
Table 2 Evaluation table of decoupling relationship between industrial development and sewage discharge in Shaanxi Province
| 地区 | 年份 | ||||||||
|---|---|---|---|---|---|---|---|---|---|
| 2011-2012 | 2012-2013 | 2013-2014 | 2014-2015 | 2015-2016 | 2016-2017 | 2017-2018 | 2018-2019 | 2019-2020 | |
| 西安市 | 强脱钩 | 强脱钩 | 强脱钩 | 衰退脱钩 | 强脱钩 | 弱脱钩 | 强脱钩 | 强脱钩 | 强脱钩 |
| 铜川市 | 扩张负脱钩 | 强脱钩 | 衰退连结 | 弱负脱钩 | 衰退连结 | 强脱钩 | 扩张负脱钩 | 扩张负脱钩 | 强负脱钩 |
| 宝鸡市 | 弱脱钩 | 强脱钩 | 扩张连结 | 扩张负脱钩 | 强脱钩 | 强脱钩 | 强脱钩 | 扩张负脱钩 | 强负脱钩 |
| 咸阳市 | 强脱钩 | 强脱钩 | 强脱钩 | 扩张负脱钩 | 强脱钩 | 衰退脱钩 | 扩张负脱钩 | 强负脱钩 | 强负脱钩 |
| 渭南市 | 弱脱钩 | 扩张负脱钩 | 扩张负脱钩 | 强负脱钩 | 衰退脱钩 | 强脱钩 | 弱脱钩 | 强脱钩 | 衰退脱钩 |
| 延安市 | 扩张负脱钩 | 强脱钩 | 强脱钩 | 强负脱钩 | 强负脱钩 | 强脱钩 | 强脱钩 | 扩张负脱钩 | 强负脱钩 |
| 汉中市 | 强脱钩 | 弱脱钩 | 弱脱钩 | 衰退脱钩 | 强脱钩 | 强脱钩 | 强脱钩 | 强脱钩 | 衰退脱钩 |
| 榆林市 | 强脱钩 | 扩张负脱钩 | 扩张负脱钩 | 强负脱钩 | 强脱钩 | 扩张负脱钩 | 强脱钩 | 扩张负脱钩 | 强负脱钩 |
| 安康市 | 弱脱钩 | 弱脱钩 | 弱脱钩 | 弱脱钩 | 强脱钩 | 强脱钩 | 弱脱钩 | 强脱钩 | 衰退脱钩 |
| 商洛市 | 扩张连结 | 弱脱钩 | 扩张连结 | 强脱钩 | 强脱钩 | 强脱钩 | 扩张连结 | 强脱钩 | 衰退脱钩 |
| 地区 | 效应类型 | |||
|---|---|---|---|---|
| 工业用水结构强度效应 | 工业用水强度效应 | 工业规模 效应 | 人口规模效应 | |
| 西安市 | 104.572 | 251.449 | -93.896 | 20.167 |
| 铜川市 | -21.995 | 32.602 | -15.657 | 21.141 |
| 宝鸡市 | -349.087 | 576.982 | -24.809 | -2.910 |
| 咸阳市 | 41.227 | 362.573 | -63.621 | 32.582 |
| 渭南市 | -585.932 | 743.515 | -24.140 | 68.332 |
| 延安市 | 292.400 | -24.521 | -139.632 | 55.659 |
| 汉中市 | -285.265 | 539.909 | -29.731 | -2.966 |
| 榆林市 | 1085.157 | 713.856 | -26.110 | 2.055 |
| 安康市 | -30.427 | 79.909 | 1.856 | 0.452 |
| 商洛市 | 126.218 | 214.609 | -8.515 | 3.274 |
表3 各地区工业污水排放驱动效应贡献值汇总
Table 3 Summary table of contribution value of industrial wastewater discharge driving effect by region
| 地区 | 效应类型 | |||
|---|---|---|---|---|
| 工业用水结构强度效应 | 工业用水强度效应 | 工业规模 效应 | 人口规模效应 | |
| 西安市 | 104.572 | 251.449 | -93.896 | 20.167 |
| 铜川市 | -21.995 | 32.602 | -15.657 | 21.141 |
| 宝鸡市 | -349.087 | 576.982 | -24.809 | -2.910 |
| 咸阳市 | 41.227 | 362.573 | -63.621 | 32.582 |
| 渭南市 | -585.932 | 743.515 | -24.140 | 68.332 |
| 延安市 | 292.400 | -24.521 | -139.632 | 55.659 |
| 汉中市 | -285.265 | 539.909 | -29.731 | -2.966 |
| 榆林市 | 1085.157 | 713.856 | -26.110 | 2.055 |
| 安康市 | -30.427 | 79.909 | 1.856 | 0.452 |
| 商洛市 | 126.218 | 214.609 | -8.515 | 3.274 |
| 年份 | 效应类型 | |||
|---|---|---|---|---|
| 工业用水结构 强度效应 | 工业用水 强度效应 | 工业规模效应 | 人口规模效应 | |
| 2011-2012 | 213.000 | -13.721 | -420.855 | 390.271 |
| 2012-2013 | 58.936 | 160.137 | 185.451 | -215.591 |
| 2013-2014 | 389.214 | -242.510 | 6.546 | -1.558 |
| 2014-2015 | -124.048 | 237.321 | -20.204 | -3.575 |
| 2015-2016 | -1919.139 | 2675.227 | -69.180 | 2.863 |
| 2016-2017 | 527.066 | 184.282 | 71.949 | 43.837 |
| 2017-2018 | 929.466 | 463.933 | -171.672 | -9.613 |
| 2018-2019 | 160.041 | 12.795 | -0.209 | -4.018 |
| 2019-2020 | 142.331 | 13.420 | -6.082 | -4.828 |
表4 工业污水排放驱动效应贡献值时间演变
Table 4 Time evolution table of contribution value of driving effect of industrial wastewater discharge
| 年份 | 效应类型 | |||
|---|---|---|---|---|
| 工业用水结构 强度效应 | 工业用水 强度效应 | 工业规模效应 | 人口规模效应 | |
| 2011-2012 | 213.000 | -13.721 | -420.855 | 390.271 |
| 2012-2013 | 58.936 | 160.137 | 185.451 | -215.591 |
| 2013-2014 | 389.214 | -242.510 | 6.546 | -1.558 |
| 2014-2015 | -124.048 | 237.321 | -20.204 | -3.575 |
| 2015-2016 | -1919.139 | 2675.227 | -69.180 | 2.863 |
| 2016-2017 | 527.066 | 184.282 | 71.949 | 43.837 |
| 2017-2018 | 929.466 | 463.933 | -171.672 | -9.613 |
| 2018-2019 | 160.041 | 12.795 | -0.209 | -4.018 |
| 2019-2020 | 142.331 | 13.420 | -6.082 | -4.828 |
| [1] | KAYA Y, 1989. Impact of carbon dioxide emission on GNP growth: interpretation of proposed scenarios[R]. Paper presented to the IPCC energy and industry subgroup, response strategies working group, Paris. |
| [2] | LIN B Q, JIANG Z J, 2009. Forecast of China’ s environmental Kuznets curve for CO2 emission and factors affecting China’ s CO2 emission[J]. Management World, 4: 27-36. |
| [3] |
LIU Y S, ZHOU Y, WU W X, 2015. Assessing the impact of population, income and technology on energy consumption and industrial pollutant emissions in China[J]. Applied Energy, 155: 904-917.
DOI URL |
| [4] | OECD, 2002. Indicators to measure decoupling of environment pressure from economic growth[R]. Paris: OECD. |
| [5] |
PETERS G P, WEBER C L, GUAN D, et al., 2007. China’s growing CO2 emissions: A race between increasing consumption and efficiency gains[J]. Environmental Science & Technology, 41(17): 5939-5944.
DOI URL |
| [6] | TAPIO P, BANISTER D, LUUKKANEN J, et al., 2005. Energy and transport in comparison: Immaterialisation, dematerialisation and decarbonisation in the EU15 between 1970 and 2000[J]. Energy Policy, 35(1): 33-451. |
| [7] | YUAN Q, MCINTYRE N, WU Y P, et al., 2017. Towards greater socio-economic equality in allocation of wastewater discharge permits in China based on the weighted Gini coefficient[J]. Resources, Conservation & Recycling, 127: 196-205. |
| [8] |
SINHA A, SEN S, 2016. Atmospheric consequences of trade and human development: A case of BRIC countries[J]. Atmospheric Pollution Research, 7(6): 980-989.
DOI URL |
| [9] | SONG Y Y, XUE D Q, MA B B, et al., 2020. Urbanization process of Loess Plateau and its ecological environment response pattern[J]. Economic Geography, 40(6): 174-184. |
| [10] |
TAPIO P, 2005. Towards a theory of decoupling: Degrees of decoupling in the EU and the case of road traffic in Finland between 1970 and 2001[J]. Transport Policy, 12(2): 137-151.
DOI URL |
| [11] | VEHMAS J, LUUKKANEN J, KALVOOJA J, 2003. Material flows and economic growth[R]. Finland (Turku): Turku School of Economies and Business Administration: 9-11. |
| [12] | 陈锋, 张晶, 任娇, 等, 2022. 基于LMDI模型的黄河流域碳排放时空差异及影响因素研究[J]. 地球环境学报, 13(4): 418-427. |
| CHEN F, ZHANG J, REN J, et al., 2022. Spatial and temporal differences and influencing factors of carbon emissions in the Yellow River Basin based on LMDI model[J]. Journal of Earth Environment, 13(4): 418-427. | |
| [13] | 陈桂月, 李海涛, 梁涛, 2013. 山西省工业废弃物排放与经济增长之间的关系分析[J]. 资源科学, 35(6): 1184-1193. |
| CHEN G Y, LI H T, LIANG T, 2013. Analysis of the relationship between industrial waste emissions and economic growth in Shanxi Province[J]. Resource Science, 35(6): 1184-1193. | |
| [14] | 陈玉山, 2018. 基于EKC的城市化和污水排放实证研究-以中国东部省际面板数据为例[J]. 河海大学学报 (哲学社会科学版), 20(4): 67-74, 93. |
| CHEN Y S, 2018. An empirical study on urbanization and sewage discharge based on EBC: A case study of interprovincial panel data in eastern China[J]. Journal of Hohai University (Philosophy and Social Sciences), 20(4): 67-74, 93. | |
| [15] | 郭熙保, 冷成英, 2016. 长江流域城市经济增长对工业固体废弃物影响比较研究-以沿江八城市为例[J]. 湖北社会科学 (11): 65-72. |
| GUO X B, LENG C Y, 2016. A comparative study on the impact of urban economic growth on industrial solid waste in the Yangtze River Basin: A case study of eight cities along the river[J]. Hubei Social Sciences (11): 65-72. | |
| [16] | 贺曲夫, 刘友金, 2012. 我国东中西部地区间产业转移的特征与趋势-基于2000-2010年统计数据的实证分析[J]. 经济地理, 32(12): 85-90. |
| HE Q F, LIU Y J, 2012. Characteristics and trends of industrial transfer between the eastern, central and western regions of China: An empirical analysis based on the statistical data from 2000 to 2010[J]. Economic Geography, 32(12): 85-90. | |
| [17] | 焦胜, 吴寿盛, 韩宗伟, 等, 2022. 湖南 “一湖四水” 工业集聚与水污染程度的时空演变及关联机制[J]. 经济地理, 42(4): 132-140. |
| JIAO S, WU S S, HAN Z W, et al., 2022. Spatial-temporal evolution and correlation mechanism of industrial agglomeration and water pollution degree of “one lake and four waters” in Hunan Province[J]. Economic Geography, 42(4): 132-140. | |
| [18] | 李达, 林龙圳, 林震, 等, 2021. 黄河流域生态保护和高质量发展的EKC检验[J]. 生态学报, 41(10): 3965-3974. |
| LI D, LIN L Z, LIN Z, et al., 2021. EKC test of ecological protection and high-quality development in the Yellow River Basin[J]. Acta Ecological Sinica, 41(10): 3965-3974. | |
| [19] |
李花, 赵雪雁, 王伟军, 等, 2019. 基于多尺度的中国城市工业污染时空分异及影响因素[J]. 地理研究, 38(8): 1993-2007.
DOI |
| LI H, ZHAO X Y, WANG W J, et al., 2019. Spatial-temporal differentiation and influencing factors of industrial pollution in Chinese cities based on multiple scales[J]. Geographical Research, 38(8): 1993-2007. | |
| [20] | 李妍林, 阮久莉, 王艺博, 等, 2022. 煤炭工业资源-环境-经济耦合协调分析-以榆林市为例[J]. 环境工程技术学报, 12(1): 260-266. |
| LI Y L, RUAN J L, WANG Y B, et al., 2022. Analysis on the coupling and coordination of coal industry resources, environment and economy: Taking Yulin City as an example[J]. Journal of Environmental Engineering Technology, 12(1): 260-266. | |
| [21] | 李芸邑, 刘利萍, 刘元元, 2021. 长江经济带工业污染排放空间分布格局及其影响因素[J]. 环境科学, 42(8): 3820-3828. |
| LI Y Y, LIU L P, LIU Y Y, 2021. Spatial distribution pattern and influencing factors of industrial pollution discharge in Yangtze River economic belt[J]. Environmental Science, 42(8): 3820-3828. | |
| [22] | 刘汉初, 樊杰, 周道静, 等, 2019. 2000年以来中国高耗能产业的空间格局演化及其成因[J]. 经济地理, 39(5): 110-118. |
| LIU H C, FAN J, ZHOU D J, et al., 2009. Spatial pattern evolution and causes of China’s energy-intensive industries since 2000[J]. Economic Geography, 39(5): 110-118. | |
| [23] | 刘远书, 籍国东, 罗忠新, 等, 2020. 南水北调东线治污对山东段的环境与经济影响-基于EKC曲线理论的实证分析[J]. 中国人口·资源与环境, 30(10): 73-81. |
| LIU Y S, JI G D, LUO Z X, et al., 2020. Environmental and economic impact of pollution control on Shandong section of the eastern route of the South-to-North Water Diversion Project: An empirical analysis based on the theory of EKC curve[J]. Chinese Mouth Resources and Environment, 30(10): 73-81. | |
| [24] |
马丽, 2016. 基于LMDI的中国工业污染排放变化影响因素分析[J]. 地理研究, 35(10): 1857-1868.
DOI |
| MA L, 2016. Analysis of influencing factors of industrial pollution emission change in China based on LMDI[J]. Geographical Research, 35(10): 1857-1868. | |
| [25] | 马又琳, 蒲灵, 毕朝文, 等, 2020. 四川省工业固废与经济发展及驱动因素的分析[J]. 环境科学与技术, 43(S2): 59-64. |
| MA Y L, PU L, BI C W, et al., 2020. Analysis of industrial solid waste and economic development and driving factors in Sichuan Province[J]. Environmental Science and Technology, 43(S2): 59-64. | |
| [26] | 曲健莹, 李科, 2019. 工业增长与二氧化碳排放 “脱钩” 的测算与分析[J]. 西安交通大学学报(社会科学版), 39(5): 92-104. |
| QU J Y, LI K, 2019. Measurement and analysis of “decoupling” between industrial growth and carbon dioxide emissions[J]. Journal of Xi’an Jiaotong University (Social Science Edition), 39(5): 92-104. | |
| [27] |
田光辉, 苗长虹, 胡志强, 等, 2018. 环境规制、地方保护与中国污染密集型产业布局[J]. 地理学报, 73(10): 1954-1969.
DOI |
| TIAN G H, MIAO C H, HU Z Q, et al., 2018. Environmental regulation, local protection and China’s pollution-intensive industrial layout[J]. Journal of Geography, 73(10): 1954-1969. | |
| [28] |
王杰, 李治国, 谷继建, 2021. 金砖国家碳排放与经济增长脱钩弹性及驱动因素-基于Tapio脱钩和LMDI模型的分析[J]. 世界地理研究, 30(3): 501-508.
DOI |
| WANG J, LI Z G, GU J J, 2021. The elasticity and driving factors of decoupling carbon emissions and economic growth in BRICS countries: An analysis based on Tapio decoupling and LMDI model[J]. World Geographical Research, 30(3): 501-508. | |
| [29] | 王敏, 冯相昭, 安祺, 等, 2021. 基于脱钩指数和LMDI的青海省绿色低碳发展策略研究[J]. 气候变化研究进展, 17(5): 598-607. |
| WANG M, FENG X Z, AN Q, et al., 2021. Research on green and low-carbon development strategy in Qinghai Province based on decoupling index and LMDI[J]. Climate Change Research Progress, 17(5): 598-607. | |
| [30] | 夏勇, 胡雅蓓, 2017. 经济增长与环境污染脱钩的因果链分解及内外部成因研究-来自中国30个省份的工业SO2排放数据[J]. 产业经济研究 (5): 100-113. |
| XIA Y, HU Y B, 2017. The causal chain decomposition and the internal and external causes of decoupling of environmental pollution from economic growth:evidence from industrial SO2 emission of 30 provinces in China[J]. Industrial Economic Research (5): 100-113. | |
| [31] |
谢文宝, 陈彤, 刘国勇, 2018. 新疆农业面源污染与农业经济增长的关系-基于脱钩模型和LMDI模型的实证分析[J]. 资源与产业, 20(1): 68-75.
DOI |
| XIE W B, CHEN T, LIU G Y, 2018. The relationship between agricultural non-point source pollution and agricultural economic growth in Xinjiang: An empirical analysis based on decoupling model and LMDI model[J]. Resources and Industry, 20(1): 68-75. | |
| [32] |
尹上岗, 杨山, 龚海波, 2022. 长三角工业经济规模与污染排放异速关系及互动机制[J]. 地理学报, 77(9): 2202-2218.
DOI |
| YIN S G, YANG S, GONG H B, 2022. The relationship and interaction mechanism between industrial economic scale and pollution emission in the Yangtze River Delta[J]. Acta Geographica Sinica, 77(9): 2202-2218. | |
| [33] | 尹希果, 桑守田, 2010. 中国经济增长中的污水排放特征分析[J]. 中国地质大学学报 (社会科学版), 10(2): 12-16. |
| YIN X G, SANG S T, 2010. Analysis of sewage discharge characteristics in China’s economic growth[J]. Journal of China University of Geosciences (Social Science Edition), 10(2): 12-16. | |
| [34] |
于慧, 仲佳, 刘邵权, 等, 2020. 张家口地区排污工业企业集聚与水污染空间耦合特征[J]. 自然资源学报, 35(6): 1416-1424.
DOI |
|
YU H, ZHONG J, LIU S Q, et al., 2020. Spatial coupling characteristics of sewage industrial enterprise agglomeration and water pollution in Zhangjiakou[J]. Journal of Natural Resources, 35(6): 1416-1424.
DOI URL |
|
| [35] |
袁伟彦, 方柳莉, 罗明, 2022. 中国工业碳排放驱动因素及其脱钩效应-基于时变参数C-D生产函数的分解和测算[J]. 资源科学, 44(7): 1422-1434.
DOI |
| YUAN W Y, FANG L L, LUO M, 2022. Driving factors of industrial carbon emissions in China and their decoupling effect: Decomposition and calculation based on time-varying parameters C-D production function[J]. Resources Science, 44(7): 1422-1434. | |
| [36] | 赵定涛, 张之, 范进, 2015. 中国经济发展与产业用地脱钩指数影响因素分析-基于LMDI模型的实证研究[J]. 管理现代化, 35(3): 105-107. |
| ZHAO D T, ZHANG Z, FAN J, 2015. Analysis of influencing factors of China’s economic development and industrial land decoupling index: An empirical study based on LMDI model[J]. Management Modernization, 35(3): 105-107. | |
| [37] | 周静, 杨桂山, 2007. 江苏省工业废水排放与经济增长的动态关系[J]. 地理研究, 26(5): 931-939. |
| ZHOU J, YANG G S, 2007. Dynamic relationship between industrial wastewater discharge and economic growth in Jiangsu Province[J]. Geographical Research, 26(5): 931-939. | |
| [38] |
周彦楠, 杨宇, 程博, 等, 2020. 基于脱钩指数和LMDI的中国经济增长与碳排放耦合关系的区域差异[J]. 中国科学院大学学报, 37(3): 295-307.
DOI |
| ZHOU Y N, YANG Y, CHENG B, et al., 2020. Regional differences in the coupling relationship between China’s economic growth and carbon emissions based on decoupling index and LMDI[J]. Journal of University of Chinese Academy of Sciences, 37(3): 295-307. |
| [1] | 吴雅睿, 王美景, 王涛, 杨梅焕. 新冠疫情下NO2时空变化特征——以陕西省为例[J]. 生态环境学报, 2023, 32(3): 514-524. |
| 阅读次数 | ||||||
|
全文 |
|
|||||
|
摘要 |
|
|||||