
生态环境学报 ›› 2026, Vol. 35 ›› Issue (10): 1649-1660.DOI: 10.16258/j.cnki.1674-5906.2026.10.014
• 研究论文【环境科学】 •
上一篇
李季( ), 杨蓉慧*()
收稿日期:2026-03-30
修回日期:2026-08-21
接受日期:2026-09-04
出版日期:2026-10-18
发布日期:2026-10-21
通讯作者:
E-mail: 作者简介:李季(1983年生),男,副教授,博士,主要研究方向为企业环境创新与技术管理,土地利用与规划管理等。E-mail: 512625974@qq.com
基金资助:
Li Ji(), Yang Ronghui*()
Received:2026-03-30
Revised:2026-08-21
Accepted:2026-09-04
Online:2026-10-18
Published:2026-10-21
摘要:
【目的】探讨数字经济、生态转型与城乡融合的协同演化特征、空间关联及作用机制,揭示数字经济驱动东北县域绿色发展的内在逻辑,为老工业基地县域绿色转型与城乡协同发展提供经验证据。【方法】研究基于2010-2024年东北三省县域面板数据,构建“数字驱动-城乡传导-生态响应”三系统评价体系,综合运用熵值法、耦合协调模型、Dagum基尼分解、空间杜宾模型和中介效应模型,分析三系统协同发展特征、空间效应及作用路径。【结果】三系统综合发展水平持续提升,耦合协调度由0.346提高至0.667,由轻度失调演进至中度协调,区域内差异是协同发展不均衡的主要来源。三系统协同发展呈显著空间正相关,且数字经济对生态转型具有显著的直接促进和空间溢出效应,直接效应和间接效应分别为0.218和0.146。城乡融合发挥显著部分中介作用,中介效应占总效应的28.9%。)数字经济生态促进效应具有明显异质性,在非资源型县域、核心城市圈和高数字化地区更显著。【结论】东北县域数字经济、生态转型与城乡融合呈现协同增强但非同步演进特征,数字经济对生态转型具有本地驱动与空间扩散的双重作用,城乡融合构成重要传导路径;其绿色效应具有明显的条件依赖性,产业基础、区域联系和数字化水平是影响数字经济绿色效应释放的重要因素。
中图分类号:
李季, 杨蓉慧. 数字经济驱动东北县域生态转型与城乡融合的协同演化与空间效应[J]. 生态环境学报, 2026, 35(10): 1649-1660.
Li Ji, Yang Ronghui. Digital Economy Driven Ecological Transition in Northeast China’s Counties: Urban-Rural Transmission Mechanism and Spatial Effects[J]. Ecology and Environmental Sciences, 2026, 35(10): 1649-1660.
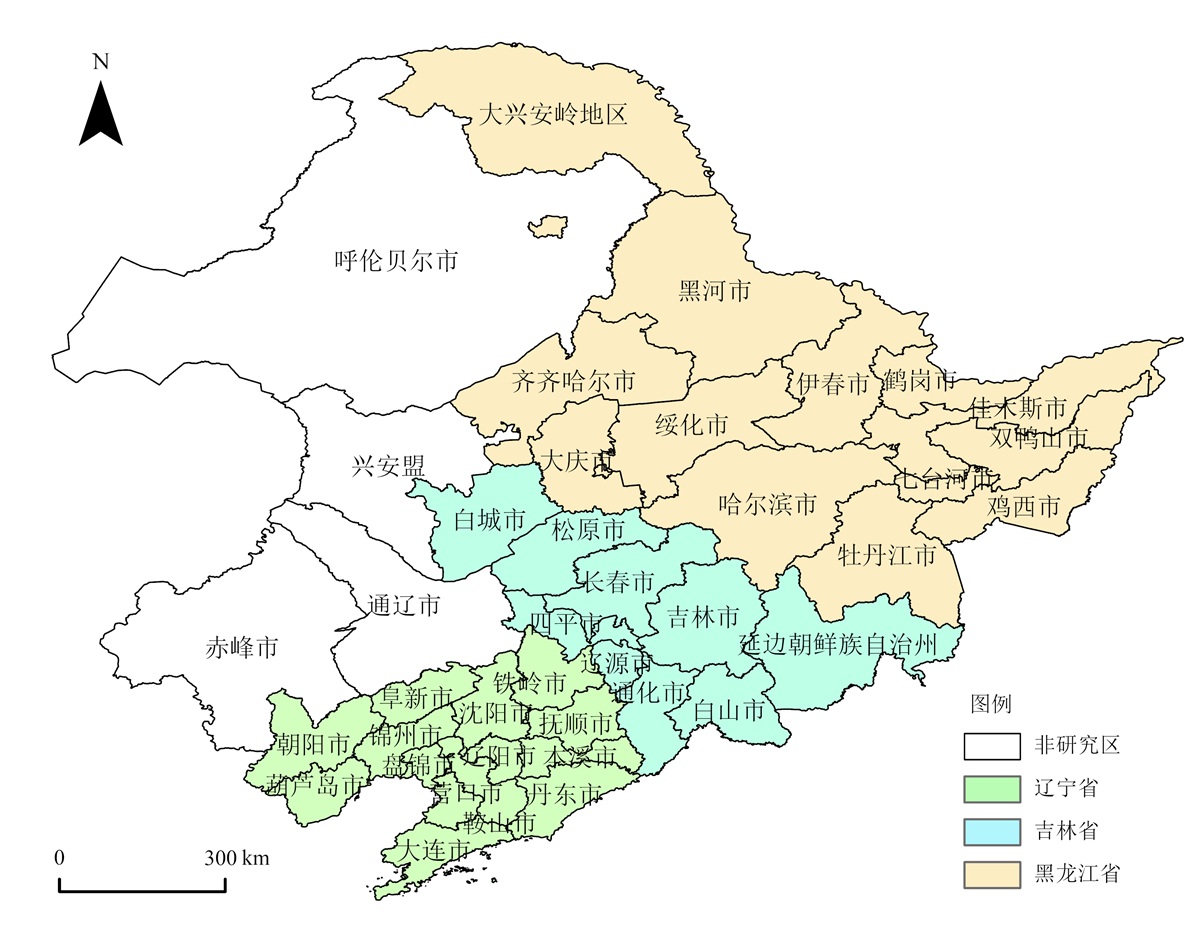
图1 研究区概况 该图基于国家地理信息服务平台下载的【审图号:GS(2024)0650号】标准地图制作,底图界线无修改
Figure 1 Overview of the study area
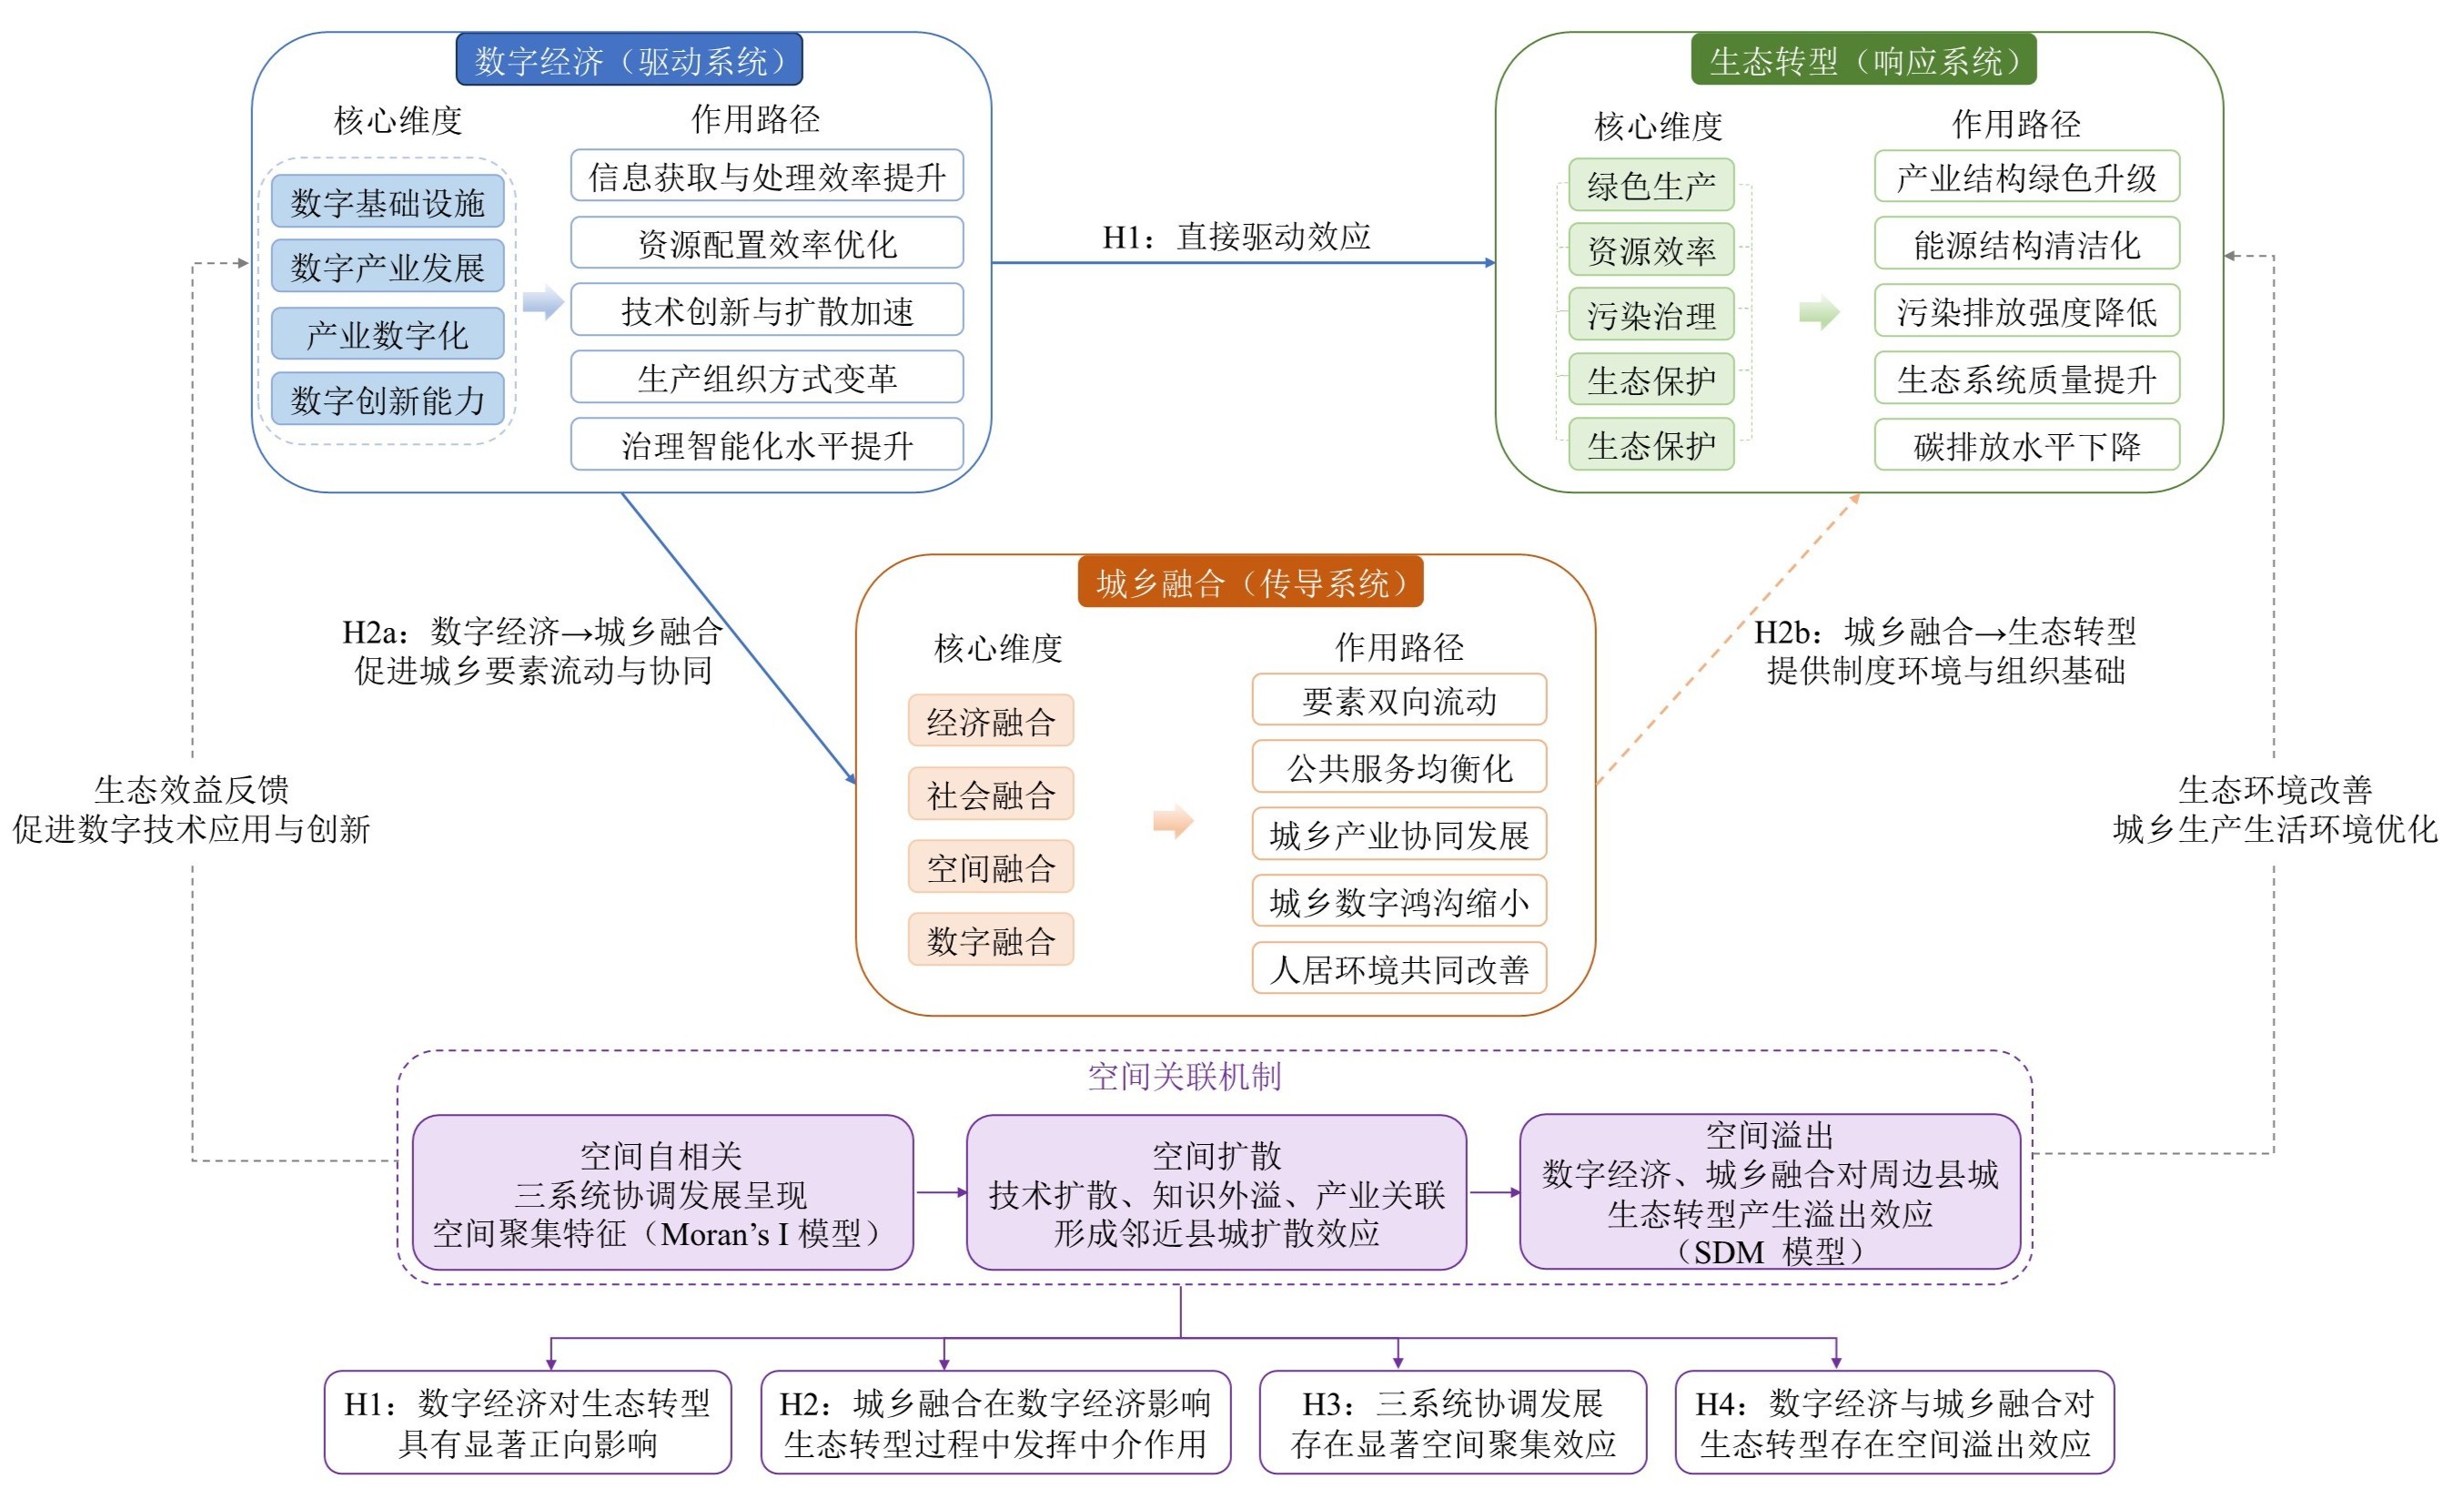
图2 三系统协同分析框架
Figure 2 Framework for synergistic analysis of three systems
| 维度层 | 指标层 | 属性 | 数据来源 |
|---|---|---|---|
| 数字基础设施 | 互联网用户密度 (每百人互联网用户数) | + | 《中国县域统计年鉴》 |
| 移动电话普及率 (每百人移动电话用户数) | + | 《中国县域统计年鉴》 | |
| 固定宽带接入水平 (每百户固定宽带接入户数) | + | 《中国县域统计年鉴》 | |
| 人均通信业务量 (人均邮电业务总量) | + | 各省统计年鉴 | |
| 数字产业发展 | 信息服务业就业比重 | + | 县级统计公报 |
| 软件与信息产业规模 | + | 工信部门统计资料 | |
| 电子商务活跃度 (人均网络零售额) | + | 电子商务公共服务平台 | |
| 数字经济产业占比 | + | 县级统计公报 | |
| 数字创新能力 | R&D投入强度 (R&D经费支出占GDP比重) | + | 《中国科技统计年鉴》 |
| 万人专利授权量 | + | 国家知识产权局数据库 | |
| 数字技术创新指数 | + | 国家知识产权局数据库 | |
| 科技人才密度 (每万人科技活动人员数) | + | 《中国科技统计年鉴》 | |
| 数字应用水平 | 数字普惠金融指数 | + | 北京大学数字普惠 金融指数 |
| 线上消费活跃度 (人均线上消费额) | + | 第三方支付平台数据 | |
| 数字公共服务水平 (政务服务线上办理率) | + | 政府公开资料 | |
| 智慧治理能力指数 (环境监测数字化覆盖率) | + | 各省生态环境厅公报 |
表1 经济发展指标体系
Table 1 Indicator system for digital economic development
| 维度层 | 指标层 | 属性 | 数据来源 |
|---|---|---|---|
| 数字基础设施 | 互联网用户密度 (每百人互联网用户数) | + | 《中国县域统计年鉴》 |
| 移动电话普及率 (每百人移动电话用户数) | + | 《中国县域统计年鉴》 | |
| 固定宽带接入水平 (每百户固定宽带接入户数) | + | 《中国县域统计年鉴》 | |
| 人均通信业务量 (人均邮电业务总量) | + | 各省统计年鉴 | |
| 数字产业发展 | 信息服务业就业比重 | + | 县级统计公报 |
| 软件与信息产业规模 | + | 工信部门统计资料 | |
| 电子商务活跃度 (人均网络零售额) | + | 电子商务公共服务平台 | |
| 数字经济产业占比 | + | 县级统计公报 | |
| 数字创新能力 | R&D投入强度 (R&D经费支出占GDP比重) | + | 《中国科技统计年鉴》 |
| 万人专利授权量 | + | 国家知识产权局数据库 | |
| 数字技术创新指数 | + | 国家知识产权局数据库 | |
| 科技人才密度 (每万人科技活动人员数) | + | 《中国科技统计年鉴》 | |
| 数字应用水平 | 数字普惠金融指数 | + | 北京大学数字普惠 金融指数 |
| 线上消费活跃度 (人均线上消费额) | + | 第三方支付平台数据 | |
| 数字公共服务水平 (政务服务线上办理率) | + | 政府公开资料 | |
| 智慧治理能力指数 (环境监测数字化覆盖率) | + | 各省生态环境厅公报 |
| 维度层 | 指标层 | 属性 | 数据来源 |
|---|---|---|---|
| 绿色 生产 | 单位GDP能耗 (吨标准煤/万元) | - | 《中国能源统计年鉴》 |
| 绿色产业比重 | + | 县级统计公报 | |
| 绿色专利授权量 | + | 国家知识产权局数据库 | |
| 清洁生产水平 | + | 各省生态环境厅公报 | |
| 资源 效率 | 能源利用效率 (单位能耗GDP产出) | + | 《中国能源统计年鉴》 |
| 土地利用效率 (单位建设用地GDP产出) | + | 《中国城乡建设统计年鉴》 | |
| 水资源利用效率 (单位GDP用水量) | + | 《中国水资源统计年鉴》 | |
| 资源产出效率 | + | 《中国环境统计年鉴》 | |
| 环境 治理 | 污染治理投资强度 | + | 《中国环境统计年鉴》 |
| 污水处理率 | + | 《中国环境统计年鉴》 | |
| 工业固废综合利用率 | + | 《中国环境统计年鉴》 | |
| 污染物减排能力 | + | 《中国环境统计年鉴》 | |
| 生态 质量 | 森林覆盖率 | + | 《中国林业统计年鉴》 |
| 建成区绿化覆盖率 | + | 《中国城乡建设统计年鉴》 | |
| 空气环境质量(优良天数比例) | + | 中国环境监测总站 | |
| 生态环境恢复水平 | + | MODIS遥感数据 |
表2 生态转型指标体系
Table 2 Ecological transition indicator system
| 维度层 | 指标层 | 属性 | 数据来源 |
|---|---|---|---|
| 绿色 生产 | 单位GDP能耗 (吨标准煤/万元) | - | 《中国能源统计年鉴》 |
| 绿色产业比重 | + | 县级统计公报 | |
| 绿色专利授权量 | + | 国家知识产权局数据库 | |
| 清洁生产水平 | + | 各省生态环境厅公报 | |
| 资源 效率 | 能源利用效率 (单位能耗GDP产出) | + | 《中国能源统计年鉴》 |
| 土地利用效率 (单位建设用地GDP产出) | + | 《中国城乡建设统计年鉴》 | |
| 水资源利用效率 (单位GDP用水量) | + | 《中国水资源统计年鉴》 | |
| 资源产出效率 | + | 《中国环境统计年鉴》 | |
| 环境 治理 | 污染治理投资强度 | + | 《中国环境统计年鉴》 |
| 污水处理率 | + | 《中国环境统计年鉴》 | |
| 工业固废综合利用率 | + | 《中国环境统计年鉴》 | |
| 污染物减排能力 | + | 《中国环境统计年鉴》 | |
| 生态 质量 | 森林覆盖率 | + | 《中国林业统计年鉴》 |
| 建成区绿化覆盖率 | + | 《中国城乡建设统计年鉴》 | |
| 空气环境质量(优良天数比例) | + | 中国环境监测总站 | |
| 生态环境恢复水平 | + | MODIS遥感数据 |
| 维度层 | 指标层 | 属性 | 数据来源 |
|---|---|---|---|
| 经济 融合 | 城乡收入比(农村/城镇) | + | 《中国县域统计年鉴》 |
| 非农就业比重 | + | 《中国县域统计年鉴》 | |
| 城乡产业协调度 | + | 《中国县域统计年鉴》 | |
| 农村居民消费水平 | + | 《中国县域统计年鉴》 | |
| 社会 融合 | 教育资源均衡水平 (城乡生均教育经费比) | + | 各省教育厅统计资料 |
| 医疗资源可及性 (城乡每千人床位数比) | + | 各省卫生健康委 统计资料 | |
| 社会保障覆盖率 | + | 各省民政厅统计资料 | |
| 公共服务均等化水平 | + | 县级统计公报 | |
| 空间 融合 | 道路密度 (公路里程/县域面积) | + | 《中国城乡建设 统计年鉴》 |
| 交通可达性 (到最近地级市的时间距离) | − | 高德地图API | |
| 城乡建设协调度 | + | 《中国城乡建设 统计年鉴》 | |
| 基础设施覆盖率 (农村自来水普及率) | + | 《中国城乡建设 统计年鉴》 | |
| 数字 融合 | 数字基础设施下沉水平 (农村/城镇互联网普及率) | + | 中国互联网络 信息中心 |
| 数字金融普及率 (农村/城镇数字普惠金融指数) | + | 北京大学数字 普惠金融指数 | |
| 数字公共服务共享度 | + | 政府公开资料 | |
| 城乡数字应用协调度 | + | 第三方支付平台数据 |
表3 城乡融合指标体系
Table 3 Urban-rural integration indicator system
| 维度层 | 指标层 | 属性 | 数据来源 |
|---|---|---|---|
| 经济 融合 | 城乡收入比(农村/城镇) | + | 《中国县域统计年鉴》 |
| 非农就业比重 | + | 《中国县域统计年鉴》 | |
| 城乡产业协调度 | + | 《中国县域统计年鉴》 | |
| 农村居民消费水平 | + | 《中国县域统计年鉴》 | |
| 社会 融合 | 教育资源均衡水平 (城乡生均教育经费比) | + | 各省教育厅统计资料 |
| 医疗资源可及性 (城乡每千人床位数比) | + | 各省卫生健康委 统计资料 | |
| 社会保障覆盖率 | + | 各省民政厅统计资料 | |
| 公共服务均等化水平 | + | 县级统计公报 | |
| 空间 融合 | 道路密度 (公路里程/县域面积) | + | 《中国城乡建设 统计年鉴》 |
| 交通可达性 (到最近地级市的时间距离) | − | 高德地图API | |
| 城乡建设协调度 | + | 《中国城乡建设 统计年鉴》 | |
| 基础设施覆盖率 (农村自来水普及率) | + | 《中国城乡建设 统计年鉴》 | |
| 数字 融合 | 数字基础设施下沉水平 (农村/城镇互联网普及率) | + | 中国互联网络 信息中心 |
| 数字金融普及率 (农村/城镇数字普惠金融指数) | + | 北京大学数字 普惠金融指数 | |
| 数字公共服务共享度 | + | 政府公开资料 | |
| 城乡数字应用协调度 | + | 第三方支付平台数据 |
| 指标 | 年份 | 累计增幅/ % | |||
|---|---|---|---|---|---|
| 2010 | 2015 | 2020 | 2024 | ||
| 数字经济(DE)均值 | 0.213 | 0.336 | 0.482 | 0.601 | 182 |
| 生态转型(ET)均值 | 0.284 | 0.347 | 0.461 | 0.558 | 96.5 |
| 城乡融合(UR)均值 | 0.247 | 0.319 | 0.446 | 0.547 | 122 |
| 数字经济CV | 0.408 | 0.342 | 0.284 | 0.256 | −37.3 |
| 生态转型CV | 0.324 | 0.300 | 0.273 | 0.249 | −23.2 |
| 城乡融合CV | 0.328 | 0.307 | 0.267 | 0.241 | −26.5 |
| 高水平县域占比/% | 6.5 | 9.1 | 15.4 | 21.5 | +15.0 |
| 低水平县域占比/% | 39.6 | 31.7 | 21.3 | 12.8 | −26.8 |
表4 东北三省县域三系统发展水平与结构特征
Table 4 Development levels and structural characteristics of the three systems in counties across the Three Northeastern Provinces
| 指标 | 年份 | 累计增幅/ % | |||
|---|---|---|---|---|---|
| 2010 | 2015 | 2020 | 2024 | ||
| 数字经济(DE)均值 | 0.213 | 0.336 | 0.482 | 0.601 | 182 |
| 生态转型(ET)均值 | 0.284 | 0.347 | 0.461 | 0.558 | 96.5 |
| 城乡融合(UR)均值 | 0.247 | 0.319 | 0.446 | 0.547 | 122 |
| 数字经济CV | 0.408 | 0.342 | 0.284 | 0.256 | −37.3 |
| 生态转型CV | 0.324 | 0.300 | 0.273 | 0.249 | −23.2 |
| 城乡融合CV | 0.328 | 0.307 | 0.267 | 0.241 | −26.5 |
| 高水平县域占比/% | 6.5 | 9.1 | 15.4 | 21.5 | +15.0 |
| 低水平县域占比/% | 39.6 | 31.7 | 21.3 | 12.8 | −26.8 |
| 系统 | 一级维度 | 贡献率/% |
|---|---|---|
| 数字经济 | 数字基础设施 | 32.8 |
| 产业数字化 | 29.4 | |
| 数字产业发展 | 21.7 | |
| 创新支撑 | 16.1 | |
| 生态转型 | 环境治理 | 31.5 |
| 绿色生产 | 27.3 | |
| 生态质量 | 22.4 | |
| 资源效率 | 18.8 | |
| 城乡融合 | 经济融合 | 30.6 |
| 空间融合 | 26.8 | |
| 社会融合 | 23.5 | |
| 数字融合 | 19.1 |
表5 三系统维度贡献率
Table 5 Contribution rates of the three systems
| 系统 | 一级维度 | 贡献率/% |
|---|---|---|
| 数字经济 | 数字基础设施 | 32.8 |
| 产业数字化 | 29.4 | |
| 数字产业发展 | 21.7 | |
| 创新支撑 | 16.1 | |
| 生态转型 | 环境治理 | 31.5 |
| 绿色生产 | 27.3 | |
| 生态质量 | 22.4 | |
| 资源效率 | 18.8 | |
| 城乡融合 | 经济融合 | 30.6 |
| 空间融合 | 26.8 | |
| 社会融合 | 23.5 | |
| 数字融合 | 19.1 |
| 指标 | 年份 | 变化幅度/ % | |||
|---|---|---|---|---|---|
| 2010 | 2015 | 2020 | 2024 | ||
| 耦合度C | 0.482 | 0.571 | 0.683 | 0.782 | 62.2 |
| 综合协调指数T | 0.248 | 0.334 | 0.463 | 0.569 | 129 |
| 协调度D | 0.346 | 0.437 | 0.562 | 0.667 | 92.8 |
| 总体基尼G | 0.318 | 0.294 | 0.261 | 0.236 | −25.8 |
| 区域内差异贡献率/% | 43.1 | 41.5 | 41.0 | 39.4 | −3.67 |
| 区域间差异贡献率/% | 39.6 | 40.1 | 38.7 | 37.7 | −1.91 |
| 超变密度贡献率/% | 17.3 | 18.4 | 20.3 | 22.9 | +5.58 |
表6 三系统耦合协调度演化结果
Table 6 Results of the evolution of coupling coordination among the three systems
| 指标 | 年份 | 变化幅度/ % | |||
|---|---|---|---|---|---|
| 2010 | 2015 | 2020 | 2024 | ||
| 耦合度C | 0.482 | 0.571 | 0.683 | 0.782 | 62.2 |
| 综合协调指数T | 0.248 | 0.334 | 0.463 | 0.569 | 129 |
| 协调度D | 0.346 | 0.437 | 0.562 | 0.667 | 92.8 |
| 总体基尼G | 0.318 | 0.294 | 0.261 | 0.236 | −25.8 |
| 区域内差异贡献率/% | 43.1 | 41.5 | 41.0 | 39.4 | −3.67 |
| 区域间差异贡献率/% | 39.6 | 40.1 | 38.7 | 37.7 | −1.91 |
| 超变密度贡献率/% | 17.3 | 18.4 | 20.3 | 22.9 | +5.58 |
| 指标 | 年份 | |||
|---|---|---|---|---|
| 2010 | 2015 | 2020 | 2024 | |
| Moran’s I | 0.184*** | 0.227*** | 0.291*** | 0.336*** |
| Z值 | 3.96 | 4.73 | 5.85 | 6.53 |
| HH集聚占比/% | 18.6 | 23.9 | 31.4 | 38.7 |
| LL集聚占比/% | 29.7 | 27.5 | 24.2 | 20.1 |
表7 空间相关性结果
Table 7 Results of spatial correlation
| 指标 | 年份 | |||
|---|---|---|---|---|
| 2010 | 2015 | 2020 | 2024 | |
| Moran’s I | 0.184*** | 0.227*** | 0.291*** | 0.336*** |
| Z值 | 3.96 | 4.73 | 5.85 | 6.53 |
| HH集聚占比/% | 18.6 | 23.9 | 31.4 | 38.7 |
| LL集聚占比/% | 29.7 | 27.5 | 24.2 | 20.1 |
| 变量 | 模型(1) | 模型(2) | 模型(3) |
|---|---|---|---|
| 数字经济(DE) | 0.284*** (0.052) | 0.263*** (0.048) | 0.241*** (0.046) |
| 城乡融合(UR) | - | 0.196*** (0.042) | 0.171*** (0.039) |
| 经济发展水平 | 0.112** | 0.097** | 0.085* |
| 产业结构升级 | 0.134*** | 0.126*** | 0.118*** |
| 财政支出强度 | 0.083* | 0.071* | 0.066* |
| 对外开放水平 | 0.058 | 0.061 | 0.047 |
| 人口密度 | 0.075* | 0.063 | 0.052 |
| 空间滞后项ρ | 0.318*** | 0.341*** | 0.354*** |
| R2 | 0.621 | 0.647 | 0.671 |
表8 空间杜宾模型回归结果
Table 8 Results of Spatial Durbin Model Regression
| 变量 | 模型(1) | 模型(2) | 模型(3) |
|---|---|---|---|
| 数字经济(DE) | 0.284*** (0.052) | 0.263*** (0.048) | 0.241*** (0.046) |
| 城乡融合(UR) | - | 0.196*** (0.042) | 0.171*** (0.039) |
| 经济发展水平 | 0.112** | 0.097** | 0.085* |
| 产业结构升级 | 0.134*** | 0.126*** | 0.118*** |
| 财政支出强度 | 0.083* | 0.071* | 0.066* |
| 对外开放水平 | 0.058 | 0.061 | 0.047 |
| 人口密度 | 0.075* | 0.063 | 0.052 |
| 空间滞后项ρ | 0.318*** | 0.341*** | 0.354*** |
| R2 | 0.621 | 0.647 | 0.671 |
| 变量 | 直接效应 | 间接效应 | 总效应 |
|---|---|---|---|
| 数字经济(DE) | 0.218*** (0.041) | 0.146*** (0.052) | 0.364*** (0.063) |
| 城乡融合(UR) | 0.154*** (0.037) | 0.092** (0.045) | 0.246*** (0.054) |
| 经济发展水平 | 0.081* (0.043) | 0.064* (0.039) | 0.145** (0.051) |
| 产业结构升级 | 0.127*** (0.036) | 0.081** (0.041) | 0.208*** (0.049) |
| 财政支出强度 | 0.066* (0.039) | 0.029 (0.033) | 0.095* (0.046) |
| 人口密度 | 0.052 (0.041) | 0.018 (0.027) | 0.070 (0.045) |
表9 空间效应分解结果
Table 9 Spatial effect decomposition results
| 变量 | 直接效应 | 间接效应 | 总效应 |
|---|---|---|---|
| 数字经济(DE) | 0.218*** (0.041) | 0.146*** (0.052) | 0.364*** (0.063) |
| 城乡融合(UR) | 0.154*** (0.037) | 0.092** (0.045) | 0.246*** (0.054) |
| 经济发展水平 | 0.081* (0.043) | 0.064* (0.039) | 0.145** (0.051) |
| 产业结构升级 | 0.127*** (0.036) | 0.081** (0.041) | 0.208*** (0.049) |
| 财政支出强度 | 0.066* (0.039) | 0.029 (0.033) | 0.095* (0.046) |
| 人口密度 | 0.052 (0.041) | 0.018 (0.027) | 0.070 (0.045) |
| 变量 | 模型(1)ET | 模型(2)UR | 模型(3)ET |
|---|---|---|---|
| 数字经济(DE) | 0.287*** (0.051) | 0.341*** (0.046) | 0.204*** (0.044) |
| 城乡融合(UR) | - | - | 0.243*** (0.039) |
| 经济发展水平 | 0.106** | 0.118** | 0.091** |
| 产业结构升级 | 0.132*** | 0.147*** | 0.119*** |
| 财政支出强度 | 0.074* | 0.083* | 0.066* |
| 人口密度 | 0.062 | 0.078* | 0.057 |
| 时间固定效应 | YES | YES | YES |
| 地区固定效应 | YES | YES | YES |
| R2 | 0.624 | 0.651 | 0.689 |
| F统计量 | 72.3*** | 79.6*** | 91.4*** |
表10 作用机制检验与中介效应结果
Table10 Mechanism test results
| 变量 | 模型(1)ET | 模型(2)UR | 模型(3)ET |
|---|---|---|---|
| 数字经济(DE) | 0.287*** (0.051) | 0.341*** (0.046) | 0.204*** (0.044) |
| 城乡融合(UR) | - | - | 0.243*** (0.039) |
| 经济发展水平 | 0.106** | 0.118** | 0.091** |
| 产业结构升级 | 0.132*** | 0.147*** | 0.119*** |
| 财政支出强度 | 0.074* | 0.083* | 0.066* |
| 人口密度 | 0.062 | 0.078* | 0.057 |
| 时间固定效应 | YES | YES | YES |
| 地区固定效应 | YES | YES | YES |
| R2 | 0.624 | 0.651 | 0.689 |
| F统计量 | 72.3*** | 79.6*** | 91.4*** |
| 检验类别 | 分组/方法 | 数字经济(DE) | 城乡融合(UR) | 空间滞后项ρ | R2 |
|---|---|---|---|---|---|
| 资源属性异质性 | 资源型县域 | 0.186*** (0.061) | 0.142** (0.057) | 0.284*** (0.063) | 0.608 |
| 非资源型县域 | 0.294*** (0.052) | 0.251*** (0.049) | 0.361*** (0.058) | 0.684 | |
| 空间区位异质性 | 核心城市圈 | 0.315*** (0.048) | 0.228*** (0.043) | 0.394*** (0.051) | 0.713 |
| 外围县域 | 0.174** (0.073) | 0.131* (0.069) | 0.247*** (0.071) | 0.591 | |
| 数字基础异质性 | 高数字化地区 | 0.347*** (0.044) | 0.271*** (0.041) | 0.382*** (0.049) | 0.732 |
| 低数字化地区 | 0.139* (0.078) | 0.118* (0.065) | 0.216** (0.073) | 0.578 | |
| 稳健性检验 | 基准模型(Queen矩阵) | 0.241*** | 0.171*** | 0.354*** | 0.671 |
| 替换地理距离矩阵 | 0.227*** | 0.163*** | 0.336*** | 0.658 | |
| 替换经济距离矩阵 | 0.213*** | 0.158*** | 0.318*** | 0.644 | |
| 替换数字经济测度方式 | 0.258*** | 0.179*** | 0.361*** | 0.682 | |
| 滞后一期核心解释变量 | 0.201** | 0.164*** | 0.309*** | 0.639 | |
| 1%双侧缩尾处理 | 0.236*** | 0.168*** | 0.347*** | 0.663 | |
| 剔除省会城市样本 | 0.218*** | 0.149** | 0.321*** | 0.651 |
表11 异质性与稳健性检验结果
Table 11 Heterogeneity and robustness tests
| 检验类别 | 分组/方法 | 数字经济(DE) | 城乡融合(UR) | 空间滞后项ρ | R2 |
|---|---|---|---|---|---|
| 资源属性异质性 | 资源型县域 | 0.186*** (0.061) | 0.142** (0.057) | 0.284*** (0.063) | 0.608 |
| 非资源型县域 | 0.294*** (0.052) | 0.251*** (0.049) | 0.361*** (0.058) | 0.684 | |
| 空间区位异质性 | 核心城市圈 | 0.315*** (0.048) | 0.228*** (0.043) | 0.394*** (0.051) | 0.713 |
| 外围县域 | 0.174** (0.073) | 0.131* (0.069) | 0.247*** (0.071) | 0.591 | |
| 数字基础异质性 | 高数字化地区 | 0.347*** (0.044) | 0.271*** (0.041) | 0.382*** (0.049) | 0.732 |
| 低数字化地区 | 0.139* (0.078) | 0.118* (0.065) | 0.216** (0.073) | 0.578 | |
| 稳健性检验 | 基准模型(Queen矩阵) | 0.241*** | 0.171*** | 0.354*** | 0.671 |
| 替换地理距离矩阵 | 0.227*** | 0.163*** | 0.336*** | 0.658 | |
| 替换经济距离矩阵 | 0.213*** | 0.158*** | 0.318*** | 0.644 | |
| 替换数字经济测度方式 | 0.258*** | 0.179*** | 0.361*** | 0.682 | |
| 滞后一期核心解释变量 | 0.201** | 0.164*** | 0.309*** | 0.639 | |
| 1%双侧缩尾处理 | 0.236*** | 0.168*** | 0.347*** | 0.663 | |
| 剔除省会城市样本 | 0.218*** | 0.149** | 0.321*** | 0.651 |
| [1] |
Jiao L Q, 2026. The New urbanization of urban agglomerations in the Yellow River Basin is coupled and coordinated with the performance of ecological and environmental welfare[J]. Academic Journal of Management and Social Sciences, 14(3): 120-123.
DOI URL |
| [2] |
Li C, Zhao Q, Wang L P, 2024. The impact mechanism and effect evaluation of digital economy development on regional carbon emission reduction: evidence from provincial panel data in China[J]. International Journal of Environmental Research, 18(6): 99.
DOI |
| [3] |
Pang Q S, Sun Y N, 2026. Coupling and coordinated development of urbanization and ecological environment in China and its spatiotemporal characteristics[J]. Sustainability, 18(9): 4559.
DOI URL |
| [4] |
Wang W J, Li Y M, 2026. Does urban-rural integration promote sustainable development of a low-carbon economy? empirical analysis of panel data from the provincial level in China[J]. Sustainability, 18(9): 4475.
DOI URL |
| [5] |
Yang D, Yang Z, Wu H Z, 2025. Effects and mechanisms of digital economy development on corporate carbon emission intensity: Empirical evidence from cross-country data[J]. Digital Economy and Sustainable Development, 3(1): 1-15.
DOI |
| [6] |
Zhang Y F, Zhang P J, Lu Z W, et al., 2026. Measuring spatial heterogeneity and obstacle factors of urban-rural integration development in Zhejiang Province, China[J]. Land, 15(5): 732.
DOI URL |
| [7] | 蔡小华, 陈丰, 2025. 数字新基建、绿色技术创新与经济高质量发展[J]. 统计与决策, 41(24): 117-122. |
| Cai X H, Chen F, 2025. Digital new infrastructure, green technological innovation, and high-quality economic development[J]. Statistics and Decision Making, 41(24): 117-122. | |
| [8] | 蔡佳怡, 赵新宇, 2025. 数字经济、要素市场化配置与城乡融合发展[J]. 经济问题 (12): 52-60. |
| Cai J Y, Zhao X Y, 2025. Digital economy, market-based allocation of factors, and integrated urban-rural development[J]. Economic Issues (12): 52-60. | |
| [9] | 杜运伟, 李思雨, 2025. 数据要素赋能城市绿色创新的机制与效应研究——来自国家级大数据综合试验区的证据[J]. 审计与经济研究, 40(5): 106-117. |
| Du Y W, Li S Y, 2025. A study on the mechanisms and effects of data factors in empowering urban green innovation: Evidence from national-level big data comprehensive pilot zones[J]. Audit and Economic Research, 40(5): 106-117. | |
| [10] |
邓淇中, 王振玉, 2025. 长江经济带市域绿色低碳转型水平变化特征及其影响因素[J]. 经济地理, 45(11): 223-233.
DOI |
| Deng Q Z, Wang Z Y, 2025. Characteristics of changes in the level of green and low-carbon transition in municipal areas of the Yangtze River economic belt and their influencing factors[J]. Economic Geography, 45(11): 223-233. | |
| [11] |
范德成, 肖文雪, 2025. 数字经济何以成为区域创新发展新动能——基于要素融合的实证分析[J]. 科技进步与对策, 42(5): 69-81.
DOI |
| Fan D C, Xiao W X, 2025. Why the digital economy has become a new engine for regional innovative development: An empirical analysis based on factor integration[J]. Science and Technology Progress and Policy, 42(5): 69-81. | |
| [12] | 方师乐, 叶俊焘, 黄祖辉, 等, 2025. 城乡融合发展与县域经济转型——来自城乡融合发展试验区的经验证据[J]. 管理世界, 41(12): 123-154. |
| Fang S L, Ye J T, Huang Z H, et al., 2025. Integrated urban-rural development and county-level economic transformation: Empirical evidence from urban-rural integration pilot zones[J]. Management World, 41(12): 123-154. | |
| [13] |
顾伟男, 高鑫, 2025. 中国绿色低碳技术创新的时空格局与多维机制空间效应研究[J]. 地理科学进展, 44(2): 256-270.
DOI |
| Gu W N, Gao X, 2025. A study on the spatiotemporal patterns and spatial effects of multi-dimensional mechanisms in China’s green and low-carbon technological innovation[J]. Advances in Geography, 44(2): 256-270. | |
| [14] | 郭丰, 杨晨, 任毅, 2025. 数字经济创新发展试验区如何影响城市碳排放——基于数字技术创新与产业结构升级视角[J]. 江汉论坛 (4): 46-57. |
| Guo F, Yang C, Ren Y, 2025. How digital economy innovation and development pilot zones affect urban carbon emissions: A perspective based on digital technology innovation and industrial structure upgrading[J]. Jianghan Forum (4): 46-57. | |
| [15] | 韩先锋, 魏欣, 2025. “绿色-共享” 数据政策何以能协同促进城市生态转型?[J]. 产业经济研究 (3): 86-99. |
| Han X F, Wei X, 2025. “How can ‘green-shared’ data policies synergistically promote urban green transition?”[J]. Industrial Economics Research (3): 86-99. | |
| [16] | 姜长云, 2025. 我国产业融合态势、问题与 “十五五” 发展思路[J]. 经济纵横 (6): 1-12. |
| Jiang C Y, 2025. Trends, issues, and development strategies for industrial integration in China during the 15th five-year plan period[J]. Economic Horizons (6): 1-12. | |
| [17] | 寇佳丽, 徐晓光, 2025. 数字经济的节能减排效应研究——基于能耗双控与减污降碳视角[J]. 产业经济研究 (2): 15-28. |
| Kou J L, Xu X G, 2025. A study on the energy-saving and emission-reduction effects of the digital economy: From the perspective of dual control of energy consumption and pollution reduction and carbon emission reduction[J]. Industrial Economics Research (2): 15-28. | |
| [18] | 刘鑫鹏, 卢新海, 2025. 因地制宜发展新质生产力: 我国老工业基地和资源型城市绿色创新绩效的增长潜力与提升路径[J]. 统计研究, 42(8): 45-58. |
| Liu X P, Lu X H, 2025. Developing new-quality productive forces in accordance with local conditions: Growth potential and improvement pathways for green innovation performance in China’s old industrial bases and resource-based cities[J]. Journal of Statistical Research, 42(8): 45-58. | |
| [19] |
梁怡彤, 王承云, 吴佳颖, 等, 2026. 长三角地区数字经济与绿色创新耦合协调演进及政策建议[J]. 自然资源学报, 41(3): 928-942.
DOI |
|
Liang Y T, Wang C Y, Wu J Y, et al., 2026. Coupled and coordinated evolution of the digital economy and green innovation in the Yangtze River delta region and policy recommendations[J]. Journal of Natural Resources, 41(3): 928-942.
DOI URL |
|
| [20] | 刘秉镰, 袁博, 刘玉海, 2025. 数字基础设施如何畅通区域间资本要素流动——基于企业注册大数据的证据[J]. 数量经济技术经济研究, 42(1): 72-92. |
| Liu B L, Yuan B, Liu Y H, 2025. How digital infrastructure facilitates the flow of capital and factors of production across regions: Evidence from big data on enterprise registration[J]. Journal of Quantitative Economics and Technical Economics, 42(1): 72-92. | |
| [21] | 李成龙, 周宏, 张良, 2025. 数字经济对城乡融合发展的影响及路径研究[J]. 重庆大学学报 (社会科学版), 31(1): 17-34. |
| Li C L, Zhou H, Zhang L, 2025. A study on the impact and pathways of the digital economy on integrated urban-rural development[J]. Journal of Chongqing University (Social Science Edition), 31(1): 17-34. | |
| [22] | 李季, 杨蓉慧, 2026. 基于多源遥感数据的黄土高原土地利用碳排放时空演变与驱动机制[J]. 应用生态学报, 37(4):1175-1186. |
| Li J, Yang R H, 2026. Assessing spatiotemporal variations and driving mechanisms of land use carbon emissions in the Loess Plateau based on multi-source remote sensing data[J]. Chinese Journal of Applied Ecology, 37(4): 1175-1186. | |
| [23] | 李慧, 佟孟华, 张国建, 等, 2025. 产业转型升级示范区的生态转型效应——基于 “数产融合” 视角[J]. 财经研究, 51(1): 4-18. |
| Li H, Tong M H, Zhang G J, et al., 2025. Green transformation effects of industrial transformation and upgrading demonstration zones: A perspective based on “digital-industrial integration”[J]. Journal of Financial and Economic Research, 51(1): 4-18. | |
| [24] |
戚琳, 田成诗, 2026. 长三角智慧城市群创新-生态-经济系统协同演化及障碍因素分析[J]. 生态环境学报, 35(4): 630-641.
DOI |
| Qi L, Tian C S, 2026. Co-evolution and obstacle factors of innovation- ecology-economy system in Yangtze River delta smart urban agglomeration[J]. Ecology and Environmental Sciences, 35(4): 630-641. | |
| [25] | 乔英俊, 张延锋, 李垣, 等, 2024. 老工业基地城市如何构建开放式创新生态破解产业负锁定困境: 以湖北十堰为例[J]. 中国软科学 (3): 109-118. |
| Qiao Y J, Zhang Y F, Li Y, et al., 2024. How cities in old industrial bases can build open innovation ecosystems to break the industrial negative lock-in dilemma: A case study of Shiyan, Hubei[J]. China Soft Science (3): 109-118. | |
| [26] | 沈坤荣, 王灿, 2025. “十五五” 时期推动经济实现质的有效提升和量的合理增长[J]. 经济理论与经济管理, 45(11): 13-26. |
| Shen K R, Wang C, 2025. Promoting qualitative improvement and reasonable quantitative growth of the economy during the 15th five- year plan period[J]. Economic Theory and Economic Management, 45(11): 13-26. | |
| [27] | 唐任伍, 史晓雯, 2025. 数字技术创新的共同富裕效应——基于277个城市的经验证据[J]. 探索 (2): 98-114. |
| Tang R W, Shi X W, 2025. The common prosperity effects of digital technology innovation: Empirical evidence from 277 cities[J]. Exploration (2): 98-114. | |
| [28] | 王群伟, 杜倩, 李振冉, 等, 2025. 数字经济和绿色化转型的碳排放双控效果: 基于制造业新质生产力的机制解析[J]. 中国管理科学, 33(11): 321-335. |
| Wang Q W, Du Q, Li Z R, et al., 2025. The dual-control effects of carbon emissions in digital and green transitions: A mechanism analysis based on new-quality productivity in manufacturing[J]. Chinese Journal of Management Science, 33(11): 321-335. | |
| [29] | 王娟娟, 张可云, 2025. 数字经济时代商贸流通促进城乡融合发展的新思路——基于区域协调发展视角[J]. 社会科学辑刊 (6): 120-131. |
| Wang J J, Zhang K Y, 2025. New approaches to promoting urban-rural integrated development through commerce and distribution in the digital economy era: A perspective on regional coordinated development[J]. Social Sciences Quarterly (6): 120-131. | |
| [30] | 汪德根, 杨易宁, 2025. 城乡融合视角下居业协同体破解传统村落空心化路径[J]. 旅游学刊, 40(2): 3-5. |
| Wang D G, Yang Y N, 2025. Pathways for residential-industrial synergy to address the hollowing-out of traditional villages from an urban-rural integration perspective[J]. Journal of Tourism Studies, 40(2): 3-5. | |
| [31] |
王悦, 于福东, 张月, 等, 2026. 基于PLUS-InVEST模型的东北黑土区景观格局与碳储量变化多情景模拟[J]. 生态环境学报, 35(2): 178-189.
DOI |
| Wang Y, Yu F D, Zhang Y, et al., 2026. Multi-scenario simulation of landscape pattern and carbon storage changes in northeast black soil region based on the PLUS-InVEST model[J]. Ecology and Environmental Sciences, 35(2): 178-189. | |
| [32] | 辛大楞, 季存睿, 辛立国, 2025. 智能制造对企业ESG表现的影响——基于 “智能制造试点示范项目” 的准自然实验[J]. 中国人口・资源与环境, 35(10): 103-113. |
| Xin D L, Ji C R, Xin L G, 2025. The impact of smart manufacturing on corporate ESG performance: A quasi-natural experiment based on the “smart manufacturing pilot demonstration projects”[J]. China Population, Resources and Environment, 35(10): 103-113. | |
| [33] |
杨婕, 戈大专, 孙攀, 等, 2025. 基于 “人口-土地-资本” 要素流动的城乡融合发展机制——以江西省为例[J]. 资源科学, 47(1): 110-124.
DOI |
| Yang J, Ge D Z, Sun P, et al., 2025. Mechanisms of urban-rural integrated development based on the flow of “population-land-capital” factors: A case study of Jiangxi province[J]. Journal of Resource Science, 47(1): 110-124. | |
| [34] | 袁华锡, 黄小洪, 袁歌骋, 等, 2025. 数字经济发展影响重污染企业绿色创新的渠道和经济效应研究[J]. 科研管理, 46(12): 179-189. |
| Yuan H X, Huang X H, Yuan G C, et al., 2025. A study on the channels and economic effects of digital economic development on green innovation in heavy-polluting enterprises[J]. Science and Technology Management, 46(12): 179-189. | |
| [35] |
杨欣蕾, 方斌, 樊彤彤, 等, 2026. 经济发达地区 “三生” 功能城乡梯度分异与空间溢出效应——以南京市为例[J]. 地理研究, 45(1): 145-164.
DOI |
| Yang X L, Fang B, Fan T T, et al., 2026. Urban-rural gradient differentiation of “three-life” functions and spatial spillover effects in economically developed regions: the case of Nanjing[J]. Geographical Research, 45(1): 145-164. | |
| [36] | 赵杨, 张慧, 2025. 中国东北地区多维分化的困境、成因与协同振兴对策研究[J]. 理论探讨, (4): 170-179. |
| Zhao Y, Zhang H, 2025. A study on the dilemmas, causes, and collaborative revitalization strategies of multidimensional differentiation in northeast China[J]. Theoretical Exploration, (4): 170-179. | |
| [37] | 张淑惠, 孙燕芳, 2023. 新基建对区域 “创新-生态-经济” 耦合协调发展的影响——基于空间溢出效应和传导机制的检验[J]. 中国人口・资源与环境, 33(10): 187-198. |
| Zhang S H, Sun Y F, 2023. The impact of new infrastructure on the coupled and coordinated development of regional “innovation- ecology-economy”: An examination based on spatial spillover effects and transmission mechanisms[J]. China Population, Resources and Environment, 33(10): 187-198. |
| [1] | 解延京, 孙玉环, 许子易. 生态产业化发展水平对生态产品价值实现的影响研究——基于绿色金融和人力资本调节效应的视角[J]. 生态环境学报, 2025, 34(6): 986-996. |
| 阅读次数 | ||||||
|
全文 |
|
|||||
|
摘要 |
|
|||||
