生态环境学报 ›› 2025, Vol. 34 ›› Issue (2): 209-221.DOI: 10.16258/j.cnki.1674-5906.2025.02.004
顾天江1,2( ), 杜凯1,2,3,*(), 毛旭锋1,2,*(), 金鑫1,2, 于红妍4, 唐文家5, 吴艺1,2, 刘泽碧1,2
收稿日期:2024-09-06
出版日期:2025-02-18
发布日期:2025-03-03
通讯作者:
毛旭锋。E-mail: maoxufeng@yeah.com作者简介:顾天江(1998年生),男,硕士研究生,研究方向为湿地遥感。E-mail: 202247331019@stu.qhnu.edu.cn
基金资助:
GU Tianjiang1,2(), DU Kai1,2,3,*(), MAO Xufeng1,2,*(), JIN Xin1,2, YU Hongyan4, TANG Wenjia5, WU Yi1,2, LIU Zebi1,2
Received:2024-09-06
Online:2025-02-18
Published:2025-03-03
摘要:
为准确评估2021年玛多地震对高寒湿地的影响,选取震中6度烈度带为研究区,依托Google Earth Engine(GEE)平台,融合Sentinel-2、Sentinel-1以及SRTM1数据,构建原始光谱、植被指数、水体指数、红边指数、纹理特征、地形、雷达特征7个遥感特征集,利用Stacking算法构建集成学习模型实现震前、震后的高寒湿地分类;结合InVEST模型实现地震前后生境质量的定量评估。结果表明,1)集成学习分类精度优于支持向量机和随机森林,特征优选方案下分类精度最高(92.741%,Kappa系数为0.902),较支持向量机和随机森林有所提高。2)在原始光谱的基础上加入纹理特征,湖泊湿地和河流湿地的分类精度分别可达0.987、0.933,加入地形特征后沼泽湿地分类精度可达0.857,纹理特征中的方差和相关性以及地形特征中的坡度、高程对高寒湿地分类效果影响显著。3)地震造成湿地面积减小,其中沼泽湿地减少43.088 km2,变化率为−0.254%;河流湿地减少31.654 km2,变化率为−3.522%;湖泊湿地面积下降4.971 km2,变化率为−0.303%。而裸地面积增加了36.160 km2。4)生境质量均值从震前0.523下降到震后0.482,高等级生境质量面积占比从7.399%下降到5.993%,而低等级生境质量面积占比从2.191%上升到7.658%。该研究显示地震对高寒湿地产生负面影响,研究结果可为后续灾后生态恢复与管理提供依据。
中图分类号:
顾天江, 杜凯, 毛旭锋, 金鑫, 于红妍, 唐文家, 吴艺, 刘泽碧. 基于EL-InVEST模型的玛多地震对高寒湿地面积及生境质量影响研究[J]. 生态环境学报, 2025, 34(2): 209-221.
GU Tianjiang, DU Kai, MAO Xufeng, JIN Xin, YU Hongyan, TANG Wenjia, WU Yi, LIU Zebi. Effects of Maduo Earthquake on Alpine Wetland Area and Habitat Quality Based on EL-InVEST Model[J]. Ecology and Environment, 2025, 34(2): 209-221.
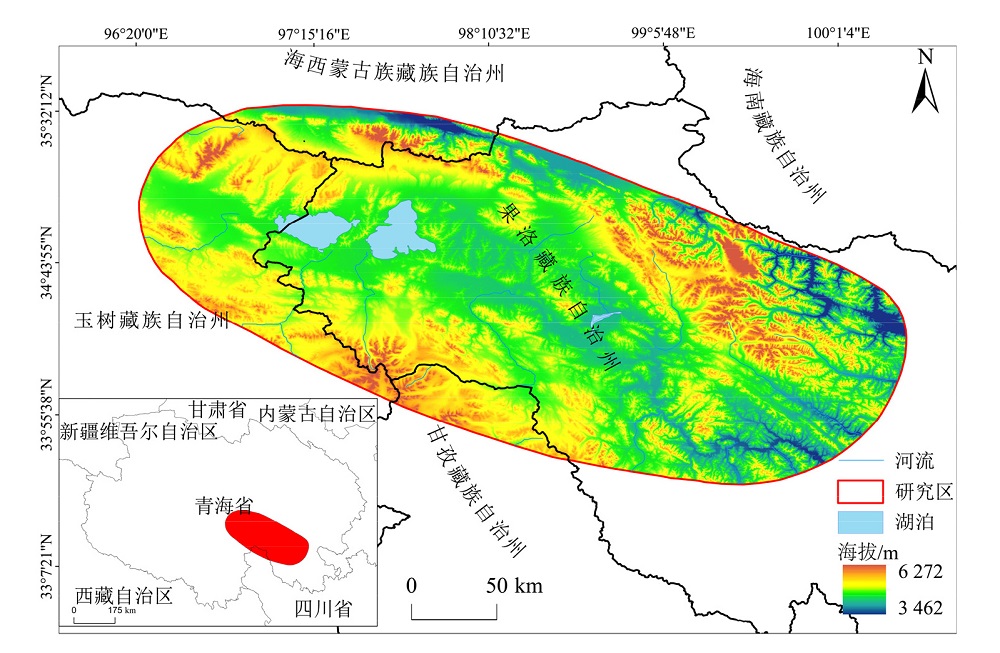
图1 研究区区位图 文本所有地图基于国家地理信息公共服务平台GS (2024) 0650号标准地图制作,底图边界无修改
Figure 1 Location map of the studied area
| 数据 | 时间 | 分辨率/m | 影像/景 |
|---|---|---|---|
| Sentinel-2 | 20200501-20200901 20220501-20220901 | 10 | 73 70 |
| Sentinel-1 | 2020、2022 | 10 | 79、72 |
| SRTM1 | - | 30 | - |
表1 数据情况
Table 1 Data situation
| 数据 | 时间 | 分辨率/m | 影像/景 |
|---|---|---|---|
| Sentinel-2 | 20200501-20200901 20220501-20220901 | 10 | 73 70 |
| Sentinel-1 | 2020、2022 | 10 | 79、72 |
| SRTM1 | - | 30 | - |
| 特征变量 | 指数全称 | 指数简称 | 特征说明 |
|---|---|---|---|
| 原始光谱特征 | - | - | B2,B3,B4,B5,B6,B7,B8,B8a,B11,B12 |
| 植被指数 | Normalized Difference Vegetation Index | NDVI | (B8a−B4)/(B8a+B4) |
| Ratio Vegetation Index | RVI | B8a/B4 | |
| Difference Vegetation Index | DVI | B8a−B4 | |
| Green Chlorophyll Vegetation Index | GCVI | (B8/B3)−1 | |
| Transformed Vegetation Index | TVI | 0.5×(120×(B8−B3)×(B8/B4)) | |
| Soil Adjusted Vegetation Index | SAVI | 1.5×(B8−B4)/(B8+B4+0.5) | |
| 水体指数 | Normalized Difference Water Index | NDWI | (B3−B8a)/(B3+B8a) |
| Modified Normalized Difference Water Index | MNDWI | (B3−B11)/(B3+B11) | |
| Red-Near-Infrared Water Index | RNDWI | (B12−B4)/(B12+B4) | |
| Land Surface Water Index | LSWI | (B8−B11)/(B8+B11) | |
| Enhanced Water Index | EWI | (B3−B8−B12)/(B3+B8+B12) | |
| Surface Water Index | SWI | B2+B4−B8 | |
| 红边指数 | Normalized Difference Vegetation Index red-edge 1 | NDVIre1 | (B8a−B5)/(B8a+B5) |
| Normalized Difference Vegetation Index red-edge 2 | NDVIre2 | (B8a−B6)/(B8a+B6) | |
| Normalized Difference Vegetation Index red-edge 3 | NDVIre3 | (B8a−B7)/(B8a+B7) | |
| Normalized Difference red-edge 1 | NDre1 | (B6−B5)/(B6+B5) | |
| Normalized Difference red-edge 2 | NDre2 | (B7−B5)/(B7+B5) | |
| Chlorophyll Index red-edge | CIre | B7/B5−1 | |
| 纹理特征 | Angular second moment | GLCM_A | 角二阶矩 |
| Correlation | GLCM_Cor | 相关性 | |
| Contrast | GLCM_Con | 对比度 | |
| Entropy | GLCM_E | 熵 | |
| Variance | GLCM_V | 方差 | |
| 地形 | Digital Elevation Model | DEM | 高程 |
| Slope | Slope | 坡度 | |
| Aspect | Aspect | 坡向 | |
| 雷达特征 | VV | VV | Sentinel-1 VV |
| VH | VH | Sentinel-1 VH |
表2 特征说明
Table 2 Description of the features
| 特征变量 | 指数全称 | 指数简称 | 特征说明 |
|---|---|---|---|
| 原始光谱特征 | - | - | B2,B3,B4,B5,B6,B7,B8,B8a,B11,B12 |
| 植被指数 | Normalized Difference Vegetation Index | NDVI | (B8a−B4)/(B8a+B4) |
| Ratio Vegetation Index | RVI | B8a/B4 | |
| Difference Vegetation Index | DVI | B8a−B4 | |
| Green Chlorophyll Vegetation Index | GCVI | (B8/B3)−1 | |
| Transformed Vegetation Index | TVI | 0.5×(120×(B8−B3)×(B8/B4)) | |
| Soil Adjusted Vegetation Index | SAVI | 1.5×(B8−B4)/(B8+B4+0.5) | |
| 水体指数 | Normalized Difference Water Index | NDWI | (B3−B8a)/(B3+B8a) |
| Modified Normalized Difference Water Index | MNDWI | (B3−B11)/(B3+B11) | |
| Red-Near-Infrared Water Index | RNDWI | (B12−B4)/(B12+B4) | |
| Land Surface Water Index | LSWI | (B8−B11)/(B8+B11) | |
| Enhanced Water Index | EWI | (B3−B8−B12)/(B3+B8+B12) | |
| Surface Water Index | SWI | B2+B4−B8 | |
| 红边指数 | Normalized Difference Vegetation Index red-edge 1 | NDVIre1 | (B8a−B5)/(B8a+B5) |
| Normalized Difference Vegetation Index red-edge 2 | NDVIre2 | (B8a−B6)/(B8a+B6) | |
| Normalized Difference Vegetation Index red-edge 3 | NDVIre3 | (B8a−B7)/(B8a+B7) | |
| Normalized Difference red-edge 1 | NDre1 | (B6−B5)/(B6+B5) | |
| Normalized Difference red-edge 2 | NDre2 | (B7−B5)/(B7+B5) | |
| Chlorophyll Index red-edge | CIre | B7/B5−1 | |
| 纹理特征 | Angular second moment | GLCM_A | 角二阶矩 |
| Correlation | GLCM_Cor | 相关性 | |
| Contrast | GLCM_Con | 对比度 | |
| Entropy | GLCM_E | 熵 | |
| Variance | GLCM_V | 方差 | |
| 地形 | Digital Elevation Model | DEM | 高程 |
| Slope | Slope | 坡度 | |
| Aspect | Aspect | 坡向 | |
| 雷达特征 | VV | VV | Sentinel-1 VV |
| VH | VH | Sentinel-1 VH |
| 威胁源 | 权重 | 最大影响距离/km | 衰退类型 |
|---|---|---|---|
| 裸地 | 0.8 | 8 | 线性 |
| 其他 | 0.5 | 3 | 线性 |
| 道路 | 0.5 | 5 | 线性 |
表3 研究区威胁源及最大影响距离
Table 3 Threat sources and maximum impact distance in the studied area
| 威胁源 | 权重 | 最大影响距离/km | 衰退类型 |
|---|---|---|---|
| 裸地 | 0.8 | 8 | 线性 |
| 其他 | 0.5 | 3 | 线性 |
| 道路 | 0.5 | 5 | 线性 |
| 土地利用类型 | 生境适宜度 | 敏感度 | ||
|---|---|---|---|---|
| 裸地 | 其他 | 道路 | ||
| 草地 | 0.80 | 0.6 | 0.5 | 0.5 |
| 沼泽湿地 | 0.80 | 0.6 | 0.4 | 0.65 |
| 湖泊湿地 | 0.90 | 0.8 | 0.4 | 0.7 |
| 河流湿地 | 0.80 | 0.6 | 0.4 | 0.65 |
| 裸地 | 0 | 0 | 0.1 | 0 |
| 其他 | 0.20 | 0.2 | 0 | 0.3 |
表4 不同土地类型生境适宜度及对威胁源的敏感度
Table 4 Habitat suitability and sensitivity to threat sources for different land types
| 土地利用类型 | 生境适宜度 | 敏感度 | ||
|---|---|---|---|---|
| 裸地 | 其他 | 道路 | ||
| 草地 | 0.80 | 0.6 | 0.5 | 0.5 |
| 沼泽湿地 | 0.80 | 0.6 | 0.4 | 0.65 |
| 湖泊湿地 | 0.90 | 0.8 | 0.4 | 0.7 |
| 河流湿地 | 0.80 | 0.6 | 0.4 | 0.65 |
| 裸地 | 0 | 0 | 0.1 | 0 |
| 其他 | 0.20 | 0.2 | 0 | 0.3 |
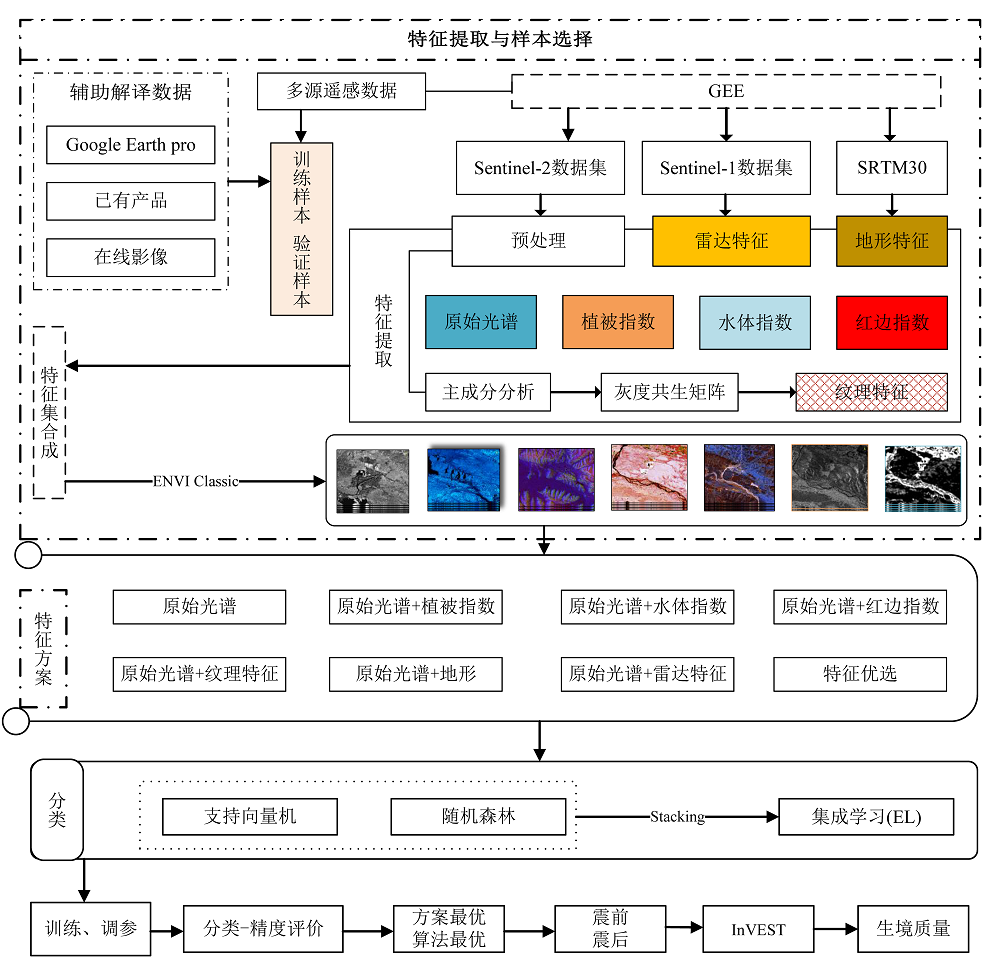
图2 技术路线图
Figure 2 Technology roadmap
| 方案 | 模型 | ||
|---|---|---|---|
| 支持向量机 | 随机森林 | 集成学习 | |
| 1 | 原始光谱 | ||
| 2 | 原始光谱+植被指数 | ||
| 3 | 原始光谱+水体指数 | ||
| 4 | 原始光谱+红边指数 | ||
| 5 | 原始光谱+纹理特征 | ||
| 6 | 原始光谱+地形 | ||
| 7 | 原始光谱+雷达特征 | ||
| 8 | 特征优选 | ||
表5 湿地分类方案详情
Table 5 Details of wetland extraction plan
| 方案 | 模型 | ||
|---|---|---|---|
| 支持向量机 | 随机森林 | 集成学习 | |
| 1 | 原始光谱 | ||
| 2 | 原始光谱+植被指数 | ||
| 3 | 原始光谱+水体指数 | ||
| 4 | 原始光谱+红边指数 | ||
| 5 | 原始光谱+纹理特征 | ||
| 6 | 原始光谱+地形 | ||
| 7 | 原始光谱+雷达特征 | ||
| 8 | 特征优选 | ||
| 方案 | 精度 | ||||||
|---|---|---|---|---|---|---|---|
| 草地 | 沼泽湿地 | 湖泊湿地 | 河流湿地 | 冰川与积雪 | 裸地 | 其他 | |
| 方案1 | 0.872 | 0.807 | 0.943 | 0.917 | 0.973 | 0.965 | 0.888 |
| 方案2 | 0.880 | 0.817 | 0.947 | 0.913 | 0.958 | 0.990 | 0.897 |
| 方案3 | 0.870 | 0.820 | 0.955 | 0.925 | 0.960 | 0.978 | 0.905 |
| 方案4 | 0.883 | 0.825 | 0.948 | 0.923 | 0.973 | 0.978 | 0.892 |
| 方案5 | 0.897 | 0.843 | 0.987 | 0.933 | 0.917 | 0.923 | 0.877 |
| 方案6 | 0.903 | 0.857 | 0.950 | 0.923 | 0.972 | 0.970 | 0.895 |
| 方案7 | 0.870 | 0.825 | 0.937 | 0.922 | 0.948 | 0.990 | 0.898 |
| 方案8 | 0.930 | 0.867 | 0.982 | 0.920 | 0.988 | 0.920 | 0.830 |
表6 各方案地类的分类精度
Table 6 Classification accuracy for each programmatic land category
| 方案 | 精度 | ||||||
|---|---|---|---|---|---|---|---|
| 草地 | 沼泽湿地 | 湖泊湿地 | 河流湿地 | 冰川与积雪 | 裸地 | 其他 | |
| 方案1 | 0.872 | 0.807 | 0.943 | 0.917 | 0.973 | 0.965 | 0.888 |
| 方案2 | 0.880 | 0.817 | 0.947 | 0.913 | 0.958 | 0.990 | 0.897 |
| 方案3 | 0.870 | 0.820 | 0.955 | 0.925 | 0.960 | 0.978 | 0.905 |
| 方案4 | 0.883 | 0.825 | 0.948 | 0.923 | 0.973 | 0.978 | 0.892 |
| 方案5 | 0.897 | 0.843 | 0.987 | 0.933 | 0.917 | 0.923 | 0.877 |
| 方案6 | 0.903 | 0.857 | 0.950 | 0.923 | 0.972 | 0.970 | 0.895 |
| 方案7 | 0.870 | 0.825 | 0.937 | 0.922 | 0.948 | 0.990 | 0.898 |
| 方案8 | 0.930 | 0.867 | 0.982 | 0.920 | 0.988 | 0.920 | 0.830 |
| 方案 | 支持向量机 | 随机森林 | 集成学习 | |||||
|---|---|---|---|---|---|---|---|---|
| 总体精度/ % | Kappa | 总体精度/ % | Kappa | 总体精度/ % | Kappa | |||
| 方案1 | 86.883 | 0.831 | 87.424 | 0.832 | 88.821 | 0.852 | ||
| 方案2 | 85.274 | 0.814 | 89.032 | 0.845 | 90.012 | 0.861 | ||
| 方案3 | 87.741 | 0.838 | 88.058 | 0.842 | 89.031 | 0.849 | ||
| 方案4 | 87.847 | 0.869 | 89.027 | 0.893 | 89.143 | 0.853 | ||
| 方案5 | 89.143 | 0.863 | 89.346 | 0.889 | 90.640 | 0.869 | ||
| 方案6 | 88.062 | 0.842 | 90.108 | 0.901 | 92.465 | 0.903 | ||
| 方案7 | 87.848 | 0.838 | 87.959 | 0.836 | 88.708 | 0.848 | ||
| 方案8 | 88.817 | 0.846 | 91.293 | 0.883 | 92.741 | 0.902 | ||
表7 不同模型各方案分类精度及kappa系数
Table 7 Classification accuracy and kappa coefficients for each scheme of different models
| 方案 | 支持向量机 | 随机森林 | 集成学习 | |||||
|---|---|---|---|---|---|---|---|---|
| 总体精度/ % | Kappa | 总体精度/ % | Kappa | 总体精度/ % | Kappa | |||
| 方案1 | 86.883 | 0.831 | 87.424 | 0.832 | 88.821 | 0.852 | ||
| 方案2 | 85.274 | 0.814 | 89.032 | 0.845 | 90.012 | 0.861 | ||
| 方案3 | 87.741 | 0.838 | 88.058 | 0.842 | 89.031 | 0.849 | ||
| 方案4 | 87.847 | 0.869 | 89.027 | 0.893 | 89.143 | 0.853 | ||
| 方案5 | 89.143 | 0.863 | 89.346 | 0.889 | 90.640 | 0.869 | ||
| 方案6 | 88.062 | 0.842 | 90.108 | 0.901 | 92.465 | 0.903 | ||
| 方案7 | 87.848 | 0.838 | 87.959 | 0.836 | 88.708 | 0.848 | ||
| 方案8 | 88.817 | 0.846 | 91.293 | 0.883 | 92.741 | 0.902 | ||
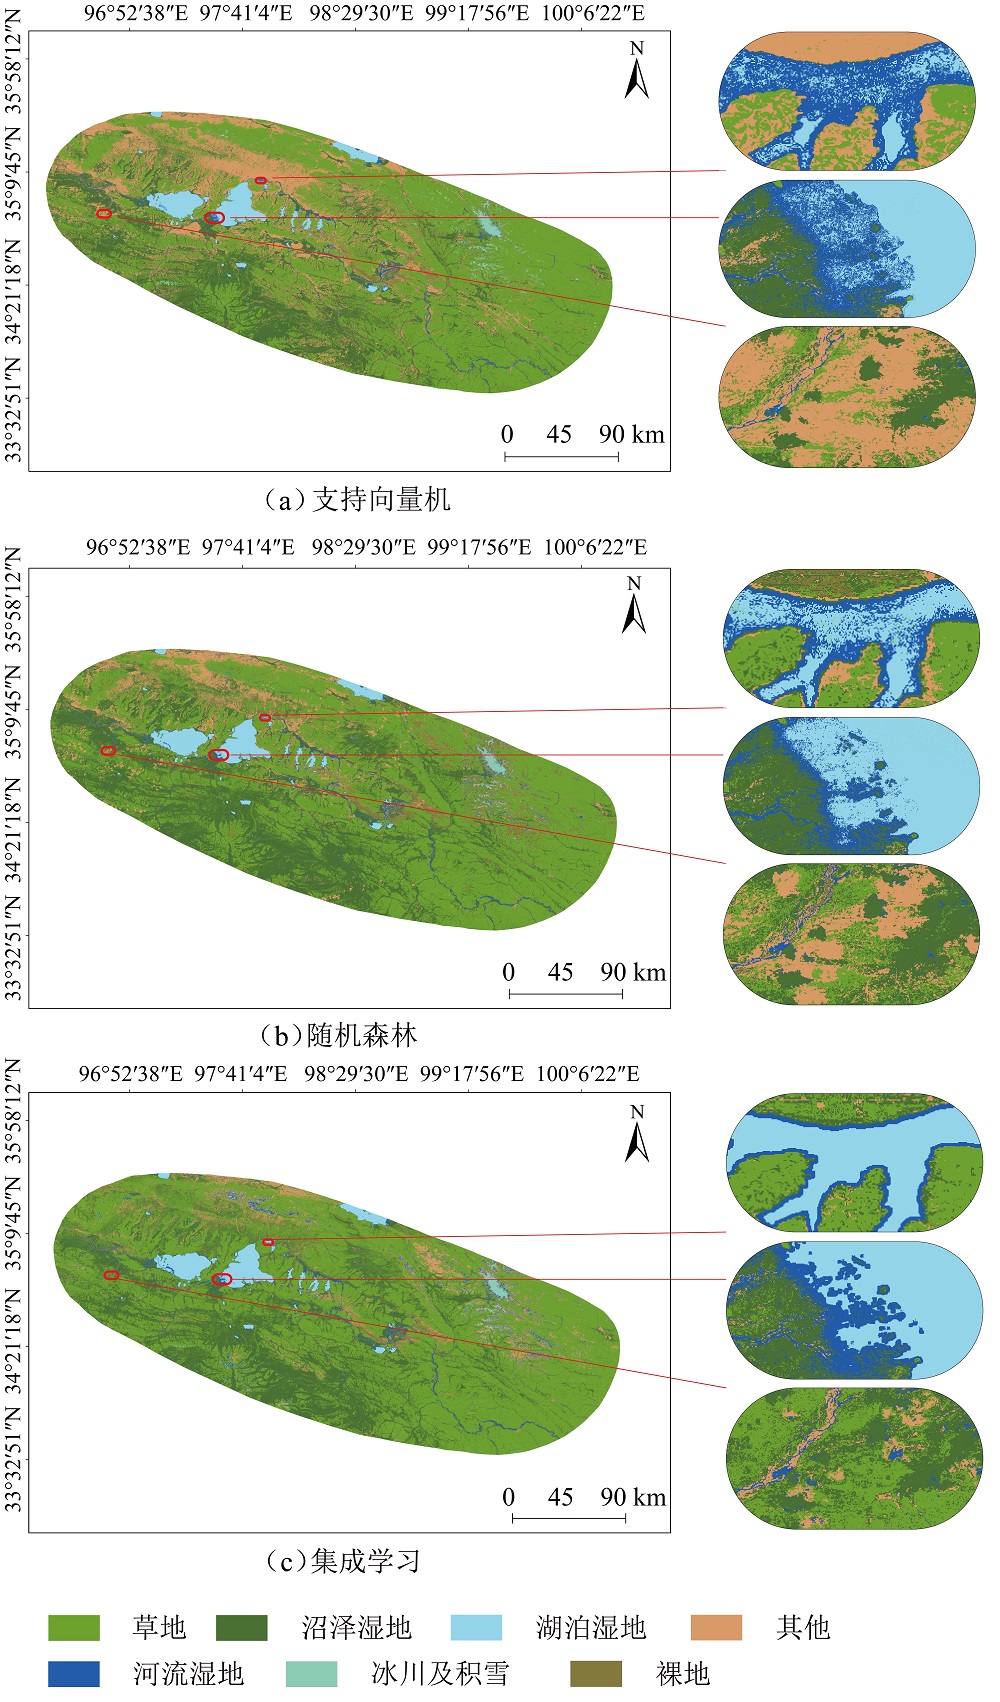
图3 基于特征优选分类结果
Figure 3 Based on the classification results of feature optimization
| 地类 | 2020年面积/ km2 | 2022年面积/ km2 | 变化量/ km2 | 变化率/ % |
|---|---|---|---|---|
| 草地 | 29389.719 | 29264.393 | −125.326 | −0.426 |
| 沼泽湿地 | 16952.379 | 16909.291 | −43.088 | −0.254 |
| 湖泊湿地 | 1643.060 | 1638.089 | −4.971 | −0.303 |
| 河流湿地 | 898.803 | 867.150 | −31.654 | −3.522 |
| 冰川与积雪 | 200.049 | 190.976 | −9.072 | −4.535 |
| 裸地 | 265.692 | 301.852 | 36.160 | 13.610 |
| 其他 | 4285.789 | 4463.740 | 177.950 | 4.152 |
表8 地震前后面积变化情况
Table 8 Change in area before and after the earthquake
| 地类 | 2020年面积/ km2 | 2022年面积/ km2 | 变化量/ km2 | 变化率/ % |
|---|---|---|---|---|
| 草地 | 29389.719 | 29264.393 | −125.326 | −0.426 |
| 沼泽湿地 | 16952.379 | 16909.291 | −43.088 | −0.254 |
| 湖泊湿地 | 1643.060 | 1638.089 | −4.971 | −0.303 |
| 河流湿地 | 898.803 | 867.150 | −31.654 | −3.522 |
| 冰川与积雪 | 200.049 | 190.976 | −9.072 | −4.535 |
| 裸地 | 265.692 | 301.852 | 36.160 | 13.610 |
| 其他 | 4285.789 | 4463.740 | 177.950 | 4.152 |
| 2022年 | 2020年 | ||||||
|---|---|---|---|---|---|---|---|
| 草地 | 沼泽湿地 | 湖泊湿地 | 河流湿地 | 冰川与积雪 | 裸地 | 其他 | |
| 草地 | - | 27.123 | 0.891 | 5.768 | 6.000 | 28.888 | 41.622 |
| 沼泽湿地 | 15.866 | - | 0.538 | 29.466 | 0.515 | 5.978 | 15.328 |
| 湖泊湿地 | 0.018 | 0.078 | - | 4.969 | 0.004 | 0.153 | 0.256 |
| 河流湿地 | 0.266 | 0.990 | 2.54 | - | 0.125 | 3.484 | 3.086 |
| 冰川与积雪 | 0.069 | 0.009 | 0.011 | 0.250 | - | 0.616 | 1.017 |
| 裸地 | 0.106 | 0.084 | 0.064 | 0.692 | 0.053 | - | 3.213 |
| 其他 | 6.344 | 5.085 | 0.827 | 10.142 | 32.491 | 18.858 | - |
表9 地震后研究区地类转移情况
Table 9 Shift of land classes in the studied area after the earthquake %
| 2022年 | 2020年 | ||||||
|---|---|---|---|---|---|---|---|
| 草地 | 沼泽湿地 | 湖泊湿地 | 河流湿地 | 冰川与积雪 | 裸地 | 其他 | |
| 草地 | - | 27.123 | 0.891 | 5.768 | 6.000 | 28.888 | 41.622 |
| 沼泽湿地 | 15.866 | - | 0.538 | 29.466 | 0.515 | 5.978 | 15.328 |
| 湖泊湿地 | 0.018 | 0.078 | - | 4.969 | 0.004 | 0.153 | 0.256 |
| 河流湿地 | 0.266 | 0.990 | 2.54 | - | 0.125 | 3.484 | 3.086 |
| 冰川与积雪 | 0.069 | 0.009 | 0.011 | 0.250 | - | 0.616 | 1.017 |
| 裸地 | 0.106 | 0.084 | 0.064 | 0.692 | 0.053 | - | 3.213 |
| 其他 | 6.344 | 5.085 | 0.827 | 10.142 | 32.491 | 18.858 | - |
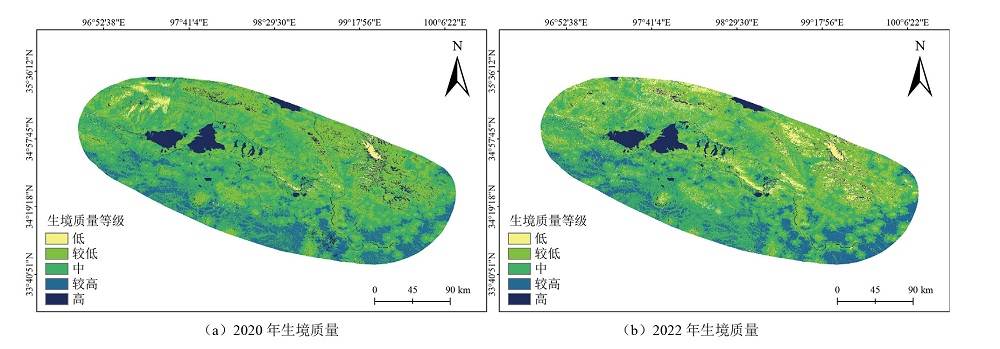
图4 地震前后生境质量
Figure 4 Habitat quality before and after the earthquake
| 等级 | 2020年 | 2022年 | |||
|---|---|---|---|---|---|
| 面积/km2 | 占比/% | 面积/km2 | 占比/% | ||
| 低 | 1175.153 | 2.191 | 4107.405 | 7.658 | |
| 较低 | 15096.779 | 28.147 | 15488.854 | 28.878 | |
| 中 | 27080.554 | 50.490 | 24677.148 | 46.009 | |
| 较高 | 6314.505 | 11.773 | 6147.162 | 11.461 | |
| 高 | 3968.489 | 7.399 | 3214.374 | 5.993 | |
表10 地震前后生境质量指数分级表
Table 10 Habitat quality index classification table before and after the earthquake
| 等级 | 2020年 | 2022年 | |||
|---|---|---|---|---|---|
| 面积/km2 | 占比/% | 面积/km2 | 占比/% | ||
| 低 | 1175.153 | 2.191 | 4107.405 | 7.658 | |
| 较低 | 15096.779 | 28.147 | 15488.854 | 28.878 | |
| 中 | 27080.554 | 50.490 | 24677.148 | 46.009 | |
| 较高 | 6314.505 | 11.773 | 6147.162 | 11.461 | |
| 高 | 3968.489 | 7.399 | 3214.374 | 5.993 | |
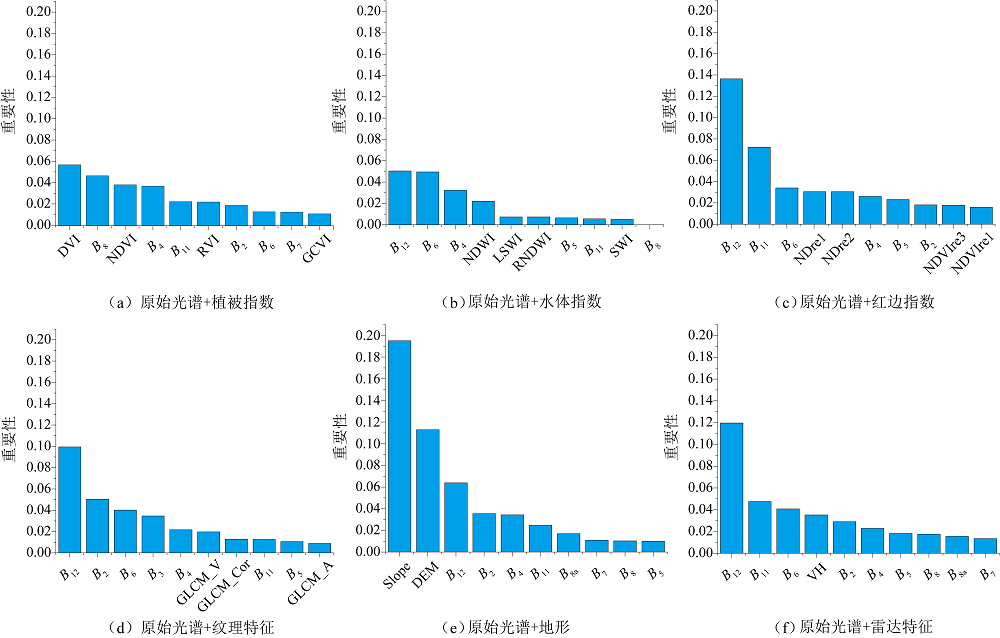
图5 不同组合方案下特征重要性
Figure 5 Importance of features under different combination scenarios
| 类型 | 年份 | NP | PD | TE | ED | LSI | IJI | SPLIT |
|---|---|---|---|---|---|---|---|---|
| 沼泽 | 2020 | 46367 | 8819690429 | 14.976 | 1251.087 | 2379752.850 | 244.654 | 42.344 |
| 2022 | 64749 | 12337772459 | 15.875 | 1833.864 | 3494385.512 | 361.581 | 37.634 | |
| 湖泊 | 2020 | 939 | 178611713 | 1.164 | 19.340 | 36787.546 | 12.498 | 4060.071 |
| 2022 | 1966 | 374616761 | 1.166 | 26.886 | 51230.652 | 17.162 | 4131.102 | |
| 河流 | 2020 | 11004 | 2093123848 | 0.096 | 153.226 | 291458.556 | 130.364 | 385751.218 |
| 2022 | 18849 | 3591633432 | 0.055 | 189.616 | 361308.910 | 164.058 | 992477.949 | |
| 裸地 | 2020 | 3148 | 598796244 | 0.082 | 38.395 | 73032.979 | 60.698 | 1275973.018 |
| 2022 | 7948 | 1514473050 | 0.086 | 64.576 | 123048.077 | 94.431 | 1154555.653 |
表11 地震前后各湿地及裸地景观指数变化情况
Table 11 Changes in wetland and bare land landscape index before and after the earthquake
| 类型 | 年份 | NP | PD | TE | ED | LSI | IJI | SPLIT |
|---|---|---|---|---|---|---|---|---|
| 沼泽 | 2020 | 46367 | 8819690429 | 14.976 | 1251.087 | 2379752.850 | 244.654 | 42.344 |
| 2022 | 64749 | 12337772459 | 15.875 | 1833.864 | 3494385.512 | 361.581 | 37.634 | |
| 湖泊 | 2020 | 939 | 178611713 | 1.164 | 19.340 | 36787.546 | 12.498 | 4060.071 |
| 2022 | 1966 | 374616761 | 1.166 | 26.886 | 51230.652 | 17.162 | 4131.102 | |
| 河流 | 2020 | 11004 | 2093123848 | 0.096 | 153.226 | 291458.556 | 130.364 | 385751.218 |
| 2022 | 18849 | 3591633432 | 0.055 | 189.616 | 361308.910 | 164.058 | 992477.949 | |
| 裸地 | 2020 | 3148 | 598796244 | 0.082 | 38.395 | 73032.979 | 60.698 | 1275973.018 |
| 2022 | 7948 | 1514473050 | 0.086 | 64.576 | 123048.077 | 94.431 | 1154555.653 |
| [1] | ARFA-FATHOLLAHKHANI A, MINAEI M, 2024. Utilizing multitemporal indices and spectral bands of Sentinel-2 to enhance land use and land cover classification with random forest and support vector machine[J]. Advances in Space Research, 74(11): 5580-5590. |
| [2] | BAO Y H, REN J B, 2011. Wetland landscape classification based on the BP neural network in DaLinor Lake area[J]. Procedia Environmental Sciences, 10(Part C): 2360-2366. |
| [3] | CHOWDHURY M S, 2024. Comparison of accuracy and reliability of random forest, support vector machine, artificial neural network and maximum likelihood method in land use/cover classification of urban setting[J]. Environmental Challenges, 14: 100800. |
| [4] | CUI B, DONG W W, YIN B, et al., 2023. Hyperspectral image classification method based on semantic filtering and ensemble learning[J]. Infrared Physics & Technology, 135: 104949. |
| [5] |
CUTLER D R, EDWARDS T C J, BEARD K H, et al., 2007. Random forests for classification in ecology[J]. Ecology, 88(11): 2783-2792.
DOI PMID |
| [6] | DAVRANCHE A, LEFEBVRE G, POULIN B, 2010. Wetland monitoring using classification trees and SPOT-5 seasonal time series[J]. Remote Sensing of Environment, 114(3): 552-562. |
| [7] | DUBEAU P, KING D J, UNBUSHE D, et al., 2017. Mapping the Dabus Wetlands, Ethiopia, using random forest classification of Landsat, PALSAR and topographic data[J]. Remote Sensing, 9(10): 1056. |
| [8] | EVGENIOU T, PONTIL M, 2001. Support vector machines: Theory and applications[J]. Machine Learning and Its Applications, 2049: 249-257. |
| [9] | HILL M J, 2013. Vegetation index suites as indicators of vegetation state in grassland and savanna: An analysis with simulated SENTINEL 2 data for a North American transect[J]. Remote Sensing of Environment, 137: 94-111. |
| [10] | HUNG C C, SONG E, LAN Y, 2019. Image Texture, Texture Features, and Image Texture Classification and Segmentation [M]. Zug,Switzerland: Springer International Publishing: 3-14. |
| [11] | KHALID W, SHAMIM S K, AHMAD A, 2024. Synergistic approach for land use and land cover dynamics prediction in Uttarakhand using cellular automata and artificial neural network[J]. Geomatica, 76(2): 100017. |
| [12] | KHODER A, DORNAIKA F, 2021. Ensemble learning via feature selection and multiple transformed subsets: Application to image classification[J]. Applied Soft Computing, 113(Part B): 108006. |
| [13] | MIENYE I D, SUN Y X, 2022. A survey of ensemble learning: Concepts, algorithms, applications, and prospects[J]. IEEE Access, 10: 99129-99149. |
| [14] | IQBAL N, MUMTAZ R, SHAFI U, et al., 2021. Gray level co-occurrence matrix (GLCM) texture based crop classification using low altitude remote sensing platforms[J]. PeerJ Computer Science, 7(8): e536. |
| [15] | NOBLE W S, 2006. What is a support vector machine?[J]. Nature Biotechnology, 24(12): 1565-1567. |
| [16] | PU R L, LANDRY S, 2012. A comparative analysis of high spatial resolution IKONOS and WorldView-2 imagery for mapping urban tree species[J]. Remote Sensing of Environment, 124: 516-533. |
| [17] | WANG L, DRONOVA I, GONG P, et al., 2012. A new time series vegetation-water index of phenological-hydrological trait across species and functional types for Poyang Lake wetland ecosystem[J]. Remote Sensing of Environment, 125: 49-63. |
| [18] | 常文涛, 王浩, 宁晓刚, 等, 2020. 融合Sentinel-2红边波段和Sentinel-1雷达波段影像的扎龙湿地信息提取[J]. 湿地科学, 18(1): 10-19. |
| CHANG W T, WANG H, NING X G, et al., 2020. Information extraction of Zalong wetland by fusing Sentinel-2 red edge band and Sentinel-1 radar band images[J]. Wetland Science, 18(1): 10-19. | |
| [19] | 邓雅文, 蒋卫国, 王晓雅, 等, 2023. 基于随机森林算法和知识规则的国际湿地城市精细湿地分类——以常德市为例[J]. 遥感学报, 27(6): 1426-1440. |
| DENG Y W, JIANG W G, WANG X Y, et al., 2023. Refined wetland classification of international wetland cities based on the random forest algorithm and knowledge-driven rules: A case study of Changde city, China[J]. National Remote Sensing Bulletin, 27(6): 1426-1440. | |
| [20] | 宫宁, 牛振国, 齐伟, 等, 2016. 中国湿地变化的驱动力分析[J]. 遥感学报, 20(2): 172-183. |
| GONG N, NIU Z G, QI W, et al., 2016. Driving forces of wetland change in China[J]. National Remote Sensing Bulletin, 20(2): 172-183. | |
| [21] | 侯群群, 王飞, 严丽, 2013. 基于灰度共生矩阵的彩色遥感图像纹理特征提取[J]. 国土资源遥感, 25(4): 26-32. |
| HOU Q Q, WANG F, YAN L, 2013. Extraction of color image texture feature based on gray-level co-occurrence matrix[J]. Remote Sensing for Land and Resources, 25(4): 26-32. | |
| [22] | 胡玉福, 邓良基, 匡先辉, 等, 2011. 基于纹理特征的高分辨率遥感图像土地利用分类研究[J]. 地理与地理信息科学, 27(5): 42-45, 68. |
| HU Y F, DENG L J, KUANG X H, et al., 2011. Land use classification of high-resolution remote sensing images based on texture features[J]. Geography and Geo-Information Science, 27(5): 42-45, 68. | |
| [23] | 霍轩琳, 牛振国, 张波, 等, 2023. 高寒湿地分类的遥感特征优选研究[J]. 遥感学报, 27(4): 1045-1060. |
| HUO X L, NIU Z G, ZHANG B, et al., 2023. Remote sensing feature selection for alpine wetland classification[J]. National Remote Sensing Bulletin, 27(4): 1045-1060. | |
| [24] | 黄桂林, 唐小平, 鲍达明, 等, 2009. 湿地分类:GB/T 24708—2009 [S]. 北京: 中国标准出版社: 1-12. |
| HUANG G L, TANG X P, BAO D M, et al., 2009. Wetland classification:GB/T 24708—2009 [S]. Beijing: China Standards Press: 1-12. | |
| [25] | 姜晗兵, 邓文彬, 2024. 基于Sentinel-1和Sentinel-2影像的河南扶沟县洪涝灾害遥感监测评估研究[J]. 中国防汛抗旱, 34(2): 50-55. |
| JIANG H B, DENG W B, 2023. Remote sensing monitoring and evaluation of flood disaster in Fugou County of Henan Province based on Sentinel-1 and Sentinel-2 images[J]. China Flood & Drought Management, 34(2): 50-55. | |
| [26] | 姜星宇, 徐华东, 陈文静, 2023. 基于集成学习和Sentinel-2的落叶松毛虫虫害区识别[J]. 森林工程, 39(6): 147-155. |
| JIANG X Y, XU H D, CHNE W J, 2023. Dendrolimus Superans infected area identification based on ensemble learning model and Sentinel-2 data[J]. Forest Engineering, 39(6): 147-155. | |
| [27] | 角坤升, 2021. 监督学习的时空样本选择策略在土地覆盖分类中的应用[D]. 重庆: 重庆邮电大学: 10-13. |
| JIAO K S, 2021. Supervised learning spatio-temporal sample selection strategy for land cover classification[D]. Chongqing, Chongqing University of Posts and Telecommunications: 10-13. | |
| [28] |
李振今, 王志勇, 叶凯乐, 等, 2023. 联合时间序列相干性和后向散射系数的黄河三角洲湿地分类[J]. 测绘通报 (2): 52-57, 71.
DOI |
| LI Z J, WANG Z Y, YE K L, et al., 2023. Classification of wetlands in the Yellow River Delta by joint time series coherence and backscatter coefficient[J]. Bulletin of Surveying and Mapping (2): 52-57, 71. | |
| [29] | 梁锦涛, 陈超, 张自力, 等, 2023. 一种融合指数与主成分分量的随机森林遥感图像分类方法[J]. 自然资源遥感, 35(3): 35-42. |
| LIANG J T, CHNE C, ZHANG Z L, et al., 2023. A random forest-based method intergrating indices and principal components for classifying remote sensing images[J]. Remote Sensing of Natural Resources, 35(3): 35-42. | |
| [30] | 梁晓瑶, 袁丽华, 宁立新, 等, 2020. 基于InVEST模型的黑龙江省生境质量空间格局及其影响因素[J]. 北京师范大学学报(自然科学版), 56(6): 864-872. |
| LIANG X Y, YUAN L H, NING L X, et al., 2020. Spatial Pattern of Habitat Quality and Its Influencing Factors in Heilongjiang Province Based on InVEST Model[J]. Journal of Beijing Normal University (Natural Science), 56(6): 864-872. | |
| [31] | 刘道芳, 王景山, 李胜阳, 2021. 高分六号卫星红边波段及红边植被指数对水稻分类精度的影响[J]. 河南科学, 39(9): 1417-1423. |
| LIU D F, WANG J S, LI S Y, 2021. The impact of red-edge waveband and red edge vegetation index of GF6 satellite on rice planting area classification accuracy[J]. Henan Science, 39(9): 1417-1423. | |
| [32] | 刘小玉, 李士杰, 何海洋, 等, 2024. 基于InVEST和PLUS模型下的土地利用变化及生境质量演变分析: 以汉中盆地为例[J]. 西北地质, 57(4): 271-284. |
| LIU X Y, LI S J, HE H Y, et al., 2024. Analysis of land use change and habitat quality evolution based on InVEST and PLUs Models: Example from Hanzhong Basin[J]. Northwestern Geology, 57(4): 271-284. | |
| [33] | 刘润红, 梁士楚, 赵红艳, 等, 2017. 中国滨海湿地遥感研究进展[J]. 遥感技术与应用, 32(6): 998-1011. |
| LIU R H, LIANG S C, ZHAO H Y, et al., 2017. Progress of remote sensing research on coastal wetlands in China[J]. Remote Sensing Technology and Applications, 32(6): 998-1011. | |
| [34] | 宁晓刚, 常文涛, 王浩, 等, 2022. 联合GEE与多源遥感数据的黑龙江流域沼泽湿地信息提取[J]. 遥感学报, 26(2): 386-396. |
| NING X G, CHANG W T, WANG H, et al., 2022. Extraction of marsh and wetland information in Heilongjiang Basin by combining GEE and multi-source remote sensing data[J]. National Remote Sensing Bulletin, 26(2): 386-396. | |
| [35] | 牛振国, 景雨航, 张东启, 等, 2024. 气候变化背景下青藏高原湿地生态系统响应特征: 回顾与展望[J]. 气候变化研究进展: 20(5): 509-518. |
| NIU Z G, JING Y H, ZHANG D Q, et al., 2024. Characterizing wetland ecosystem response in the Tibetan Plateau in the context of climate change: A review and outlook[J]. Advances in Climate Change Research: 20(5): 509-518. | |
| [36] | 欧阳志云, 徐卫华, 王学志, 等, 2008. 汶川大地震对生态系统的影响[J]. 生态学报, 28(12): 5801-5809. |
| OUYANG Z Y, XU W H, WANG X Z, et al., 2008. Impacts of the Wenchuan earthquake on ecosystems[J]. Acta Ecologica Sinica, 28(12): 5801-5809. | |
| [37] | 潘宸, 侯浩, 唐伟, 等, 2024. 基于GEE和Sentinel-2影像的杭州城市湿地精细化分类研究[J]. 北京师范大学学报(自然科学版), 60(3): 447-458. |
| PAN C, HOU H, TANG W, et al., 2024. A study on refined classification of urban wetlands in Hangzhou based on GEE and Sentinel-2 images[J]. Journal of Beijing Normal University (Natural Science), 60(3): 447-458. | |
| [38] | 王安琪, 周德民, 宫辉力, 2012. 基于雷达后向散射特性进行湿地植被识别与分类的方法研究[J]. 遥感信息 (2): 15-19. |
| WANG A Q, ZHOU D M, GONG H L, 2012. A methodology for wetland vegetation identification and classification based on radar backscattering characteristics[J]. Remote Sensing Information (2): 15-19. | |
| [39] | 闻铮, 曹国, 2023. 基于样本选择的标签含噪图像分类[J]. 计算机系统应用, 33(2): 54-61. |
| WEN Z, CAO G, 2023. Classification of labeled noisy images based on sample selection[J]. Computer Systems & Applications, 33(2): 54-61. | |
| [40] | 谢文春, 李强峰, 李艳春, 等, 2023. 基于面向对象的吉林一号遥感影像湿地植被群落分类[J]. 林业资源管理 (1): 141-152. |
| XIE W C, LI Q F, LI Y C, et al., 2023. Object-oriented classification of wetland vegetation communities based on Jilin-1 remote sensing images[J]. Forest Resource Management (1): 141-152. | |
| [41] | 徐继伟, 杨云, 2018. 集成学习方法: 研究综述[J]. 云南大学学报(自然科学版), 40(6): 1082-1092. |
| XU J W, YANG Y, 2018. Ensemble learning methods: A research review[J]. Journal of Yunnan University (Natural Sciences Edition), 40(6): 1082-1092. | |
| [42] | 严婷婷, 边红枫, 廖桂项, 等, 2014. 森林湿地遥感信息提取方法研究现状[J]. 国土资源遥感, 26(2): 11-18. |
| YAN T T, BIAN H F, LIAO G X, et al., 2014. Current status of research on remote sensing information extraction methods for forested wetlands[J]. Remote Sensing of Land Resources, 26(2): 11-18. | |
| [43] | 杨迎港, 刘培, 张合兵, 等, 2022. 基于特征优选随机森林算法的GF-2影像分类[J]. 航天返回与遥感, 43(2): 115-126. |
| YANG Y G, LIU P, ZHANG H B, et al., 2022. GF-2 image classification based on feature-preferred random forest algorithm[J]. Spacecraft Recovery & Remote Sensing, 43(2): 115-126. | |
| [44] | 余东行, 张保明, 赵传, 等, 2020. 联合卷积神经网络与集成学习的遥感影像场景分类[J]. 遥感学报, 24(6): 717-727. |
| YU D H, ZHANG B M, ZHAO C, et al., 2020. Combined convolutional neural network and ensemble learning for remote sensing image scene classification[J]. National Remote Sensing Bulletin, 24(6): 717-727. | |
| [45] | 赵蓉, 司奕坤, 2022. 基于InVEST模型的太原市土地利用变化对生境质量的影响研究[J]. 农业与技术, 42(24): 88-93. |
| ZHAO R, SI Y K, 2022. Study on the Impact of Land Use Changes on Habitat Quality in Taiyuan City Based on the InVEST Model[J]. Agriculture & Technology, 42(24): 88-93. | |
| [46] | 曾炜健, 张棋斐, 吴志峰, 等, 2023. 对比多源遥感数据在滨海湿地提取中的差异[J]. 测绘地理信息, 48(3): 71-78. |
| ZENG W J, ZHANG Q F, WU Z F, et al., 2023. Contrasting the differences of multi-source remote sensing data in coastal wetland extraction[J]. Journal of Geomatics, 48(3): 71-78. | |
| [47] | 张宏鸣, 陈丽君, 刘雯, 等, 2021. 基于Stacking集成学习的夏玉米覆盖度估测模型研究[J]. 农业机械学报, 52(7): 195-202. |
| ZHANG H M, CHEN L J, LIU W, et al., 2021. Research on summer corn cover estimation model based on Stacking ensemble learning[J]. Transactions of the Chinese Society for Agricultural Machinery, 52(7): 195-202. | |
| [48] | 张磊, 宫兆宁, 王启为, 等, 2019. Sentinel-2影像多特征优选的黄河三角洲湿地信息提取[J]. 遥感学报, 23(2): 313-326. |
| ZHANG L, GONG Z N, WANG Q W, et al., 2019. Sentinel-2 imagery multi-feature optimization for wetland information extraction in the Yellow River Delta[J]. National Remote Sensing Bulletin, 23(2): 313-326. | |
| [49] | 张露洋, 雷国平, 郭一洋, 等, 2021. 基于Landsat影像的面向对象土地利用分类——以下辽河平原为例[J]. 应用基础与工程科学学报, 29(2): 261-271. |
| ZHANG L Y, LEI G P, GUO Y Y, et al., 2021. Object-oriented land use classification based on Landsat imagery: A case study of the Lower Liaohe Plain[J]. Journal of Basic Science and Engineering, 29(2): 261-271. | |
| [50] | 张卫春, 刘洪斌, 武伟, 2019. 基于随机森林和Sentinel-2影像数据的低山丘陵区土地利用分类——以重庆市江津区李市镇为例[J]. 长江流域资源与环境, 28(6): 1334-1343. |
| ZHANG W C, LIU H B, WU W, 2019. Land use classification of low mountainous and hilly areas based on random forest and Sentinel-2 image data: The case of Lishizhen Town, Jiangjin District, Chongqing[J]. Resources and Environment in the Yangtze Basin, 28(6): 1334-1343. | |
| [51] |
赵泉华, 冯林达, 李玉, 2021. 基于最优极化特征组合的SAR影像湿地分类[J]. 地球信息科学学报, 23(4): 723-736.
DOI |
| ZHAO Q H, FENG L D, LI Y, 2021. Wetland classification of SAR images based on optimal polarization feature combination[J]. Journal of Geo-Information Science, 23(4): 723-736. | |
| [52] |
朱钟正, 陈玉福, 朱文泉, 等, 2017. 适用于多目标遥感自动解译的最佳专题指数筛选[J]. 遥感技术与应用, 32(3): 564-574.
DOI |
| ZHU Z Z, CHEN Y F, ZHU W Q, et al., 2017. Optimal thematic index screening applicable to automatic multi-target remote sensing interpretation[J]. Remote Sensing Technology and Applications, 32(3): 564-574. |
| [1] | 朱锦福, 黄瑞灵, 董志强, 毛晓宁, 周华坤. 青海湖高寒湿地土壤细菌群落对氮添加的响应[J]. 生态环境学报, 2022, 31(6): 1101-1109. |
| 阅读次数 | ||||||
|
全文 |
|
|||||
|
摘要 |
|
|||||