生态环境学报 ›› 2023, Vol. 32 ›› Issue (2): 372-380.DOI: 10.16258/j.cnki.1674-5906.2023.02.017
程鹏1,*( ), 孙明东2, 郝韶楠3
收稿日期:2022-06-20
出版日期:2023-02-18
发布日期:2023-05-11
通讯作者:
*作者简介:程鹏(1989年生),男,副教授,博士研究生,主要研究方向为流域水环境管理。E-mail: pengcheng@sxufe.edu.cn
基金资助:
CHENG Peng1,*(), SUN Mingdong2, HAO Shaonan3
Received:2022-06-20
Online:2023-02-18
Published:2023-05-11
摘要:
河流水质评价对流域水环境管理具有重要意义。由于具有较强的综合性和可比性,水质综合评价指数(WQI)已成为国内外河流水质评价的主流方法,然而因其需要大量的水质参数,需要耗费大量的物力和财力。采用2018年官厅水库上游河流37个监测点的月度监测数据,运用全子集回归模型分训练和验证两个环节建立了对水质参数数量要求较少的适用于官厅水库上游河流水质评价的最简水质综合评价指数(WQImin),并采用建立的WQImin对官厅水库上游河流水质进行了时空分布特征分析。结果显示:在训练环节,水质参数的数量越多,WQImin的训练效果越好,并且考虑水质参数相对权重的模型效果要优于不考虑相对权重的模型。综合考虑水质评价的准确性和易用性,采用CODMn、DO和TN等3个水质参数,且考虑水质参数权重的最简水质综合评价指数模型(WQImin-b3)是训练环节官厅水库上游流域最佳的WQImin模型。在验证环节,WQImin-b3与WQI有较好的线性关系,证实了建立的WQImin-b3模型可代替WQI模型进行官厅水库上游河流水质评价。官厅水库上游河流水质在秋季最好,夏季次之;由于受到融雪期非点源污染的影响,春季官厅水库上游河流水质最差,因而官厅水库上游流域应对融雪期非点源污染给予充分重视。官厅水库上游各河段WQImin平均值的最高值出现在清水河,其次是南洋河;桑干河上游由于工业废水和生活污水的大量排放,其水质状态最差。该研究可为官厅水库上游及其他流域河流水质管理提供科学参考。
中图分类号:
程鹏, 孙明东, 郝韶楠. 基于最简水质综合评价指数的官厅水库上游河流水质评价[J]. 生态环境学报, 2023, 32(2): 372-380.
CHENG Peng, SUN Mingdong, HAO Shaonan. Water Quality Assessment of Upstream Rivers of Guanting Reservoir Based on the Simplest Water Quality Index[J]. Ecology and Environment, 2023, 32(2): 372-380.
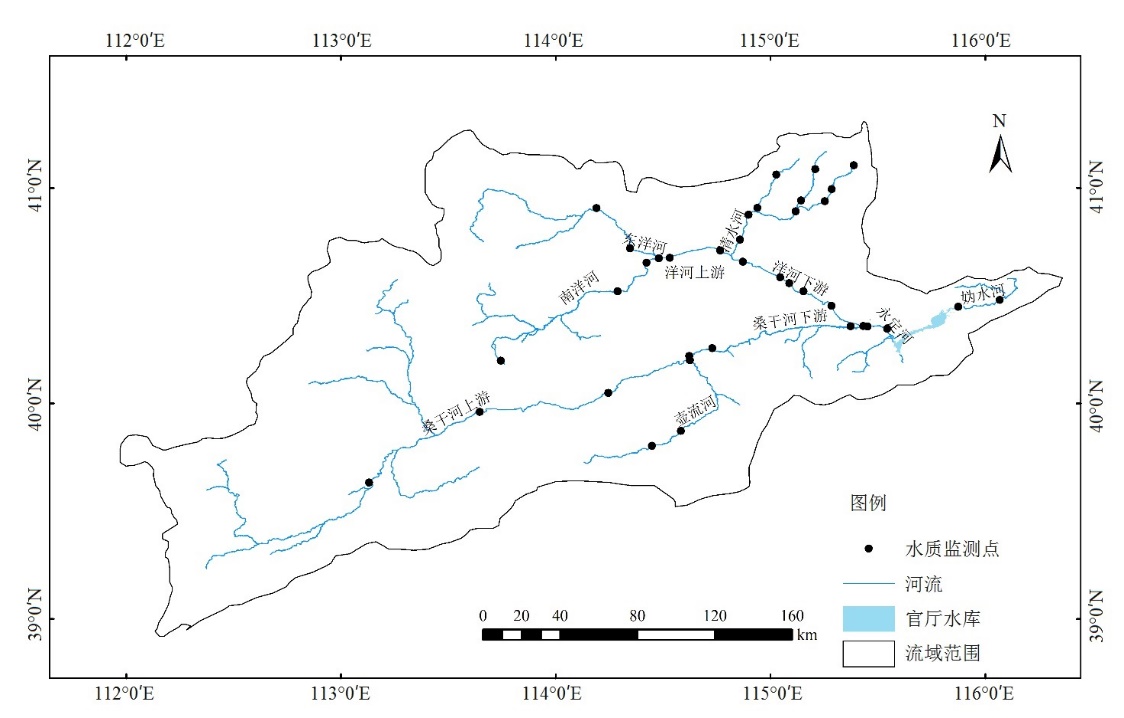
图1 研究区域及水质监测点位置
Figure 1 Location of the study area and water quality monitoring sites
| 水质参数 | 相对权重 (P) | 标准化因子 (Ci) | ||||||||||
|---|---|---|---|---|---|---|---|---|---|---|---|---|
| 100 | 90 | 80 | 70 | 60 | 50 | 40 | 30 | 20 | 10 | 0 | ||
| t/℃ | 1 | 16-21 | 15-16, 21-22 | 14-15, 22-24 | 12-14, 24-26 | 10-12, 26-28 | 5-10, 28-30 | 0-5, 30-32 | -2-0, 32-36 | -4- -2, 36-40 | -6- -4, 36-40 | <-6, >45 |
| pH | 1 | 7 | 7-8 | 8-8.5 | 8.5-9 | 6.5-7 | 6-6.5, 9-9.5 | 5-6, 9.5-10 | 4-5, 10-11 | 3-4, 11-12 | 2-3, 12-13 | 1-2, 13-14 |
| Tur/NTU | 2 | <5 | <10 | <15 | <20 | <25 | <30 | <40 | <60 | <80 | ≤100 | >100 |
| ρ(DO)/(mg·L-1) | 4 | ≥7.5 | >7 | >6.5 | >6 | >5 | >4 | >3.5 | >3 | >2 | ≥1 | <1 |
| ρ(TN)/(mg·L-1) | 2 | <0.1 | <0.2 | <0.35 | <0.5 | <0.75 | <1 | <1.25 | <1.5 | <1.75 | ≤2 | >2 |
| ρ(NH4-N)/(mg·L-1) | 3 | <0.01 | <0.05 | <0.1 | <0.2 | <0.3 | <0.4 | <0.5 | <0.75 | <1 | ≤1.25 | >1.25 |
| ρ(TP)/(mg·L-1) | 1 | <0.01 | <0.02 | <0.05 | <0.1 | <0.15 | <0.2 | <0.25 | <0.3 | <0.35 | ≤0.4 | >0.4 |
| ρ(CODMn)/(mg·L-1) | 3 | <1 | <2 | <3 | <4 | <6 | <8 | <10 | <12 | <14 | ≤15 | >15 |
| ρ(BOD5)/(mg·L-1) | 3 | <0.5 | <2 | <3 | <4 | <5 | <6 | <8 | <10 | <12 | ≤15 | >15 |
表1 WQI及WQImin核算中各水质参数的权重和标准化因子
Table 1 Weights and normalization factors of the parameters used in the calculation of the WQI and WQImin
| 水质参数 | 相对权重 (P) | 标准化因子 (Ci) | ||||||||||
|---|---|---|---|---|---|---|---|---|---|---|---|---|
| 100 | 90 | 80 | 70 | 60 | 50 | 40 | 30 | 20 | 10 | 0 | ||
| t/℃ | 1 | 16-21 | 15-16, 21-22 | 14-15, 22-24 | 12-14, 24-26 | 10-12, 26-28 | 5-10, 28-30 | 0-5, 30-32 | -2-0, 32-36 | -4- -2, 36-40 | -6- -4, 36-40 | <-6, >45 |
| pH | 1 | 7 | 7-8 | 8-8.5 | 8.5-9 | 6.5-7 | 6-6.5, 9-9.5 | 5-6, 9.5-10 | 4-5, 10-11 | 3-4, 11-12 | 2-3, 12-13 | 1-2, 13-14 |
| Tur/NTU | 2 | <5 | <10 | <15 | <20 | <25 | <30 | <40 | <60 | <80 | ≤100 | >100 |
| ρ(DO)/(mg·L-1) | 4 | ≥7.5 | >7 | >6.5 | >6 | >5 | >4 | >3.5 | >3 | >2 | ≥1 | <1 |
| ρ(TN)/(mg·L-1) | 2 | <0.1 | <0.2 | <0.35 | <0.5 | <0.75 | <1 | <1.25 | <1.5 | <1.75 | ≤2 | >2 |
| ρ(NH4-N)/(mg·L-1) | 3 | <0.01 | <0.05 | <0.1 | <0.2 | <0.3 | <0.4 | <0.5 | <0.75 | <1 | ≤1.25 | >1.25 |
| ρ(TP)/(mg·L-1) | 1 | <0.01 | <0.02 | <0.05 | <0.1 | <0.15 | <0.2 | <0.25 | <0.3 | <0.35 | ≤0.4 | >0.4 |
| ρ(CODMn)/(mg·L-1) | 3 | <1 | <2 | <3 | <4 | <6 | <8 | <10 | <12 | <14 | ≤15 | >15 |
| ρ(BOD5)/(mg·L-1) | 3 | <0.5 | <2 | <3 | <4 | <5 | <6 | <8 | <10 | <12 | ≤15 | >15 |
| 河段 | 水质参数 | ||||||||
|---|---|---|---|---|---|---|---|---|---|
| t/℃ | pH | Tur/NTU | ρ(DO)/(mg·L-1) | ρ(TN)/(mg·L-1) | ρ(NH4-N)/(mg·L-1) | ρ(TP)/(mg·L-1) | ρ(CODMn)/(mg·L-1) | ρ(BOD5)/(mg·L-1) | |
| DY | 19.90±3.51 | 8.61±0.14 | 1010.82±1599.55 | 8.46±1.40 | 2.52±1.12 | 0.12±0.08 | 0.07±0.05 | 1.89±0.66 | 0.53±0.40 |
| NY | 19.63±3.53 | 8.70±0.24 | 943.74±1495.72 | 8.88±1.57 | 4.75±2.41 | 0.28±0.53 | 0.10±0.09 | 2.54±0.89 | 0.59±0.52 |
| YS | 18.74±4.40 | 8.72±0.30 | 714.60±1260.35 | 8.56±1.56 | 6.46±5.92 | 1.59±4.01 | 0.27±0.40 | 4.38±2.06 | 2.01±2.73 |
| QS | 16.37±5.23 | 8.79±0.33 | 647.30±1311.38 | 9.40±2.52 | 7.78±3.20 | 0.32±0.46 | 0.12±0.13 | 3.21±2.21 | 1.60±3.14 |
| YX | 20.30±4.98 | 8.67±0.41 | 46.08±49.27 | 9.81±4.85 | 7.61±4.99 | 0.43±0.79 | 0.28±0.39 | 5.96±4.03 | 2.71±2.18 |
| SGS | 18.29±5.14 | 8.77±0.44 | 255.72±584.04 | 11.39±6.76 | 10.93±7.29 | 3.99±6.34 | 1.10±1.15 | 14.86±10.00 | 12.65±22.67 |
| HL | 19.15±5.37 | 8.16±0.72 | 62.57±73.78 | 9.88±6.03 | 4.99±3.54 | 2.48±4.34 | 0.36±0.48 | 7.19±4.53 | 4.88±8.40 |
| SGX | 18.39±4.10 | 8.74±0.35 | 57.03±75.61 | 9.65±4.21 | 6.96±3.46 | 0.26±0.27 | 0.17±0.20 | 11.45±18.95 | 6.65±11.75 |
| YD | 20.97±4.59 | 8.60±0.29 | 17.57±9.98 | 8.91±1.64 | 6.38±2.36 | 0.22±0.11 | 0.17±0.14 | 4.08±0.83 | 1.88±0.85 |
| GS | 19.80±4.35 | 8.71± 0.45 | 60.29 ±39.59 | 6.81 ±1.82 | 3.33 ±3.16 | 0.19 ±0.17 | 0.28 ±0.23 | 5.08 ±3.24 | 1.78 ±1.91 |
表2 官厅水库上游河流水质现状
Table 2 Current status of river water quality in the upstream basin of Guanting Reservoir
| 河段 | 水质参数 | ||||||||
|---|---|---|---|---|---|---|---|---|---|
| t/℃ | pH | Tur/NTU | ρ(DO)/(mg·L-1) | ρ(TN)/(mg·L-1) | ρ(NH4-N)/(mg·L-1) | ρ(TP)/(mg·L-1) | ρ(CODMn)/(mg·L-1) | ρ(BOD5)/(mg·L-1) | |
| DY | 19.90±3.51 | 8.61±0.14 | 1010.82±1599.55 | 8.46±1.40 | 2.52±1.12 | 0.12±0.08 | 0.07±0.05 | 1.89±0.66 | 0.53±0.40 |
| NY | 19.63±3.53 | 8.70±0.24 | 943.74±1495.72 | 8.88±1.57 | 4.75±2.41 | 0.28±0.53 | 0.10±0.09 | 2.54±0.89 | 0.59±0.52 |
| YS | 18.74±4.40 | 8.72±0.30 | 714.60±1260.35 | 8.56±1.56 | 6.46±5.92 | 1.59±4.01 | 0.27±0.40 | 4.38±2.06 | 2.01±2.73 |
| QS | 16.37±5.23 | 8.79±0.33 | 647.30±1311.38 | 9.40±2.52 | 7.78±3.20 | 0.32±0.46 | 0.12±0.13 | 3.21±2.21 | 1.60±3.14 |
| YX | 20.30±4.98 | 8.67±0.41 | 46.08±49.27 | 9.81±4.85 | 7.61±4.99 | 0.43±0.79 | 0.28±0.39 | 5.96±4.03 | 2.71±2.18 |
| SGS | 18.29±5.14 | 8.77±0.44 | 255.72±584.04 | 11.39±6.76 | 10.93±7.29 | 3.99±6.34 | 1.10±1.15 | 14.86±10.00 | 12.65±22.67 |
| HL | 19.15±5.37 | 8.16±0.72 | 62.57±73.78 | 9.88±6.03 | 4.99±3.54 | 2.48±4.34 | 0.36±0.48 | 7.19±4.53 | 4.88±8.40 |
| SGX | 18.39±4.10 | 8.74±0.35 | 57.03±75.61 | 9.65±4.21 | 6.96±3.46 | 0.26±0.27 | 0.17±0.20 | 11.45±18.95 | 6.65±11.75 |
| YD | 20.97±4.59 | 8.60±0.29 | 17.57±9.98 | 8.91±1.64 | 6.38±2.36 | 0.22±0.11 | 0.17±0.14 | 4.08±0.83 | 1.88±0.85 |
| GS | 19.80±4.35 | 8.71± 0.45 | 60.29 ±39.59 | 6.81 ±1.82 | 3.33 ±3.16 | 0.19 ±0.17 | 0.28 ±0.23 | 5.08 ±3.24 | 1.78 ±1.91 |
| 序号 | 线性模型 | Adjusted R2 | P |
|---|---|---|---|
| 1 | 1.357+0.221*lg(p9+1) | 0.600 | <0.001 |
| 2 | 1.092+0.164*lg(p8+1)+0.204*lg(p4+1) | 0.801 | <0.001 |
| 3 | 1.092+0.162*lg(p8+1)+0.203*lg(p4+1)+ 0.019lg*(p5+1) | 0.807 | <0.001 |
| 4 | 1.022+0.200*lg(p4+1)+0.108*lg(p9+1)+0.011*lg(p3+1)+0.097*lg(p6+1) | 0.888 | <0.001 |
| 5 | 1.027+0.075*lg(p8+1)+0.184*lg(p4+1)+0.078*lg(p9+1)+0.006*lg(p5+1)+0.073*lg(p6+1) | 0.924 | <0.001 |
| 6 | 0.921+0.054*lg(p2+1)+0.071*lg(p8+1)+0.185*lg(p4+1)+0.077*lg(p9+1)+ 0.007*lg(p5+1)+0.074*lg(p6+1) | 0.925 | <0.001 |
| 7 | 0.925+0.060*lg(p1+1)+0.056*lg(p8+1)+0.175*lg(p4+1)+0.084*lg(p9+1)+0.030*lg(p7+1)+0.005*lg(p5+1)+0.056*lg(p6+1) | 0.934 | <0.001 |
| 8 | 0.686+0.057*lg(p1+1)+0.134*lg(p2+1)+0.049*lg(p8+1)+0.179*lg(p4+1)+0.079*lg(p9+1)+0.035*lg(p7+1)+0.005*lg(p5+1)+ 0.057*lg(p6+1) | 0.937 | <0.001 |
表3 根据训练数据集得到的包含不同数量水质参数的解释WQI的线性模型
Table 3 Linear models explaining the WQI based on the training data set
| 序号 | 线性模型 | Adjusted R2 | P |
|---|---|---|---|
| 1 | 1.357+0.221*lg(p9+1) | 0.600 | <0.001 |
| 2 | 1.092+0.164*lg(p8+1)+0.204*lg(p4+1) | 0.801 | <0.001 |
| 3 | 1.092+0.162*lg(p8+1)+0.203*lg(p4+1)+ 0.019lg*(p5+1) | 0.807 | <0.001 |
| 4 | 1.022+0.200*lg(p4+1)+0.108*lg(p9+1)+0.011*lg(p3+1)+0.097*lg(p6+1) | 0.888 | <0.001 |
| 5 | 1.027+0.075*lg(p8+1)+0.184*lg(p4+1)+0.078*lg(p9+1)+0.006*lg(p5+1)+0.073*lg(p6+1) | 0.924 | <0.001 |
| 6 | 0.921+0.054*lg(p2+1)+0.071*lg(p8+1)+0.185*lg(p4+1)+0.077*lg(p9+1)+ 0.007*lg(p5+1)+0.074*lg(p6+1) | 0.925 | <0.001 |
| 7 | 0.925+0.060*lg(p1+1)+0.056*lg(p8+1)+0.175*lg(p4+1)+0.084*lg(p9+1)+0.030*lg(p7+1)+0.005*lg(p5+1)+0.056*lg(p6+1) | 0.934 | <0.001 |
| 8 | 0.686+0.057*lg(p1+1)+0.134*lg(p2+1)+0.049*lg(p8+1)+0.179*lg(p4+1)+0.079*lg(p9+1)+0.035*lg(p7+1)+0.005*lg(p5+1)+ 0.057*lg(p6+1) | 0.937 | <0.001 |
| 水质参数 | WQImin-a | WQImin-b | |||||
|---|---|---|---|---|---|---|---|
| 模型 | Adjusted R2 | P | 模型 | Adjusted R2 | P | ||
| CODMn, DO | a2 | 0.715 | <0.001 | b2 | 0.744 | <0.001 | |
| CODMn, DO, TN | a3 | 0.734 | <0.001 | b3 | 0.803 | <0.001 | |
| DO, BOD5, Tur, NH4-N | a4 | 0.892 | <0.001 | b4 | 0.909 | <0.001 | |
| CODMn, DO, BOD5, TN, NH4-N | a5 | 0.903 | <0.001 | b5 | 0.922 | <0.001 | |
表4 根据训练数据集得到的解释WQI的线性模型
Table 4 Linear models explaining WQI based on the training data set
| 水质参数 | WQImin-a | WQImin-b | |||||
|---|---|---|---|---|---|---|---|
| 模型 | Adjusted R2 | P | 模型 | Adjusted R2 | P | ||
| CODMn, DO | a2 | 0.715 | <0.001 | b2 | 0.744 | <0.001 | |
| CODMn, DO, TN | a3 | 0.734 | <0.001 | b3 | 0.803 | <0.001 | |
| DO, BOD5, Tur, NH4-N | a4 | 0.892 | <0.001 | b4 | 0.909 | <0.001 | |
| CODMn, DO, BOD5, TN, NH4-N | a5 | 0.903 | <0.001 | b5 | 0.922 | <0.001 | |
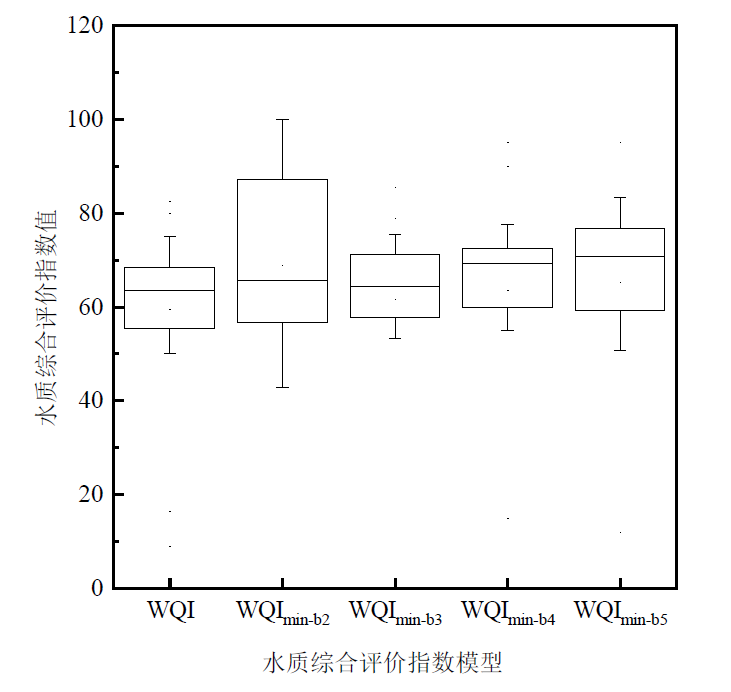
图2 官厅水库上游河流根据训练集得到的WQImin-b与WQI的比较
Figure 2 Comparison of WQImin-b and WQI in the upstream of Guanting Reservoir based on the training data set
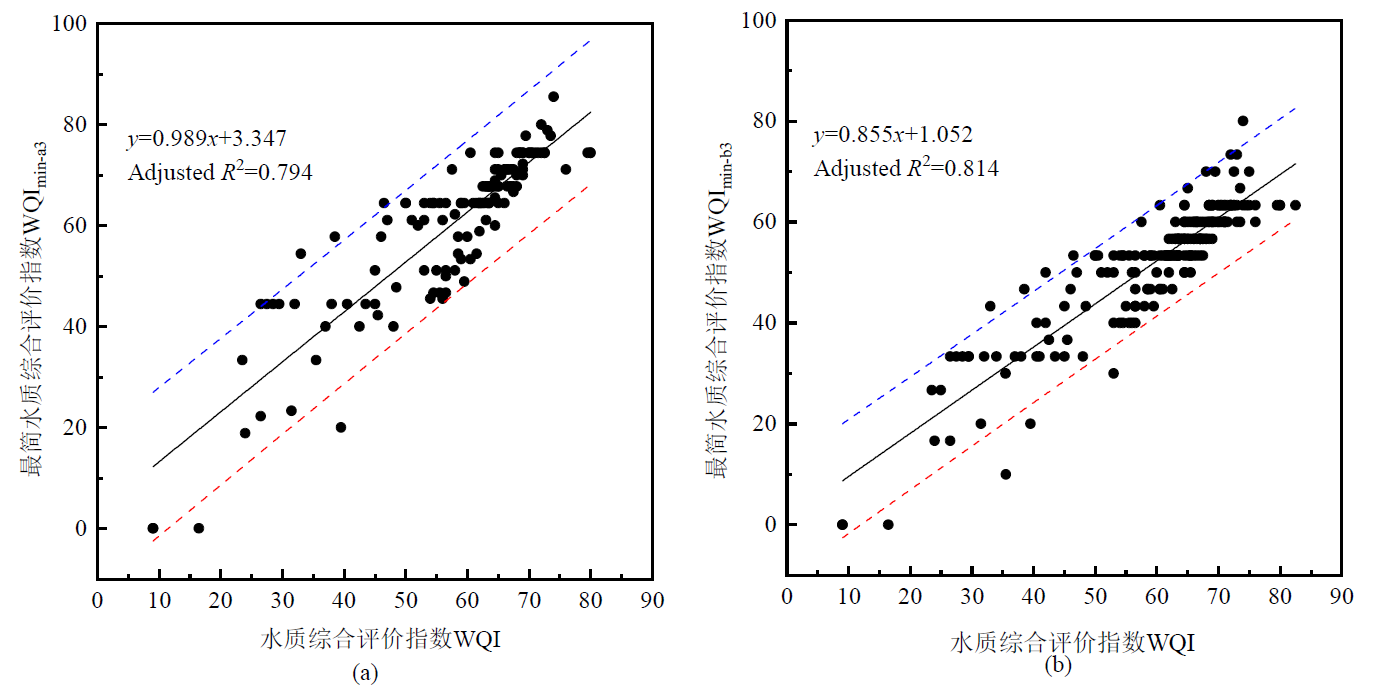
图3 官厅水库上游河流WQImin-a3、WQImin-b3与WQI的验证关系 蓝线、红线分别是95%置信区间的上下限
Figure 3 Relationship between WQI and WQImin-a3 and WQImin-b3 based on the testing data sets
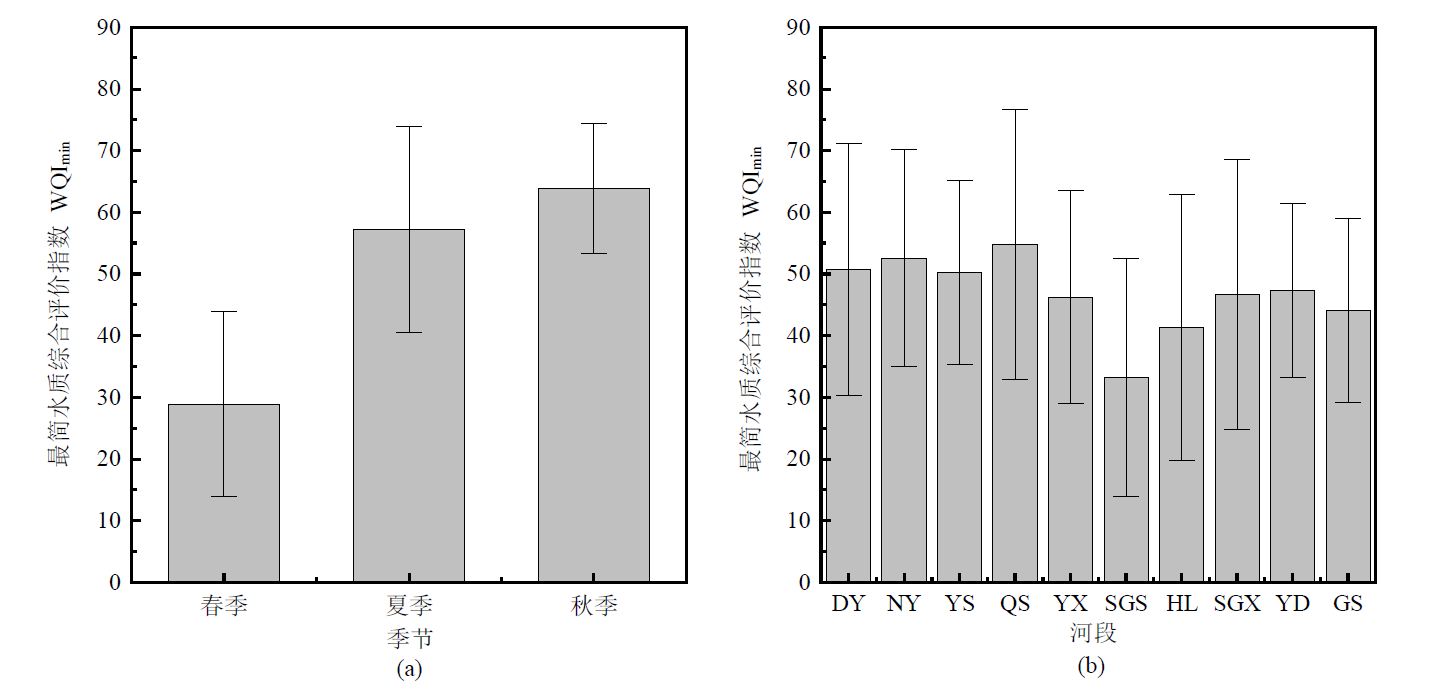
图4 官厅水库上游河流最简水质综合评价指数的季节性变化和空间变化 DY-东洋河;NY-南洋河;YS-洋河上游;QS-清水河;YX-洋河下游;SGS-桑干河上游;HL-壶流河;SGX-桑干河下游;YD-永定河;GS-妫水河
Figure 4 Seasonal variation and spatial variation of WQImin values in the upstream basin of Guanting Reservoir and tributaries
| 季节 | 水质分级 | ||||
|---|---|---|---|---|---|
| 优秀 | 好 | 中等 | 差 | 极差 | |
| 春季 | 0 | 0 | 3/37 (8.1%) | 22/37 (59.5%) | 12/37 (32.4%) |
| 夏季 | 0 | 4/37 (10.8%) | 25/37 (67.6%) | 6/37 (16.2%) | 2/37 (5.4%) |
| 秋季 | 0 | 8/37 (21.6%) | 25/37 (67.6%) | 4/37 (10.8%) | 0 |
| 全部季节 | 0 | 12/111 (10.8%) | 53/111 (47.7%) | 32/111 (28.8%) | 14/111 (12.6%) |
表5 官厅水库上游河流不同水质分级所占比例
Table 5 The proportions of different water quality grades in the upstream of Guanting Reservoir
| 季节 | 水质分级 | ||||
|---|---|---|---|---|---|
| 优秀 | 好 | 中等 | 差 | 极差 | |
| 春季 | 0 | 0 | 3/37 (8.1%) | 22/37 (59.5%) | 12/37 (32.4%) |
| 夏季 | 0 | 4/37 (10.8%) | 25/37 (67.6%) | 6/37 (16.2%) | 2/37 (5.4%) |
| 秋季 | 0 | 8/37 (21.6%) | 25/37 (67.6%) | 4/37 (10.8%) | 0 |
| 全部季节 | 0 | 12/111 (10.8%) | 53/111 (47.7%) | 32/111 (28.8%) | 14/111 (12.6%) |
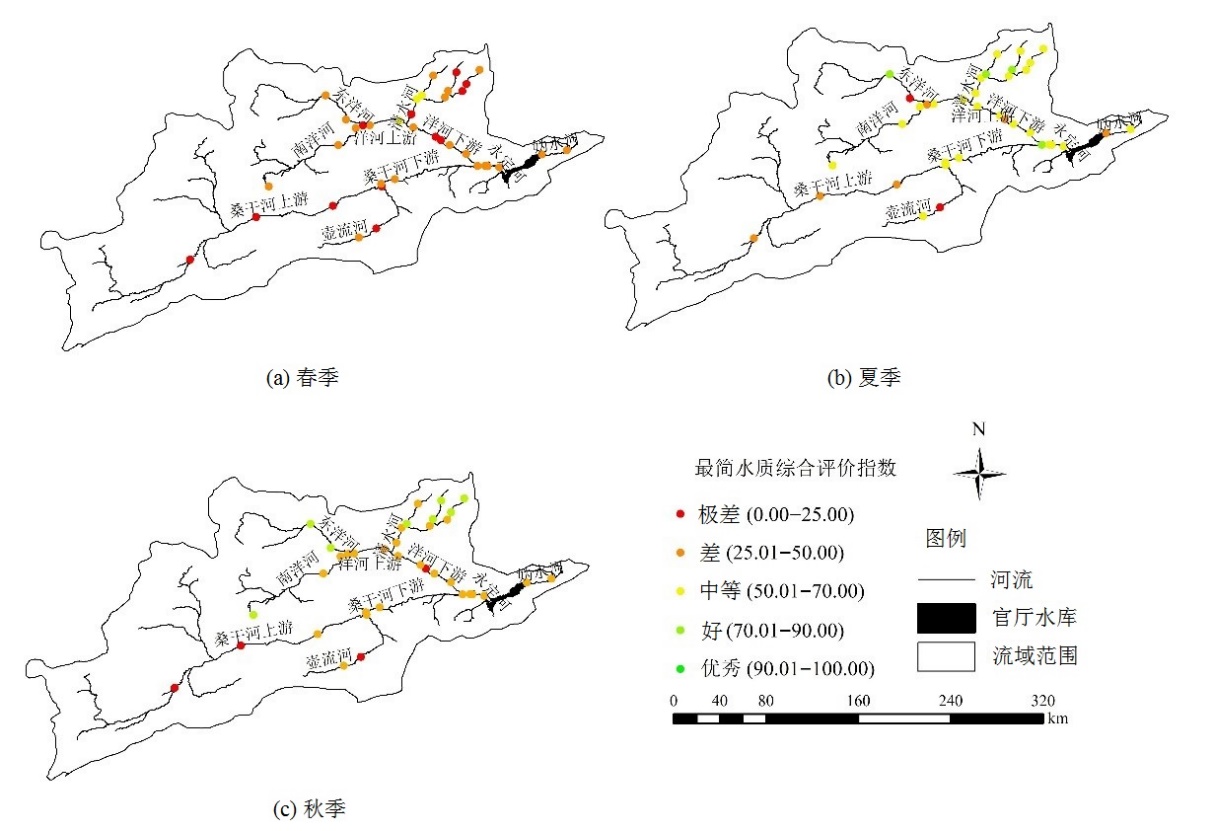
图5 官厅水库上游河流各采样点在春季、夏季和秋季的水质分级
Figure 5 The WQImin grade of each sampling site in the upstream of Guanting Reservoir in spring, summer and autumn
| [1] |
AKKOYUNLU A, AKINER M E, 2012. Pollution evaluation in streams using water quality indices: A case study from Turkey’s Sapanca Lake Basin[J]. Ecological Indicators, 18: 501-511.
DOI URL |
| [2] |
BREZONIK P L, STADELMANN T H, 2002. Analysis and predictive models of stormwater runoff volumes, loads, and pollutant concentrations from watersheds in the Twin Cities metropolitan area, Minnesota, USA[J]. Water Research, 36(7): 1743-1757.
PMID |
| [3] |
CHENG P, LI X Y, SU J J, et al., 2018. Recent water quality trends in a typical semi-arid river with a sharp decrease in streamflow and construction of sewage treatment plants[J]. Environmental Research Letters, 13(1): 014026.
DOI URL |
| [4] |
DOS SANTOS SIMõES F, MOREIRA A B, BISINOTI M C, et al., 2008. Water quality index as a simple indicator of aquaculture effects on aquatic bodies[J]. Ecological Indicators, 8(5): 476-484.
DOI URL |
| [5] |
JONNALAGADDA S, MHERE G, 2001. Water quality of the Odzi River in the eastern highlands of Zimbabwe[J]. Water Research, 35(10): 2371-2376.
DOI PMID |
| [6] |
KAZI T, ARAIN M, JAMALI M K, et al., 2009. Assessment of water quality of polluted lake using multivariate statistical techniques: A case study[J]. Ecotoxicology and Environmental Safety, 72(2): 301-309.
DOI PMID |
| [7] |
NAVEEDULLAH N, HASHMI M Z, YU C, et al., 2016. Water quality characterization of the siling reservoir (Zhejiang, China) using water quality index[J]. CLEAN-Soil, Air, Water, 44(5): 553-562.
DOI URL |
| [8] |
NONG X Z, SHAO D G, ZHONG H, et al., 2020. Evaluation of water quality in the South-to-North Water Diversion Project of China using the water quality index (WQI) method[J]. Water Research, 178: 115781.
DOI URL |
| [9] |
NOORI R, BERNDTSSON R, HOSSEINZADEH M, et al., 2019. A critical review on the application of the National Sanitation Foundation Water Quality Index[J]. Environmental Pollution, 244: 575-587.
DOI PMID |
| [10] |
OHTANI K, 2000. Bootstrapping R2 and adjusted R2 in regression analysis[J]. Economic Modelling, 17(4): 473-483.
DOI URL |
| [11] |
PESCE S F, WUNDERLIN D A, 2000. Use of water quality indices to verify the impact of Córdoba City (Argentina) on Suquı́a River[J]. Water Research, 34(11): 2915-2926.
DOI URL |
| [12] |
SUN W, XIA C Y, XU M Y, et al., 2016. Application of modified water quality indices as indicators to assess the spatial and temporal trends of water quality in the Dongjiang River[J]. Ecological Indicators, 66: 306-312.
DOI URL |
| [13] |
TIAN Y L, JIANG Y, LIU Q, et al., 2019. Using a water quality index to assess the water quality of the upper and middle streams of the Luanhe River, northern China[J]. Science of the Total Environment, 667:142-151.
DOI URL |
| [14] |
TONG S M, LI H R, TUDI M, et al., 2021. Comparison of characteristics, water quality and health risk assessment of trace elements in surface water and groundwater in China[J]. Ecotoxicology and Environmental Safety, 219: 112283.
DOI URL |
| [15] |
UDDIN M G, NASH S, OLBERT A I, 2021. A review of water quality index models and their use for assessing surface water quality[J]. Ecological Indicators, 122: 107218.
DOI URL |
| [16] |
WANG Y W, CHEN Y N, ZHENG X, et al., 2017. Spatio-temporal distribution of fecal indicators in three rivers of the Haihe River Basin, China[J]. Environmental Science and Pollution Research, 24(10): 9036-9047.
DOI URL |
| [17] |
WU Z S, WANG X L, CHEN Y W, et al., 2018. Assessing river water quality using water quality index in Lake Taihu Basin, China[J]. Science of the Total Environment, 612: 914-922.
DOI URL |
| [18] |
WU Z S, LAI X J, LI K Y, 2021. Water quality assessment of rivers in Lake Chaohu Basin (China) using water quality index[J]. Ecological Indicators, 121: 107021.
DOI URL |
| [19] |
YAN T, SHEN S L, ZHOU A N, 2022. Indices and models of surface water quality assessment: Review and perspectives[J]. Environmental Pollution, 308: 119611.
DOI URL |
| [20] |
程鹏, 张汪寿, 2019. 近20年中国大陆人类活动净磷输入的时空变化特征与类群分析[J]. 生态环境学报, 28(3): 540-547.
DOI |
| CHENG P, ZHANG W S, 2019. Spatio-temporal variation characteristics and division analysis of provincial Net Anthropogenic Phosphorus Input in Mainland China in recent twenty years[J]. Ecology and Environmental Sciences, 28(3): 540-547. | |
| [21] | 富天乙, 邹志红, 王晓静, 2014. 基于多元统计和水质标识指数的辽阳太子河水质评价研究[J]. 环境科学学报, 34(2): 473-480. |
| FU T Y, ZOU Z H, WANG X J, 2014. Water quality assessment for Taizi River watershed in Liaoyang section based on multivariate statistical analysis and water quality identification index[J]. Acta Scientiae Circumstantiae, 34(2): 473-480. | |
| [22] | 高星琪, 董志, 李令军, 等, 2019. 官厅水库上游河流水质空间变异多元统计分析[J]. 湿地科学, 17(1): 106-111. |
| GAO X Q, DONG Z, LI L J, et al., 2019. Multivariate statistical analysis on spatial variability of water quality in Guanting Reservoir Upstream Rivers[J]. Wetland Science, 17(1): 106-111. | |
| [23] | 国家环境保护总局, 2002a. 水和废水监测分析方法[M]. 第4版. 北京: 中国环境科学出版社: 243-255. |
| State Environment Protection Agency, 2002a. Monitoring and analysis methods of water and wastewater[M]. 4th edition. Beijing: China Environmental Science Press: 243-255. | |
| [24] | 国家环境保护总局, 2002b. 地表水环境质量标准: GB3838-2002[S]. 北京: 中国环境科学出版社: 2-3. |
| State Environment Protection Agency, 2002b. Environmental quality standards for surface water: GB3838-2002[S]. Beijing: China Environmental Science Press: 2-3. | |
| [25] | 黄宏, 商栩, 梅琨, 等, 2019. 基于Monte Carlo模拟的河流水质评价-以温瑞塘河为例[J]. 中国环境科学, 39(5): 2210-2218. |
| HUANG H, SHANG X, MEI K, et al., 2019. River water quality assessment based on Monte Carlo simulation: A case study of Wen-Rui Tang River[J]. China Environmental Science, 39(5): 2210-2218. | |
| [26] | 嵇晓燕, 侯欢欢, 王姗姗, 等, 2022. 近年全国地表水水质变化特征[J]. 环境科学, 43(10): 4419-4429. |
|
JI X Y, HOU H H, WANG S S, et al., 2022. Variation characteristics of surface water quality in China in cecent years[J]. Environmental Science, 43(10): 4419-4429.
DOI URL |
|
| [27] | 解莹, 李叙勇, 王慧亮, 等, 2012. 滦河流域上游地区主要河流水污染特征及评价[J]. 环境科学学报, 32(3): 645-653. |
| XIE Y, LI X Y, WANG H L, et al., 2012. Stream pollution analysis and hydrochemical assessment of the upper Luanhe River Basin[J]. Acta Scientiae Circumstantiae, 32(3): 645-653. | |
| [28] | 庞丽丽, 董翰川, 冯建华, 等, 2019. 河北张家口季节冻土温度水分时空演化相关性研究[J]. 土壤通报, 50(2): 310-315. |
| PANG L L, DONG H C, FENG J H, et al., 2019. Temporal and spatial correlation of temperature and moisture in seasonal frozen soil in Zhangjiakou, Hebei[J]. Chinese Journal of Soil Science, 50(2): 310-315. | |
| [29] | 钱凯旋, 罗军刚, 连亚妮, 等, 2020. 基于基尼系数的水质模糊综合评价模型及应用[J]. 水电能源科学, 38(1): 36-39. |
| QIAN K X, LUO J G, LIAN Y N, et al., 2020. Fuzzy comprehensive evaluation model of water quality based on Gini coefficient and its application[J]. Water Resources and Power, 38(1): 36-39. | |
| [30] |
邵志江, 郑斌, 汪涛, 2020. 永定河上游主要河流地表水水质时空变化特征[J]. 自然资源学报, 35(6):1338-1347.
DOI |
|
SHAO Z J, ZHENG B, WANG T, 2020. Spatiotemporal variations of surface water quality of main rivers in the upper reaches of Yongding River[J]. Journal of Natural Resources, 35(6): 1338-1347.
DOI URL |
|
| [31] | 田海兰, 程林, 刘西汉, 等, 2019. 基于水质标识指数法的秦皇岛市河流水质评价[J]. 中国农村水利水电 (9): 100-105. |
| TIAN H L, CHENG L, LIU X H, et al., 2019. Application of water quality identification index in water quality evaluation of rivers in Qinhuangdao[J]. China Rural Water and Hydropower (9): 100-105. | |
| [32] | 汪太明, 王业耀, 刘玉萍, 等, 2012. 东北地区春季融雪期非点源污染负荷估算方法及应用[J]. 农业环境科学学报, 31(4): 807-812. |
| WANG T M, WANG Y Y, LIU Y P, et al., 2012. Study and application of estimation method for spring Non-point source pollution in Northeast China[J]. Journal of Agro-Environment Science, 31(4): 807-812. | |
| [33] | 王娟, 付永胜, 易志刚, 等, 2006. 成都市温江区水质现状评价与水环境容量分析[J]. 工业安全与环保, 32(6): 30-32. |
| WANG J, FU Y S, YI Z G, et al., 2006. Assessment on water quality condition of Wenjiang Dist.of Chengdu and analysis on aquatic environment capacity[J]. Industrial Safety and Environmental Protection, 32(6): 30-32. | |
| [34] | 魏静, 郑小刚, 张国维, 等, 2020. 官厅水库、密云水库上游流域地表水氮磷含量现状[J]. 环境工程, 38(9): 101-105, 144. |
| WEI J, ZHENG X G, ZHANG G W, et al., 2020. Nitrogen and phosphorus content of surface water in the Upstream Basin of Guanting Reservoir and Miyun Reservior[J]. Environmental Engineering, 38(9): 101-105, 144. | |
| [35] | 杨育红, 于福荣, 刘中培, 2013. 长春市新立城水库氮磷污染源与污染负荷分析[J]. 云南农业大学学报: 自然科学版, 28(5): 697-701. |
| YANG Y H, YU F R, LIU Z P, 2013. Pollution sources and loads of nitrogen and phosphorus in Xinlicheng Reservoir of Changchun City[J]. Journal of Yunnan Agricultural University (Natural Science Edition), 28(5): 697-701. | |
| [36] | 张敏, 李令军, 赵文慧, 等, 2019. 洋河水质现状及其成因分析[J]. 生态科学, 38(4): 77-84. |
| ZHANG M, LI L J, ZHAO W H, et al., 2019. Present situation of Yanghe water quality and analysis of its causes[J]. Ecological Science, 38(4): 77-84. | |
| [37] | 张翔, 李愫, 2022. 基于主成分分析的北洛河水质时空分布特征及污染源解析[J]. 水土保持通报, 42(4):153-160, 171. |
| ZHANG X, L S, et al., 2022. Spatial and temporal distribution characteristics of water qality in Beiluo River and pollution sources based on principal component analysis[J]. Bulletion of Soil and Water Conservation, 42(4):153-160, 171. | |
| [38] | 朱挺兵, 杜红春, 胡晓娜, 等, 2022. 基于水质综合指数的澜沧江西藏段水质评价及其影响因素[J]. 淡水渔业, 52(5): 104-111. |
| ZHU T B, DU H C, HU X N, et al., 2022. Evaluation and water quality influencing factors of the Tibet reach of the Lancang River based on the water quality index[J]. Freshwater Fisheries, 52(5): 104-111. | |
| [39] | 朱长军, 赵方星, 李步东, 等, 2021. 基于主成分分析及WQImin的大黑汀水库水质评价[J]. 河南师范大学学报: 自然科学版, 49(3): 52-58, 124. |
| ZHU C J, ZHAO F X, LI B D, et al., 2021. Water quality evaluation of Daheiting reservoir based on principal component analysis and WQImin[J]. Journal of Henan Normal University (Natural Science Edition), 49(3): 52-58, 124. |
| [1] | 姜永伟, 丁振军, 袁俊斌, 张峥, 李杨, 问青春, 王业耀, 金小伟. 辽宁省主要河流底栖动物群落结构及水质评价研究[J]. 生态环境学报, 2023, 32(5): 969-979. |
| [2] | 嵇晓燕, 王姗姗, 杨凯, 任蓓. 2016—2020年中国地表水中总氮浓度时空变化特征分析[J]. 生态环境学报, 2022, 31(6): 1184-1192. |
| 阅读次数 | ||||||
|
全文 |
|
|||||
|
摘要 |
|
|||||